Free Statistics

of Irreproducible Research!

Author's title

Author*Unverified author*
R Software Modulerwasp_autocorrelation.wasp
Title produced by software(Partial) Autocorrelation Function
Date of computationSat, 24 Oct 2015 20:36:47 +0100
Cite this page as followsStatistical Computations at FreeStatistics.org, Office for Research Development and Education, URL https://freestatistics.org/blog/index.php?v=date/2015/Oct/24/t1445715566t327jqa4kjs1cm7.htm/, Retrieved Wed, 15 May 2024 23:52:17 +0000
Statistical Computations at FreeStatistics.org, Office for Research Development and Education, URL https://freestatistics.org/blog/index.php?pk=283063, Retrieved Wed, 15 May 2024 23:52:17 +0000
QR Codes:

Original text written by user:
IsPrivate?No (this computation is public)
User-defined keywords
Estimated Impact79
Family? (F = Feedback message, R = changed R code, M = changed R Module, P = changed Parameters, D = changed Data)
-     [Mean Plot] [] [2015-10-24 19:06:33] [b0aab221b45ede45fa239f31e845a68c]
- RMPD    [(Partial) Autocorrelation Function] [] [2015-10-24 19:36:47] [9f6f73fad9c1c9780dcaf60f96d9a566] [Current]
Feedback Forum

Post a new message
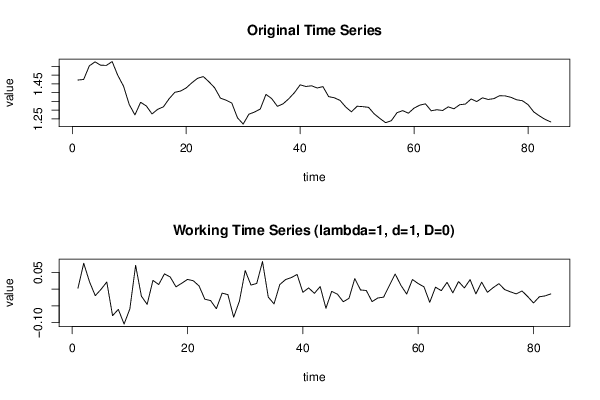
Dataseries X:
1.4718
1.4748
1.5527
1.5751
1.5557
1.5553
1.577
1.4975
1.4369
1.3322
1.2732
1.3449
1.3239
1.2785
1.305
1.319
1.365
1.4016
1.4088
1.4268
1.4562
1.4816
1.4914
1.4614
1.4272
1.3686
1.3569
1.3406
1.2565
1.2209
1.277
1.2894
1.3067
1.3898
1.3661
1.322
1.336
1.3649
1.3999
1.4442
1.4349
1.4388
1.4264
1.4343
1.377
1.3706
1.3556
1.3179
1.2905
1.3224
1.3201
1.3162
1.2789
1.2526
1.2288
1.24
1.2856
1.2974
1.2828
1.3119
1.3288
1.3359
1.2964
1.3026
1.2982
1.3189
1.308
1.331
1.3348
1.3635
1.3493
1.3704
1.361
1.3658
1.3823
1.3812
1.3732
1.3592
1.3539
1.3316
1.2901
1.2673
1.2472
1.2331


Summary of computational transaction
Raw Inputview raw input (R code)
Raw Outputview raw output of R engine
Computing time1 seconds
R Server'Gwilym Jenkins' @ jenkins.wessa.net

\begin{tabular}{lllllllll}
\hline
Summary of computational transaction \tabularnewline
Raw Input & view raw input (R code)  \tabularnewline
Raw Output & view raw output of R engine  \tabularnewline
Computing time & 1 seconds \tabularnewline
R Server & 'Gwilym Jenkins' @ jenkins.wessa.net \tabularnewline
\hline
\end{tabular}
%Source: https://freestatistics.org/blog/index.php?pk=283063&T=0

[TABLE]
[ROW][C]Summary of computational transaction[/C][/ROW]
[ROW][C]Raw Input[/C][C]view raw input (R code) [/C][/ROW]
[ROW][C]Raw Output[/C][C]view raw output of R engine [/C][/ROW]
[ROW][C]Computing time[/C][C]1 seconds[/C][/ROW]
[ROW][C]R Server[/C][C]'Gwilym Jenkins' @ jenkins.wessa.net[/C][/ROW]
[/TABLE]
Source: https://freestatistics.org/blog/index.php?pk=283063&T=0

Globally Unique Identifier (entire table): ba.freestatistics.org/blog/index.php?pk=283063&T=0

As an alternative you can also use a QR Code:  

The GUIDs for individual cells are displayed in the table below:

Summary of computational transaction
Raw Inputview raw input (R code)
Raw Outputview raw output of R engine
Computing time1 seconds
R Server'Gwilym Jenkins' @ jenkins.wessa.net


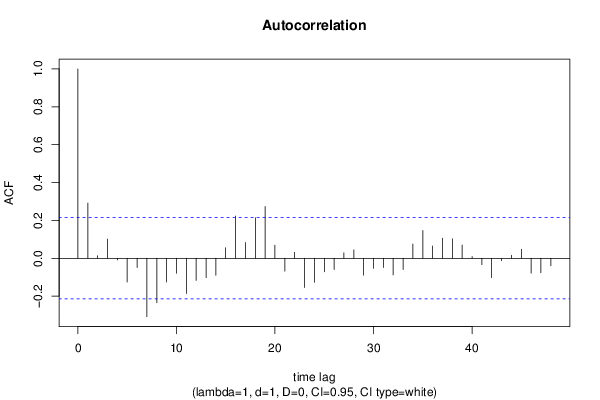
Autocorrelation Function
Time lag kACF(k)T-STATP-value
10.2911392.65240.004787
20.0133810.12190.451635
30.1009440.91960.180212
4-0.008627-0.07860.468771
5-0.12576-1.14570.1276
6-0.048912-0.44560.328521
7-0.308542-2.8110.00308
8-0.234943-2.14040.017627
9-0.125663-1.14480.127782
10-0.079261-0.72210.236131
11-0.186401-1.69820.046609
12-0.117036-1.06620.144702
13-0.102481-0.93360.176596
14-0.089472-0.81510.208666
150.0557260.50770.306509
160.2224192.02630.022971
170.0833520.75940.22489
180.2143021.95240.027132
190.2733142.490.007385
200.0690810.62940.265421
21-0.068274-0.6220.267821
220.031680.28860.386797
23-0.154942-1.41160.080905
24-0.126905-1.15620.125467
25-0.071028-0.64710.259678
26-0.059315-0.54040.295189
270.0282680.25750.398704
280.0441990.40270.344113
29-0.089299-0.81360.209114
30-0.053361-0.48610.314073
31-0.0486-0.44280.329542
32-0.087966-0.80140.212592
33-0.059613-0.54310.294259
340.0751240.68440.247811
350.146721.33670.09249
360.0649320.59160.277877
370.1059630.96540.168583
380.1024730.93360.176616
390.0701680.63930.262205
400.0087560.07980.468306
41-0.033632-0.30640.380033
42-0.102523-0.9340.176499
43-0.013453-0.12260.451375
440.0159710.14550.442332
450.0475440.43310.333015
46-0.078794-0.71790.237432
47-0.076613-0.6980.243572
48-0.039991-0.36430.358267

\begin{tabular}{lllllllll}
\hline
Autocorrelation Function \tabularnewline
Time lag k & ACF(k) & T-STAT & P-value \tabularnewline
1 & 0.291139 & 2.6524 & 0.004787 \tabularnewline
2 & 0.013381 & 0.1219 & 0.451635 \tabularnewline
3 & 0.100944 & 0.9196 & 0.180212 \tabularnewline
4 & -0.008627 & -0.0786 & 0.468771 \tabularnewline
5 & -0.12576 & -1.1457 & 0.1276 \tabularnewline
6 & -0.048912 & -0.4456 & 0.328521 \tabularnewline
7 & -0.308542 & -2.811 & 0.00308 \tabularnewline
8 & -0.234943 & -2.1404 & 0.017627 \tabularnewline
9 & -0.125663 & -1.1448 & 0.127782 \tabularnewline
10 & -0.079261 & -0.7221 & 0.236131 \tabularnewline
11 & -0.186401 & -1.6982 & 0.046609 \tabularnewline
12 & -0.117036 & -1.0662 & 0.144702 \tabularnewline
13 & -0.102481 & -0.9336 & 0.176596 \tabularnewline
14 & -0.089472 & -0.8151 & 0.208666 \tabularnewline
15 & 0.055726 & 0.5077 & 0.306509 \tabularnewline
16 & 0.222419 & 2.0263 & 0.022971 \tabularnewline
17 & 0.083352 & 0.7594 & 0.22489 \tabularnewline
18 & 0.214302 & 1.9524 & 0.027132 \tabularnewline
19 & 0.273314 & 2.49 & 0.007385 \tabularnewline
20 & 0.069081 & 0.6294 & 0.265421 \tabularnewline
21 & -0.068274 & -0.622 & 0.267821 \tabularnewline
22 & 0.03168 & 0.2886 & 0.386797 \tabularnewline
23 & -0.154942 & -1.4116 & 0.080905 \tabularnewline
24 & -0.126905 & -1.1562 & 0.125467 \tabularnewline
25 & -0.071028 & -0.6471 & 0.259678 \tabularnewline
26 & -0.059315 & -0.5404 & 0.295189 \tabularnewline
27 & 0.028268 & 0.2575 & 0.398704 \tabularnewline
28 & 0.044199 & 0.4027 & 0.344113 \tabularnewline
29 & -0.089299 & -0.8136 & 0.209114 \tabularnewline
30 & -0.053361 & -0.4861 & 0.314073 \tabularnewline
31 & -0.0486 & -0.4428 & 0.329542 \tabularnewline
32 & -0.087966 & -0.8014 & 0.212592 \tabularnewline
33 & -0.059613 & -0.5431 & 0.294259 \tabularnewline
34 & 0.075124 & 0.6844 & 0.247811 \tabularnewline
35 & 0.14672 & 1.3367 & 0.09249 \tabularnewline
36 & 0.064932 & 0.5916 & 0.277877 \tabularnewline
37 & 0.105963 & 0.9654 & 0.168583 \tabularnewline
38 & 0.102473 & 0.9336 & 0.176616 \tabularnewline
39 & 0.070168 & 0.6393 & 0.262205 \tabularnewline
40 & 0.008756 & 0.0798 & 0.468306 \tabularnewline
41 & -0.033632 & -0.3064 & 0.380033 \tabularnewline
42 & -0.102523 & -0.934 & 0.176499 \tabularnewline
43 & -0.013453 & -0.1226 & 0.451375 \tabularnewline
44 & 0.015971 & 0.1455 & 0.442332 \tabularnewline
45 & 0.047544 & 0.4331 & 0.333015 \tabularnewline
46 & -0.078794 & -0.7179 & 0.237432 \tabularnewline
47 & -0.076613 & -0.698 & 0.243572 \tabularnewline
48 & -0.039991 & -0.3643 & 0.358267 \tabularnewline
\hline
\end{tabular}
%Source: https://freestatistics.org/blog/index.php?pk=283063&T=1

[TABLE]
[ROW][C]Autocorrelation Function[/C][/ROW]
[ROW][C]Time lag k[/C][C]ACF(k)[/C][C]T-STAT[/C][C]P-value[/C][/ROW]
[ROW][C]1[/C][C]0.291139[/C][C]2.6524[/C][C]0.004787[/C][/ROW]
[ROW][C]2[/C][C]0.013381[/C][C]0.1219[/C][C]0.451635[/C][/ROW]
[ROW][C]3[/C][C]0.100944[/C][C]0.9196[/C][C]0.180212[/C][/ROW]
[ROW][C]4[/C][C]-0.008627[/C][C]-0.0786[/C][C]0.468771[/C][/ROW]
[ROW][C]5[/C][C]-0.12576[/C][C]-1.1457[/C][C]0.1276[/C][/ROW]
[ROW][C]6[/C][C]-0.048912[/C][C]-0.4456[/C][C]0.328521[/C][/ROW]
[ROW][C]7[/C][C]-0.308542[/C][C]-2.811[/C][C]0.00308[/C][/ROW]
[ROW][C]8[/C][C]-0.234943[/C][C]-2.1404[/C][C]0.017627[/C][/ROW]
[ROW][C]9[/C][C]-0.125663[/C][C]-1.1448[/C][C]0.127782[/C][/ROW]
[ROW][C]10[/C][C]-0.079261[/C][C]-0.7221[/C][C]0.236131[/C][/ROW]
[ROW][C]11[/C][C]-0.186401[/C][C]-1.6982[/C][C]0.046609[/C][/ROW]
[ROW][C]12[/C][C]-0.117036[/C][C]-1.0662[/C][C]0.144702[/C][/ROW]
[ROW][C]13[/C][C]-0.102481[/C][C]-0.9336[/C][C]0.176596[/C][/ROW]
[ROW][C]14[/C][C]-0.089472[/C][C]-0.8151[/C][C]0.208666[/C][/ROW]
[ROW][C]15[/C][C]0.055726[/C][C]0.5077[/C][C]0.306509[/C][/ROW]
[ROW][C]16[/C][C]0.222419[/C][C]2.0263[/C][C]0.022971[/C][/ROW]
[ROW][C]17[/C][C]0.083352[/C][C]0.7594[/C][C]0.22489[/C][/ROW]
[ROW][C]18[/C][C]0.214302[/C][C]1.9524[/C][C]0.027132[/C][/ROW]
[ROW][C]19[/C][C]0.273314[/C][C]2.49[/C][C]0.007385[/C][/ROW]
[ROW][C]20[/C][C]0.069081[/C][C]0.6294[/C][C]0.265421[/C][/ROW]
[ROW][C]21[/C][C]-0.068274[/C][C]-0.622[/C][C]0.267821[/C][/ROW]
[ROW][C]22[/C][C]0.03168[/C][C]0.2886[/C][C]0.386797[/C][/ROW]
[ROW][C]23[/C][C]-0.154942[/C][C]-1.4116[/C][C]0.080905[/C][/ROW]
[ROW][C]24[/C][C]-0.126905[/C][C]-1.1562[/C][C]0.125467[/C][/ROW]
[ROW][C]25[/C][C]-0.071028[/C][C]-0.6471[/C][C]0.259678[/C][/ROW]
[ROW][C]26[/C][C]-0.059315[/C][C]-0.5404[/C][C]0.295189[/C][/ROW]
[ROW][C]27[/C][C]0.028268[/C][C]0.2575[/C][C]0.398704[/C][/ROW]
[ROW][C]28[/C][C]0.044199[/C][C]0.4027[/C][C]0.344113[/C][/ROW]
[ROW][C]29[/C][C]-0.089299[/C][C]-0.8136[/C][C]0.209114[/C][/ROW]
[ROW][C]30[/C][C]-0.053361[/C][C]-0.4861[/C][C]0.314073[/C][/ROW]
[ROW][C]31[/C][C]-0.0486[/C][C]-0.4428[/C][C]0.329542[/C][/ROW]
[ROW][C]32[/C][C]-0.087966[/C][C]-0.8014[/C][C]0.212592[/C][/ROW]
[ROW][C]33[/C][C]-0.059613[/C][C]-0.5431[/C][C]0.294259[/C][/ROW]
[ROW][C]34[/C][C]0.075124[/C][C]0.6844[/C][C]0.247811[/C][/ROW]
[ROW][C]35[/C][C]0.14672[/C][C]1.3367[/C][C]0.09249[/C][/ROW]
[ROW][C]36[/C][C]0.064932[/C][C]0.5916[/C][C]0.277877[/C][/ROW]
[ROW][C]37[/C][C]0.105963[/C][C]0.9654[/C][C]0.168583[/C][/ROW]
[ROW][C]38[/C][C]0.102473[/C][C]0.9336[/C][C]0.176616[/C][/ROW]
[ROW][C]39[/C][C]0.070168[/C][C]0.6393[/C][C]0.262205[/C][/ROW]
[ROW][C]40[/C][C]0.008756[/C][C]0.0798[/C][C]0.468306[/C][/ROW]
[ROW][C]41[/C][C]-0.033632[/C][C]-0.3064[/C][C]0.380033[/C][/ROW]
[ROW][C]42[/C][C]-0.102523[/C][C]-0.934[/C][C]0.176499[/C][/ROW]
[ROW][C]43[/C][C]-0.013453[/C][C]-0.1226[/C][C]0.451375[/C][/ROW]
[ROW][C]44[/C][C]0.015971[/C][C]0.1455[/C][C]0.442332[/C][/ROW]
[ROW][C]45[/C][C]0.047544[/C][C]0.4331[/C][C]0.333015[/C][/ROW]
[ROW][C]46[/C][C]-0.078794[/C][C]-0.7179[/C][C]0.237432[/C][/ROW]
[ROW][C]47[/C][C]-0.076613[/C][C]-0.698[/C][C]0.243572[/C][/ROW]
[ROW][C]48[/C][C]-0.039991[/C][C]-0.3643[/C][C]0.358267[/C][/ROW]
[/TABLE]
Source: https://freestatistics.org/blog/index.php?pk=283063&T=1

Globally Unique Identifier (entire table): ba.freestatistics.org/blog/index.php?pk=283063&T=1

As an alternative you can also use a QR Code:  

The GUIDs for individual cells are displayed in the table below:

Autocorrelation Function
Time lag kACF(k)T-STATP-value
10.2911392.65240.004787
20.0133810.12190.451635
30.1009440.91960.180212
4-0.008627-0.07860.468771
5-0.12576-1.14570.1276
6-0.048912-0.44560.328521
7-0.308542-2.8110.00308
8-0.234943-2.14040.017627
9-0.125663-1.14480.127782
10-0.079261-0.72210.236131
11-0.186401-1.69820.046609
12-0.117036-1.06620.144702
13-0.102481-0.93360.176596
14-0.089472-0.81510.208666
150.0557260.50770.306509
160.2224192.02630.022971
170.0833520.75940.22489
180.2143021.95240.027132
190.2733142.490.007385
200.0690810.62940.265421
21-0.068274-0.6220.267821
220.031680.28860.386797
23-0.154942-1.41160.080905
24-0.126905-1.15620.125467
25-0.071028-0.64710.259678
26-0.059315-0.54040.295189
270.0282680.25750.398704
280.0441990.40270.344113
29-0.089299-0.81360.209114
30-0.053361-0.48610.314073
31-0.0486-0.44280.329542
32-0.087966-0.80140.212592
33-0.059613-0.54310.294259
340.0751240.68440.247811
350.146721.33670.09249
360.0649320.59160.277877
370.1059630.96540.168583
380.1024730.93360.176616
390.0701680.63930.262205
400.0087560.07980.468306
41-0.033632-0.30640.380033
42-0.102523-0.9340.176499
43-0.013453-0.12260.451375
440.0159710.14550.442332
450.0475440.43310.333015
46-0.078794-0.71790.237432
47-0.076613-0.6980.243572
48-0.039991-0.36430.358267


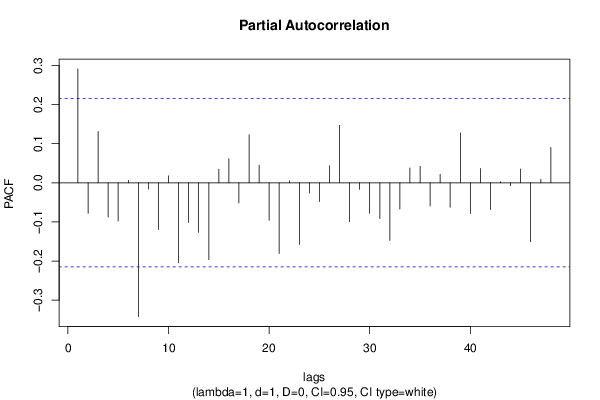
Partial Autocorrelation Function
Time lag kPACF(k)T-STATP-value
10.2911392.65240.004787
2-0.077992-0.71050.23968
30.1313131.19630.11749
4-0.087224-0.79460.214542
5-0.097526-0.88850.188418
60.0062840.05730.477241
7-0.342118-3.11680.001256
8-0.015981-0.14560.442298
9-0.119325-1.08710.14007
100.0178220.16240.435706
11-0.204264-1.86090.033147
12-0.101556-0.92520.178766
13-0.126649-1.15380.125942
14-0.196417-1.78940.038595
150.0346690.31590.376455
160.0614080.55950.288678
17-0.051365-0.4680.320521
180.1228671.11940.133106
190.0450790.41070.341179
20-0.095797-0.87280.192658
21-0.180855-1.64770.051601
220.0054850.050.480133
23-0.157519-1.43510.077513
24-0.026062-0.23740.406452
25-0.047601-0.43370.332829
260.043360.3950.346918
270.146961.33890.092134
28-0.099444-0.9060.183785
29-0.016784-0.15290.439419
30-0.078146-0.71190.239247
31-0.09145-0.83310.203576
32-0.147561-1.34430.09125
33-0.066811-0.60870.272201
340.0377610.3440.365849
350.0421840.38430.350865
36-0.058919-0.53680.296429
370.0218240.19880.421444
38-0.062343-0.5680.285793
390.1277091.16350.123984
40-0.078296-0.71330.238828
410.0366490.33390.369654
42-0.068076-0.62020.268413
430.00310.02820.48877
44-0.007264-0.06620.473697
450.0350360.31920.375191
46-0.150625-1.37230.08684
470.0092770.08450.466425
480.090470.82420.206089

\begin{tabular}{lllllllll}
\hline
Partial Autocorrelation Function \tabularnewline
Time lag k & PACF(k) & T-STAT & P-value \tabularnewline
1 & 0.291139 & 2.6524 & 0.004787 \tabularnewline
2 & -0.077992 & -0.7105 & 0.23968 \tabularnewline
3 & 0.131313 & 1.1963 & 0.11749 \tabularnewline
4 & -0.087224 & -0.7946 & 0.214542 \tabularnewline
5 & -0.097526 & -0.8885 & 0.188418 \tabularnewline
6 & 0.006284 & 0.0573 & 0.477241 \tabularnewline
7 & -0.342118 & -3.1168 & 0.001256 \tabularnewline
8 & -0.015981 & -0.1456 & 0.442298 \tabularnewline
9 & -0.119325 & -1.0871 & 0.14007 \tabularnewline
10 & 0.017822 & 0.1624 & 0.435706 \tabularnewline
11 & -0.204264 & -1.8609 & 0.033147 \tabularnewline
12 & -0.101556 & -0.9252 & 0.178766 \tabularnewline
13 & -0.126649 & -1.1538 & 0.125942 \tabularnewline
14 & -0.196417 & -1.7894 & 0.038595 \tabularnewline
15 & 0.034669 & 0.3159 & 0.376455 \tabularnewline
16 & 0.061408 & 0.5595 & 0.288678 \tabularnewline
17 & -0.051365 & -0.468 & 0.320521 \tabularnewline
18 & 0.122867 & 1.1194 & 0.133106 \tabularnewline
19 & 0.045079 & 0.4107 & 0.341179 \tabularnewline
20 & -0.095797 & -0.8728 & 0.192658 \tabularnewline
21 & -0.180855 & -1.6477 & 0.051601 \tabularnewline
22 & 0.005485 & 0.05 & 0.480133 \tabularnewline
23 & -0.157519 & -1.4351 & 0.077513 \tabularnewline
24 & -0.026062 & -0.2374 & 0.406452 \tabularnewline
25 & -0.047601 & -0.4337 & 0.332829 \tabularnewline
26 & 0.04336 & 0.395 & 0.346918 \tabularnewline
27 & 0.14696 & 1.3389 & 0.092134 \tabularnewline
28 & -0.099444 & -0.906 & 0.183785 \tabularnewline
29 & -0.016784 & -0.1529 & 0.439419 \tabularnewline
30 & -0.078146 & -0.7119 & 0.239247 \tabularnewline
31 & -0.09145 & -0.8331 & 0.203576 \tabularnewline
32 & -0.147561 & -1.3443 & 0.09125 \tabularnewline
33 & -0.066811 & -0.6087 & 0.272201 \tabularnewline
34 & 0.037761 & 0.344 & 0.365849 \tabularnewline
35 & 0.042184 & 0.3843 & 0.350865 \tabularnewline
36 & -0.058919 & -0.5368 & 0.296429 \tabularnewline
37 & 0.021824 & 0.1988 & 0.421444 \tabularnewline
38 & -0.062343 & -0.568 & 0.285793 \tabularnewline
39 & 0.127709 & 1.1635 & 0.123984 \tabularnewline
40 & -0.078296 & -0.7133 & 0.238828 \tabularnewline
41 & 0.036649 & 0.3339 & 0.369654 \tabularnewline
42 & -0.068076 & -0.6202 & 0.268413 \tabularnewline
43 & 0.0031 & 0.0282 & 0.48877 \tabularnewline
44 & -0.007264 & -0.0662 & 0.473697 \tabularnewline
45 & 0.035036 & 0.3192 & 0.375191 \tabularnewline
46 & -0.150625 & -1.3723 & 0.08684 \tabularnewline
47 & 0.009277 & 0.0845 & 0.466425 \tabularnewline
48 & 0.09047 & 0.8242 & 0.206089 \tabularnewline
\hline
\end{tabular}
%Source: https://freestatistics.org/blog/index.php?pk=283063&T=2

[TABLE]
[ROW][C]Partial Autocorrelation Function[/C][/ROW]
[ROW][C]Time lag k[/C][C]PACF(k)[/C][C]T-STAT[/C][C]P-value[/C][/ROW]
[ROW][C]1[/C][C]0.291139[/C][C]2.6524[/C][C]0.004787[/C][/ROW]
[ROW][C]2[/C][C]-0.077992[/C][C]-0.7105[/C][C]0.23968[/C][/ROW]
[ROW][C]3[/C][C]0.131313[/C][C]1.1963[/C][C]0.11749[/C][/ROW]
[ROW][C]4[/C][C]-0.087224[/C][C]-0.7946[/C][C]0.214542[/C][/ROW]
[ROW][C]5[/C][C]-0.097526[/C][C]-0.8885[/C][C]0.188418[/C][/ROW]
[ROW][C]6[/C][C]0.006284[/C][C]0.0573[/C][C]0.477241[/C][/ROW]
[ROW][C]7[/C][C]-0.342118[/C][C]-3.1168[/C][C]0.001256[/C][/ROW]
[ROW][C]8[/C][C]-0.015981[/C][C]-0.1456[/C][C]0.442298[/C][/ROW]
[ROW][C]9[/C][C]-0.119325[/C][C]-1.0871[/C][C]0.14007[/C][/ROW]
[ROW][C]10[/C][C]0.017822[/C][C]0.1624[/C][C]0.435706[/C][/ROW]
[ROW][C]11[/C][C]-0.204264[/C][C]-1.8609[/C][C]0.033147[/C][/ROW]
[ROW][C]12[/C][C]-0.101556[/C][C]-0.9252[/C][C]0.178766[/C][/ROW]
[ROW][C]13[/C][C]-0.126649[/C][C]-1.1538[/C][C]0.125942[/C][/ROW]
[ROW][C]14[/C][C]-0.196417[/C][C]-1.7894[/C][C]0.038595[/C][/ROW]
[ROW][C]15[/C][C]0.034669[/C][C]0.3159[/C][C]0.376455[/C][/ROW]
[ROW][C]16[/C][C]0.061408[/C][C]0.5595[/C][C]0.288678[/C][/ROW]
[ROW][C]17[/C][C]-0.051365[/C][C]-0.468[/C][C]0.320521[/C][/ROW]
[ROW][C]18[/C][C]0.122867[/C][C]1.1194[/C][C]0.133106[/C][/ROW]
[ROW][C]19[/C][C]0.045079[/C][C]0.4107[/C][C]0.341179[/C][/ROW]
[ROW][C]20[/C][C]-0.095797[/C][C]-0.8728[/C][C]0.192658[/C][/ROW]
[ROW][C]21[/C][C]-0.180855[/C][C]-1.6477[/C][C]0.051601[/C][/ROW]
[ROW][C]22[/C][C]0.005485[/C][C]0.05[/C][C]0.480133[/C][/ROW]
[ROW][C]23[/C][C]-0.157519[/C][C]-1.4351[/C][C]0.077513[/C][/ROW]
[ROW][C]24[/C][C]-0.026062[/C][C]-0.2374[/C][C]0.406452[/C][/ROW]
[ROW][C]25[/C][C]-0.047601[/C][C]-0.4337[/C][C]0.332829[/C][/ROW]
[ROW][C]26[/C][C]0.04336[/C][C]0.395[/C][C]0.346918[/C][/ROW]
[ROW][C]27[/C][C]0.14696[/C][C]1.3389[/C][C]0.092134[/C][/ROW]
[ROW][C]28[/C][C]-0.099444[/C][C]-0.906[/C][C]0.183785[/C][/ROW]
[ROW][C]29[/C][C]-0.016784[/C][C]-0.1529[/C][C]0.439419[/C][/ROW]
[ROW][C]30[/C][C]-0.078146[/C][C]-0.7119[/C][C]0.239247[/C][/ROW]
[ROW][C]31[/C][C]-0.09145[/C][C]-0.8331[/C][C]0.203576[/C][/ROW]
[ROW][C]32[/C][C]-0.147561[/C][C]-1.3443[/C][C]0.09125[/C][/ROW]
[ROW][C]33[/C][C]-0.066811[/C][C]-0.6087[/C][C]0.272201[/C][/ROW]
[ROW][C]34[/C][C]0.037761[/C][C]0.344[/C][C]0.365849[/C][/ROW]
[ROW][C]35[/C][C]0.042184[/C][C]0.3843[/C][C]0.350865[/C][/ROW]
[ROW][C]36[/C][C]-0.058919[/C][C]-0.5368[/C][C]0.296429[/C][/ROW]
[ROW][C]37[/C][C]0.021824[/C][C]0.1988[/C][C]0.421444[/C][/ROW]
[ROW][C]38[/C][C]-0.062343[/C][C]-0.568[/C][C]0.285793[/C][/ROW]
[ROW][C]39[/C][C]0.127709[/C][C]1.1635[/C][C]0.123984[/C][/ROW]
[ROW][C]40[/C][C]-0.078296[/C][C]-0.7133[/C][C]0.238828[/C][/ROW]
[ROW][C]41[/C][C]0.036649[/C][C]0.3339[/C][C]0.369654[/C][/ROW]
[ROW][C]42[/C][C]-0.068076[/C][C]-0.6202[/C][C]0.268413[/C][/ROW]
[ROW][C]43[/C][C]0.0031[/C][C]0.0282[/C][C]0.48877[/C][/ROW]
[ROW][C]44[/C][C]-0.007264[/C][C]-0.0662[/C][C]0.473697[/C][/ROW]
[ROW][C]45[/C][C]0.035036[/C][C]0.3192[/C][C]0.375191[/C][/ROW]
[ROW][C]46[/C][C]-0.150625[/C][C]-1.3723[/C][C]0.08684[/C][/ROW]
[ROW][C]47[/C][C]0.009277[/C][C]0.0845[/C][C]0.466425[/C][/ROW]
[ROW][C]48[/C][C]0.09047[/C][C]0.8242[/C][C]0.206089[/C][/ROW]
[/TABLE]
Source: https://freestatistics.org/blog/index.php?pk=283063&T=2

Globally Unique Identifier (entire table): ba.freestatistics.org/blog/index.php?pk=283063&T=2

As an alternative you can also use a QR Code:  

The GUIDs for individual cells are displayed in the table below:

Partial Autocorrelation Function
Time lag kPACF(k)T-STATP-value
10.2911392.65240.004787
2-0.077992-0.71050.23968
30.1313131.19630.11749
4-0.087224-0.79460.214542
5-0.097526-0.88850.188418
60.0062840.05730.477241
7-0.342118-3.11680.001256
8-0.015981-0.14560.442298
9-0.119325-1.08710.14007
100.0178220.16240.435706
11-0.204264-1.86090.033147
12-0.101556-0.92520.178766
13-0.126649-1.15380.125942
14-0.196417-1.78940.038595
150.0346690.31590.376455
160.0614080.55950.288678
17-0.051365-0.4680.320521
180.1228671.11940.133106
190.0450790.41070.341179
20-0.095797-0.87280.192658
21-0.180855-1.64770.051601
220.0054850.050.480133
23-0.157519-1.43510.077513
24-0.026062-0.23740.406452
25-0.047601-0.43370.332829
260.043360.3950.346918
270.146961.33890.092134
28-0.099444-0.9060.183785
29-0.016784-0.15290.439419
30-0.078146-0.71190.239247
31-0.09145-0.83310.203576
32-0.147561-1.34430.09125
33-0.066811-0.60870.272201
340.0377610.3440.365849
350.0421840.38430.350865
36-0.058919-0.53680.296429
370.0218240.19880.421444
38-0.062343-0.5680.285793
390.1277091.16350.123984
40-0.078296-0.71330.238828
410.0366490.33390.369654
42-0.068076-0.62020.268413
430.00310.02820.48877
44-0.007264-0.06620.473697
450.0350360.31920.375191
46-0.150625-1.37230.08684
470.0092770.08450.466425
480.090470.82420.206089


Parameters (Session):
par1 = 48 ; par2 = 1 ; par3 = 1 ; par4 = 0 ; par5 = 12 ; par6 = White Noise ; par7 = 0.95 ;
Parameters (R input):
par1 = 48 ; par2 = 1 ; par3 = 1 ; par4 = 0 ; par5 = 12 ; par6 = White Noise ; par7 = 0.95 ; par8 = ;
R code (references can be found in the software module):
if (par1 == 'Default') {
par1 = 10*log10(length(x))
} else {
par1 <- as.numeric(par1)
}
par2 <- as.numeric(par2)
par3 <- as.numeric(par3)
par4 <- as.numeric(par4)
par5 <- as.numeric(par5)
if (par6 == 'White Noise') par6 <- 'white' else par6 <- 'ma'
par7 <- as.numeric(par7)
if (par8 != '') par8 <- as.numeric(par8)
ox <- x
if (par8 == '') {
if (par2 == 0) {
x <- log(x)
} else {
x <- (x ^ par2 - 1) / par2
}
} else {
x <- log(x,base=par8)
}
if (par3 > 0) x <- diff(x,lag=1,difference=par3)
if (par4 > 0) x <- diff(x,lag=par5,difference=par4)
bitmap(file='picts.png')
op <- par(mfrow=c(2,1))
plot(ox,type='l',main='Original Time Series',xlab='time',ylab='value')
if (par8=='') {
mytitle <- paste('Working Time Series (lambda=',par2,', d=',par3,', D=',par4,')',sep='')
mysub <- paste('(lambda=',par2,', d=',par3,', D=',par4,', CI=', par7, ', CI type=',par6,')',sep='')
} else {
mytitle <- paste('Working Time Series (base=',par8,', d=',par3,', D=',par4,')',sep='')
mysub <- paste('(base=',par8,', d=',par3,', D=',par4,', CI=', par7, ', CI type=',par6,')',sep='')
}
plot(x,type='l', main=mytitle,xlab='time',ylab='value')
par(op)
dev.off()
bitmap(file='pic1.png')
racf <- acf(x, par1, main='Autocorrelation', xlab='time lag', ylab='ACF', ci.type=par6, ci=par7, sub=mysub)
dev.off()
bitmap(file='pic2.png')
rpacf <- pacf(x,par1,main='Partial Autocorrelation',xlab='lags',ylab='PACF',sub=mysub)
dev.off()
(myacf <- c(racf$acf))
(mypacf <- c(rpacf$acf))
lengthx <- length(x)
sqrtn <- sqrt(lengthx)
load(file='createtable')
a<-table.start()
a<-table.row.start(a)
a<-table.element(a,'Autocorrelation Function',4,TRUE)
a<-table.row.end(a)
a<-table.row.start(a)
a<-table.element(a,'Time lag k',header=TRUE)
a<-table.element(a,hyperlink('basics.htm','ACF(k)','click here for more information about the Autocorrelation Function'),header=TRUE)
a<-table.element(a,'T-STAT',header=TRUE)
a<-table.element(a,'P-value',header=TRUE)
a<-table.row.end(a)
for (i in 2:(par1+1)) {
a<-table.row.start(a)
a<-table.element(a,i-1,header=TRUE)
a<-table.element(a,round(myacf[i],6))
mytstat <- myacf[i]*sqrtn
a<-table.element(a,round(mytstat,4))
a<-table.element(a,round(1-pt(abs(mytstat),lengthx),6))
a<-table.row.end(a)
}
a<-table.end(a)
table.save(a,file='mytable.tab')
a<-table.start()
a<-table.row.start(a)
a<-table.element(a,'Partial Autocorrelation Function',4,TRUE)
a<-table.row.end(a)
a<-table.row.start(a)
a<-table.element(a,'Time lag k',header=TRUE)
a<-table.element(a,hyperlink('basics.htm','PACF(k)','click here for more information about the Partial Autocorrelation Function'),header=TRUE)
a<-table.element(a,'T-STAT',header=TRUE)
a<-table.element(a,'P-value',header=TRUE)
a<-table.row.end(a)
for (i in 1:par1) {
a<-table.row.start(a)
a<-table.element(a,i,header=TRUE)
a<-table.element(a,round(mypacf[i],6))
mytstat <- mypacf[i]*sqrtn
a<-table.element(a,round(mytstat,4))
a<-table.element(a,round(1-pt(abs(mytstat),lengthx),6))
a<-table.row.end(a)
}
a<-table.end(a)
table.save(a,file='mytable1.tab')