Free Statistics
of Irreproducible Research!
Description of Statistical Computation | ||||||||||||||||||||||||||||||||||||||||||||||||||||||
|---|---|---|---|---|---|---|---|---|---|---|---|---|---|---|---|---|---|---|---|---|---|---|---|---|---|---|---|---|---|---|---|---|---|---|---|---|---|---|---|---|---|---|---|---|---|---|---|---|---|---|---|---|---|---|
| Author's title | ||||||||||||||||||||||||||||||||||||||||||||||||||||||
| Author | *Unverified author* | |||||||||||||||||||||||||||||||||||||||||||||||||||||
| R Software Module | rwasp_univariatedataseries.wasp | |||||||||||||||||||||||||||||||||||||||||||||||||||||
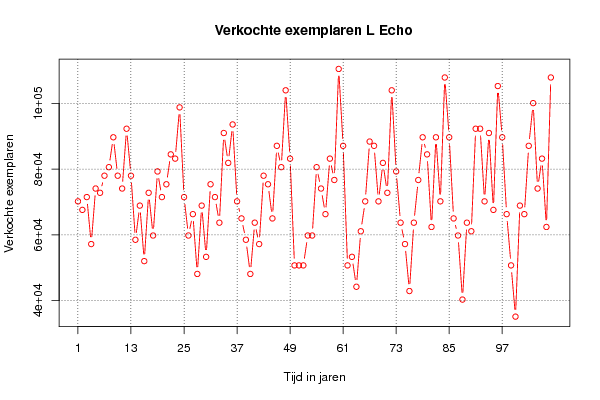
| Title produced by software | Univariate Data Series | |||||||||||||||||||||||||||||||||||||||||||||||||||||
| Date of computation | Fri, 04 Aug 2017 09:31:58 +0200 | |||||||||||||||||||||||||||||||||||||||||||||||||||||
| Cite this page as follows | Statistical Computations at FreeStatistics.org, Office for Research Development and Education, URL https://freestatistics.org/blog/index.php?v=date/2017/Aug/04/t1501832030iqat1e4bfhveka9.htm/, Retrieved Sun, 12 May 2024 11:35:50 +0200 | |||||||||||||||||||||||||||||||||||||||||||||||||||||
| Statistical Computations at FreeStatistics.org, Office for Research Development and Education, URL https://freestatistics.org/blog/index.php?pk=, Retrieved Sun, 12 May 2024 11:35:50 +0200 | ||||||||||||||||||||||||||||||||||||||||||||||||||||||
| QR Codes: | ||||||||||||||||||||||||||||||||||||||||||||||||||||||
|
| ||||||||||||||||||||||||||||||||||||||||||||||||||||||
| Original text written by user: | ||||||||||||||||||||||||||||||||||||||||||||||||||||||
| IsPrivate? | No (this computation is public) | |||||||||||||||||||||||||||||||||||||||||||||||||||||
| User-defined keywords | ||||||||||||||||||||||||||||||||||||||||||||||||||||||
| Estimated Impact | 0 | |||||||||||||||||||||||||||||||||||||||||||||||||||||
Tree of Dependent Computations | ||||||||||||||||||||||||||||||||||||||||||||||||||||||
Dataset | ||||||||||||||||||||||||||||||||||||||||||||||||||||||
| Dataseries X: | ||||||||||||||||||||||||||||||||||||||||||||||||||||||
70200 67600 71500 57200 74100 72800 78000 80600 89700 78000 74100 92300 78000 58500 68900 52000 72800 59800 79300 71500 75400 84500 83200 98800 71500 59800 66300 48100 68900 53300 75400 71500 63700 91000 81900 93600 70200 65000 58500 48100 63700 57200 78000 75400 65000 87100 80600 104000 83200 50700 50700 50700 59800 59800 80600 74100 66300 83200 76700 110500 87100 50700 53300 44200 61100 70200 88400 87100 70200 81900 72800 104000 79300 63700 57200 42900 63700 76700 89700 84500 62400 89700 70200 107900 89700 65000 59800 40300 63700 61100 92300 92300 70200 91000 67600 105300 89700 66300 50700 35100 68900 66300 87100 100100 74100 83200 62400 107900 | ||||||||||||||||||||||||||||||||||||||||||||||||||||||
Tables (Output of Computation) | ||||||||||||||||||||||||||||||||||||||||||||||||||||||
| ||||||||||||||||||||||||||||||||||||||||||||||||||||||
Figures (Output of Computation) | ||||||||||||||||||||||||||||||||||||||||||||||||||||||
Input Parameters & R Code | ||||||||||||||||||||||||||||||||||||||||||||||||||||||
| Parameters (Session): | ||||||||||||||||||||||||||||||||||||||||||||||||||||||
| par1 = 48481212multiplicative121212Verkochte exemplaren L'EchoVerkochte exemplaren L'EchoVerkochte exemplaren L'EchoVerkochte exemplaren L'EchoVerkochte exemplaren L'Echo48Verkochte exemplaren L'Echo00Verkochte exemplaren L Echo ; par2 = 1112DoubleDoubleDoubleniet gekendniet gekendniet gekendniet gekendniet gekend1Niet gekendgreynononiet gekend ; par3 = 00multiplicativemultiplicativemultiplicativeDeze reeks geeft de verkochte aantal exemplaren van L'Echo van 2006 tot 2014Deze reeks geeft de verkochte aantal exemplaren van L'Echo van 2006 tot 2014Deze reeks geeft de verkochte aantal exemplaren van L'Echo van 2006 tot 2014Deze reeks geeft de verkochte aantal exemplaren van L'Echo van 2006 tot 2014Deze reeks geeft de verkochte aantal exemplaren van L'Echo van 2006 tot 201400FALSE512512Verkochte exemplaren L Echo per jaar ; par4 = 001212121212No season121200Unknown12 ; par5 = 1212 ; par6 = White NoiseWhite Noise ; par7 = 0.950.95 ; | ||||||||||||||||||||||||||||||||||||||||||||||||||||||
| Parameters (R input): | ||||||||||||||||||||||||||||||||||||||||||||||||||||||
| par1 = Verkochte exemplaren L Echo ; par2 = niet gekend ; par3 = Verkochte exemplaren L Echo per jaar ; par4 = 12 ; | ||||||||||||||||||||||||||||||||||||||||||||||||||||||
| R code (references can be found in the software module): | ||||||||||||||||||||||||||||||||||||||||||||||||||||||
if (par4 != 'No season') { | ||||||||||||||||||||||||||||||||||||||||||||||||||||||