Free Statistics

of Irreproducible Research!

Author's title

Author*Unverified author*
R Software Modulerwasp_autocorrelation.wasp
Title produced by software(Partial) Autocorrelation Function
Date of computationFri, 04 Aug 2017 14:18:01 +0200
Cite this page as followsStatistical Computations at FreeStatistics.org, Office for Research Development and Education, URL https://freestatistics.org/blog/index.php?v=date/2017/Aug/04/t1501849180b4mwgfq6cvb3az1.htm/, Retrieved Sun, 12 May 2024 06:43:16 +0000
Statistical Computations at FreeStatistics.org, Office for Research Development and Education, URL https://freestatistics.org/blog/index.php?pk=306902, Retrieved Sun, 12 May 2024 06:43:16 +0000
QR Codes:

Original text written by user:
IsPrivate?No (this computation is public)
User-defined keywords
Estimated Impact111
Family? (F = Feedback message, R = changed R code, M = changed R Module, P = changed Parameters, D = changed Data)
-       [(Partial) Autocorrelation Function] [ACF van de gediff...] [2017-08-04 12:18:01] [7f8e680169e3605c7c9c65666ad372ce] [Current]
Feedback Forum

Post a new message
Dataseries X:
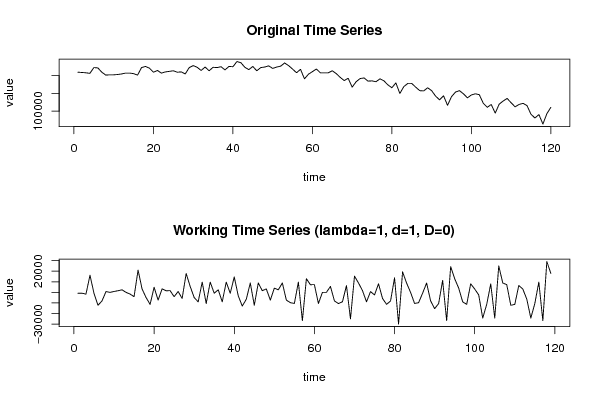
209704
208923
208131
206492
222706
221848
209704
201630
202411
202411
203280
204842
207273
207273
205711
201630
222706
225918
221067
209704
214566
207273
210562
212135
213774
209704
210562
204842
222706
228349
223498
214566
224279
213774
223498
222706
225137
216205
225918
225137
239712
236423
223498
216986
225918
213774
222706
224279
227568
220286
224279
226710
235642
228349
218636
208131
217855
191125
204061
211343
218636
208131
208131
208131
213774
205711
195129
186274
192698
167618
182985
191917
193556
184624
185405
182985
191125
185405
174130
165979
179762
149831
169268
178123
178123
167618
157905
157124
165979
157905
142549
131967
143330
116611
140899
153824
157905
148973
137687
145761
148973
146542
122243
110968
119031
94743
119823
128755
136037
123893
112530
119031
122243
115819
91531
80949
90662
63943
93093
110968


Summary of computational transaction
Raw Input view raw input (R code)
Raw Outputview raw output of R engine
Computing time1 seconds
R ServerBig Analytics Cloud Computing Center

\begin{tabular}{lllllllll}
\hline
Summary of computational transaction \tabularnewline
Raw Input view raw input (R code)  \tabularnewline
Raw Outputview raw output of R engine  \tabularnewline
Computing time1 seconds \tabularnewline
R ServerBig Analytics Cloud Computing Center \tabularnewline
\hline
\end{tabular}
%Source: https://freestatistics.org/blog/index.php?pk=306902&T=0

[TABLE]
[ROW]
Summary of computational transaction[/C][/ROW] [ROW]Raw Input[/C] view raw input (R code) [/C][/ROW] [ROW]Raw Output[/C]view raw output of R engine [/C][/ROW] [ROW]Computing time[/C]1 seconds[/C][/ROW] [ROW]R Server[/C]Big Analytics Cloud Computing Center[/C][/ROW] [/TABLE] Source: https://freestatistics.org/blog/index.php?pk=306902&T=0

Globally Unique Identifier (entire table): ba.freestatistics.org/blog/index.php?pk=306902&T=0

As an alternative you can also use a QR Code:  

The GUIDs for individual cells are displayed in the table below:

Summary of computational transaction
Raw Input view raw input (R code)
Raw Outputview raw output of R engine
Computing time1 seconds
R ServerBig Analytics Cloud Computing Center


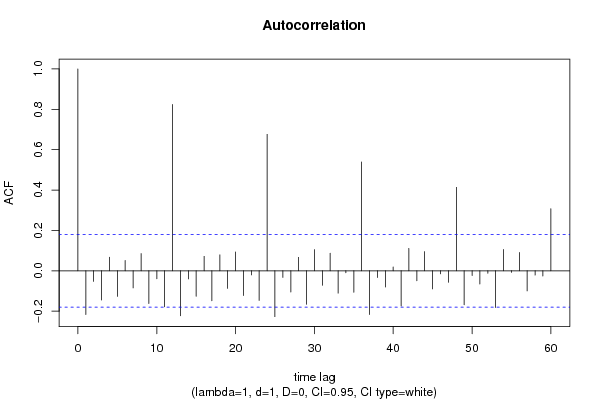
Autocorrelation Function
Time lag kACF(k)T-STATP-value
1-0.216906-2.36620.009794
2-0.052827-0.57630.282758
3-0.144728-1.57880.058519
40.0670330.73120.233035
5-0.127179-1.38740.083963
60.050570.55160.291112
7-0.084742-0.92440.178566
80.0849790.9270.177899
9-0.162055-1.76780.039828
10-0.0398-0.43420.332476
11-0.178014-1.94190.027256
120.8242888.99190
13-0.222699-2.42940.00831
14-0.040343-0.44010.330336
15-0.126437-1.37930.085199
160.0712580.77730.219252
17-0.148908-1.62440.053469
180.0786670.85820.196265
19-0.087466-0.95410.170974
200.0933111.01790.155396
21-0.122622-1.33760.091781
22-0.020635-0.22510.411143
23-0.146841-1.60180.055921
240.6759217.37340
25-0.227425-2.48090.007251
26-0.032956-0.35950.359925
27-0.105104-1.14660.126934
280.0665240.72570.234725
29-0.166075-1.81170.03628
300.104621.14130.128024
31-0.071965-0.7850.216994
320.0869940.9490.172274
33-0.110953-1.21040.114271
34-0.009771-0.10660.457646
35-0.106316-1.15980.124233
360.5385935.87540
37-0.216558-2.36240.009891
38-0.033417-0.36450.358053
39-0.080526-0.87840.19074
400.0186280.20320.419661
41-0.174393-1.90240.029768
420.1107921.20860.114607
43-0.049793-0.54320.294011
440.0949651.03590.151164
45-0.089998-0.98180.164104
46-0.015308-0.1670.433829
47-0.057284-0.62490.266618
480.4131574.5078e-06
49-0.168476-1.83790.034289
50-0.023545-0.25680.398869
51-0.066091-0.7210.236172
52-0.012551-0.13690.445663
53-0.182507-1.99090.024391
540.1050121.14550.12714
55-0.008057-0.08790.465057
560.0901930.98390.163582
57-0.099889-1.08970.139033
58-0.021537-0.23490.407331
59-0.026266-0.28650.387486
600.3072353.35150.000539

\begin{tabular}{lllllllll}
\hline
Autocorrelation Function \tabularnewline
Time lag k & ACF(k) & T-STAT & P-value \tabularnewline
1 & -0.216906 & -2.3662 & 0.009794 \tabularnewline
2 & -0.052827 & -0.5763 & 0.282758 \tabularnewline
3 & -0.144728 & -1.5788 & 0.058519 \tabularnewline
4 & 0.067033 & 0.7312 & 0.233035 \tabularnewline
5 & -0.127179 & -1.3874 & 0.083963 \tabularnewline
6 & 0.05057 & 0.5516 & 0.291112 \tabularnewline
7 & -0.084742 & -0.9244 & 0.178566 \tabularnewline
8 & 0.084979 & 0.927 & 0.177899 \tabularnewline
9 & -0.162055 & -1.7678 & 0.039828 \tabularnewline
10 & -0.0398 & -0.4342 & 0.332476 \tabularnewline
11 & -0.178014 & -1.9419 & 0.027256 \tabularnewline
12 & 0.824288 & 8.9919 & 0 \tabularnewline
13 & -0.222699 & -2.4294 & 0.00831 \tabularnewline
14 & -0.040343 & -0.4401 & 0.330336 \tabularnewline
15 & -0.126437 & -1.3793 & 0.085199 \tabularnewline
16 & 0.071258 & 0.7773 & 0.219252 \tabularnewline
17 & -0.148908 & -1.6244 & 0.053469 \tabularnewline
18 & 0.078667 & 0.8582 & 0.196265 \tabularnewline
19 & -0.087466 & -0.9541 & 0.170974 \tabularnewline
20 & 0.093311 & 1.0179 & 0.155396 \tabularnewline
21 & -0.122622 & -1.3376 & 0.091781 \tabularnewline
22 & -0.020635 & -0.2251 & 0.411143 \tabularnewline
23 & -0.146841 & -1.6018 & 0.055921 \tabularnewline
24 & 0.675921 & 7.3734 & 0 \tabularnewline
25 & -0.227425 & -2.4809 & 0.007251 \tabularnewline
26 & -0.032956 & -0.3595 & 0.359925 \tabularnewline
27 & -0.105104 & -1.1466 & 0.126934 \tabularnewline
28 & 0.066524 & 0.7257 & 0.234725 \tabularnewline
29 & -0.166075 & -1.8117 & 0.03628 \tabularnewline
30 & 0.10462 & 1.1413 & 0.128024 \tabularnewline
31 & -0.071965 & -0.785 & 0.216994 \tabularnewline
32 & 0.086994 & 0.949 & 0.172274 \tabularnewline
33 & -0.110953 & -1.2104 & 0.114271 \tabularnewline
34 & -0.009771 & -0.1066 & 0.457646 \tabularnewline
35 & -0.106316 & -1.1598 & 0.124233 \tabularnewline
36 & 0.538593 & 5.8754 & 0 \tabularnewline
37 & -0.216558 & -2.3624 & 0.009891 \tabularnewline
38 & -0.033417 & -0.3645 & 0.358053 \tabularnewline
39 & -0.080526 & -0.8784 & 0.19074 \tabularnewline
40 & 0.018628 & 0.2032 & 0.419661 \tabularnewline
41 & -0.174393 & -1.9024 & 0.029768 \tabularnewline
42 & 0.110792 & 1.2086 & 0.114607 \tabularnewline
43 & -0.049793 & -0.5432 & 0.294011 \tabularnewline
44 & 0.094965 & 1.0359 & 0.151164 \tabularnewline
45 & -0.089998 & -0.9818 & 0.164104 \tabularnewline
46 & -0.015308 & -0.167 & 0.433829 \tabularnewline
47 & -0.057284 & -0.6249 & 0.266618 \tabularnewline
48 & 0.413157 & 4.507 & 8e-06 \tabularnewline
49 & -0.168476 & -1.8379 & 0.034289 \tabularnewline
50 & -0.023545 & -0.2568 & 0.398869 \tabularnewline
51 & -0.066091 & -0.721 & 0.236172 \tabularnewline
52 & -0.012551 & -0.1369 & 0.445663 \tabularnewline
53 & -0.182507 & -1.9909 & 0.024391 \tabularnewline
54 & 0.105012 & 1.1455 & 0.12714 \tabularnewline
55 & -0.008057 & -0.0879 & 0.465057 \tabularnewline
56 & 0.090193 & 0.9839 & 0.163582 \tabularnewline
57 & -0.099889 & -1.0897 & 0.139033 \tabularnewline
58 & -0.021537 & -0.2349 & 0.407331 \tabularnewline
59 & -0.026266 & -0.2865 & 0.387486 \tabularnewline
60 & 0.307235 & 3.3515 & 0.000539 \tabularnewline
\hline
\end{tabular}
%Source: https://freestatistics.org/blog/index.php?pk=306902&T=1

[TABLE]
[ROW][C]Autocorrelation Function[/C][/ROW]
[ROW][C]Time lag k[/C][C]ACF(k)[/C][C]T-STAT[/C][C]P-value[/C][/ROW]
[ROW][C]1[/C][C]-0.216906[/C][C]-2.3662[/C][C]0.009794[/C][/ROW]
[ROW][C]2[/C][C]-0.052827[/C][C]-0.5763[/C][C]0.282758[/C][/ROW]
[ROW][C]3[/C][C]-0.144728[/C][C]-1.5788[/C][C]0.058519[/C][/ROW]
[ROW][C]4[/C][C]0.067033[/C][C]0.7312[/C][C]0.233035[/C][/ROW]
[ROW][C]5[/C][C]-0.127179[/C][C]-1.3874[/C][C]0.083963[/C][/ROW]
[ROW][C]6[/C][C]0.05057[/C][C]0.5516[/C][C]0.291112[/C][/ROW]
[ROW][C]7[/C][C]-0.084742[/C][C]-0.9244[/C][C]0.178566[/C][/ROW]
[ROW][C]8[/C][C]0.084979[/C][C]0.927[/C][C]0.177899[/C][/ROW]
[ROW][C]9[/C][C]-0.162055[/C][C]-1.7678[/C][C]0.039828[/C][/ROW]
[ROW][C]10[/C][C]-0.0398[/C][C]-0.4342[/C][C]0.332476[/C][/ROW]
[ROW][C]11[/C][C]-0.178014[/C][C]-1.9419[/C][C]0.027256[/C][/ROW]
[ROW][C]12[/C][C]0.824288[/C][C]8.9919[/C][C]0[/C][/ROW]
[ROW][C]13[/C][C]-0.222699[/C][C]-2.4294[/C][C]0.00831[/C][/ROW]
[ROW][C]14[/C][C]-0.040343[/C][C]-0.4401[/C][C]0.330336[/C][/ROW]
[ROW][C]15[/C][C]-0.126437[/C][C]-1.3793[/C][C]0.085199[/C][/ROW]
[ROW][C]16[/C][C]0.071258[/C][C]0.7773[/C][C]0.219252[/C][/ROW]
[ROW][C]17[/C][C]-0.148908[/C][C]-1.6244[/C][C]0.053469[/C][/ROW]
[ROW][C]18[/C][C]0.078667[/C][C]0.8582[/C][C]0.196265[/C][/ROW]
[ROW][C]19[/C][C]-0.087466[/C][C]-0.9541[/C][C]0.170974[/C][/ROW]
[ROW][C]20[/C][C]0.093311[/C][C]1.0179[/C][C]0.155396[/C][/ROW]
[ROW][C]21[/C][C]-0.122622[/C][C]-1.3376[/C][C]0.091781[/C][/ROW]
[ROW][C]22[/C][C]-0.020635[/C][C]-0.2251[/C][C]0.411143[/C][/ROW]
[ROW][C]23[/C][C]-0.146841[/C][C]-1.6018[/C][C]0.055921[/C][/ROW]
[ROW][C]24[/C][C]0.675921[/C][C]7.3734[/C][C]0[/C][/ROW]
[ROW][C]25[/C][C]-0.227425[/C][C]-2.4809[/C][C]0.007251[/C][/ROW]
[ROW][C]26[/C][C]-0.032956[/C][C]-0.3595[/C][C]0.359925[/C][/ROW]
[ROW][C]27[/C][C]-0.105104[/C][C]-1.1466[/C][C]0.126934[/C][/ROW]
[ROW][C]28[/C][C]0.066524[/C][C]0.7257[/C][C]0.234725[/C][/ROW]
[ROW][C]29[/C][C]-0.166075[/C][C]-1.8117[/C][C]0.03628[/C][/ROW]
[ROW][C]30[/C][C]0.10462[/C][C]1.1413[/C][C]0.128024[/C][/ROW]
[ROW][C]31[/C][C]-0.071965[/C][C]-0.785[/C][C]0.216994[/C][/ROW]
[ROW][C]32[/C][C]0.086994[/C][C]0.949[/C][C]0.172274[/C][/ROW]
[ROW][C]33[/C][C]-0.110953[/C][C]-1.2104[/C][C]0.114271[/C][/ROW]
[ROW][C]34[/C][C]-0.009771[/C][C]-0.1066[/C][C]0.457646[/C][/ROW]
[ROW][C]35[/C][C]-0.106316[/C][C]-1.1598[/C][C]0.124233[/C][/ROW]
[ROW][C]36[/C][C]0.538593[/C][C]5.8754[/C][C]0[/C][/ROW]
[ROW][C]37[/C][C]-0.216558[/C][C]-2.3624[/C][C]0.009891[/C][/ROW]
[ROW][C]38[/C][C]-0.033417[/C][C]-0.3645[/C][C]0.358053[/C][/ROW]
[ROW][C]39[/C][C]-0.080526[/C][C]-0.8784[/C][C]0.19074[/C][/ROW]
[ROW][C]40[/C][C]0.018628[/C][C]0.2032[/C][C]0.419661[/C][/ROW]
[ROW][C]41[/C][C]-0.174393[/C][C]-1.9024[/C][C]0.029768[/C][/ROW]
[ROW][C]42[/C][C]0.110792[/C][C]1.2086[/C][C]0.114607[/C][/ROW]
[ROW][C]43[/C][C]-0.049793[/C][C]-0.5432[/C][C]0.294011[/C][/ROW]
[ROW][C]44[/C][C]0.094965[/C][C]1.0359[/C][C]0.151164[/C][/ROW]
[ROW][C]45[/C][C]-0.089998[/C][C]-0.9818[/C][C]0.164104[/C][/ROW]
[ROW][C]46[/C][C]-0.015308[/C][C]-0.167[/C][C]0.433829[/C][/ROW]
[ROW][C]47[/C][C]-0.057284[/C][C]-0.6249[/C][C]0.266618[/C][/ROW]
[ROW][C]48[/C][C]0.413157[/C][C]4.507[/C][C]8e-06[/C][/ROW]
[ROW][C]49[/C][C]-0.168476[/C][C]-1.8379[/C][C]0.034289[/C][/ROW]
[ROW][C]50[/C][C]-0.023545[/C][C]-0.2568[/C][C]0.398869[/C][/ROW]
[ROW][C]51[/C][C]-0.066091[/C][C]-0.721[/C][C]0.236172[/C][/ROW]
[ROW][C]52[/C][C]-0.012551[/C][C]-0.1369[/C][C]0.445663[/C][/ROW]
[ROW][C]53[/C][C]-0.182507[/C][C]-1.9909[/C][C]0.024391[/C][/ROW]
[ROW][C]54[/C][C]0.105012[/C][C]1.1455[/C][C]0.12714[/C][/ROW]
[ROW][C]55[/C][C]-0.008057[/C][C]-0.0879[/C][C]0.465057[/C][/ROW]
[ROW][C]56[/C][C]0.090193[/C][C]0.9839[/C][C]0.163582[/C][/ROW]
[ROW][C]57[/C][C]-0.099889[/C][C]-1.0897[/C][C]0.139033[/C][/ROW]
[ROW][C]58[/C][C]-0.021537[/C][C]-0.2349[/C][C]0.407331[/C][/ROW]
[ROW][C]59[/C][C]-0.026266[/C][C]-0.2865[/C][C]0.387486[/C][/ROW]
[ROW][C]60[/C][C]0.307235[/C][C]3.3515[/C][C]0.000539[/C][/ROW]
[/TABLE]
Source: https://freestatistics.org/blog/index.php?pk=306902&T=1

Globally Unique Identifier (entire table): ba.freestatistics.org/blog/index.php?pk=306902&T=1

As an alternative you can also use a QR Code:  

The GUIDs for individual cells are displayed in the table below:

Autocorrelation Function
Time lag kACF(k)T-STATP-value
1-0.216906-2.36620.009794
2-0.052827-0.57630.282758
3-0.144728-1.57880.058519
40.0670330.73120.233035
5-0.127179-1.38740.083963
60.050570.55160.291112
7-0.084742-0.92440.178566
80.0849790.9270.177899
9-0.162055-1.76780.039828
10-0.0398-0.43420.332476
11-0.178014-1.94190.027256
120.8242888.99190
13-0.222699-2.42940.00831
14-0.040343-0.44010.330336
15-0.126437-1.37930.085199
160.0712580.77730.219252
17-0.148908-1.62440.053469
180.0786670.85820.196265
19-0.087466-0.95410.170974
200.0933111.01790.155396
21-0.122622-1.33760.091781
22-0.020635-0.22510.411143
23-0.146841-1.60180.055921
240.6759217.37340
25-0.227425-2.48090.007251
26-0.032956-0.35950.359925
27-0.105104-1.14660.126934
280.0665240.72570.234725
29-0.166075-1.81170.03628
300.104621.14130.128024
31-0.071965-0.7850.216994
320.0869940.9490.172274
33-0.110953-1.21040.114271
34-0.009771-0.10660.457646
35-0.106316-1.15980.124233
360.5385935.87540
37-0.216558-2.36240.009891
38-0.033417-0.36450.358053
39-0.080526-0.87840.19074
400.0186280.20320.419661
41-0.174393-1.90240.029768
420.1107921.20860.114607
43-0.049793-0.54320.294011
440.0949651.03590.151164
45-0.089998-0.98180.164104
46-0.015308-0.1670.433829
47-0.057284-0.62490.266618
480.4131574.5078e-06
49-0.168476-1.83790.034289
50-0.023545-0.25680.398869
51-0.066091-0.7210.236172
52-0.012551-0.13690.445663
53-0.182507-1.99090.024391
540.1050121.14550.12714
55-0.008057-0.08790.465057
560.0901930.98390.163582
57-0.099889-1.08970.139033
58-0.021537-0.23490.407331
59-0.026266-0.28650.387486
600.3072353.35150.000539


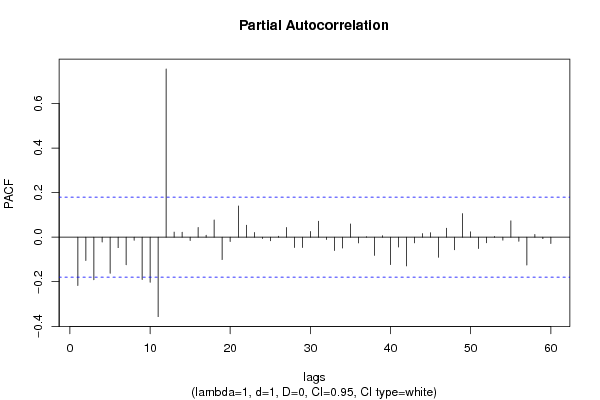
Partial Autocorrelation Function
Time lag kPACF(k)T-STATP-value
1-0.216906-2.36620.009794
2-0.104807-1.14330.127603
3-0.191113-2.08480.019613
4-0.021979-0.23980.405463
5-0.161887-1.7660.039982
6-0.047081-0.51360.304244
7-0.123989-1.35260.089381
8-0.013633-0.14870.441014
9-0.190288-2.07580.020033
10-0.202374-2.20760.014593
11-0.356777-3.8928.2e-05
120.7549058.2350
130.0226310.24690.402713
140.0220060.24010.40535
15-0.014819-0.16170.435924
160.0432670.4720.318899
170.0084680.09240.463279
180.077160.84170.200818
19-0.100726-1.09880.137039
20-0.019258-0.21010.416982
210.1401631.5290.064459
220.0534310.58290.280543
230.0211850.23110.408818
24-0.006015-0.06560.473895
25-0.016166-0.17630.430161
260.0039220.04280.482974
270.04370.47670.317222
28-0.046821-0.51080.305233
29-0.04663-0.50870.305962
300.025740.28080.38968
310.0711470.77610.21961
32-0.010283-0.11220.455439
33-0.060151-0.65620.256492
34-0.048444-0.52850.299081
350.0587220.64060.261514
36-0.025592-0.27920.390299
370.001550.01690.493268
38-0.081776-0.89210.187078
390.0062030.06770.473082
40-0.12315-1.34340.090847
41-0.043859-0.47840.316605
42-0.129025-1.40750.080943
43-0.025571-0.27890.390385
440.0159360.17380.431143
450.0196510.21440.415315
46-0.090472-0.98690.162839
470.0402730.43930.330609
48-0.056761-0.61920.268489
490.1058181.15430.125338
500.0238970.26070.397394
51-0.051184-0.55840.288825
52-0.02502-0.27290.392688
530.003150.03440.486321
54-0.013409-0.14630.441976
550.0731230.79770.213325
56-0.018367-0.20040.420771
57-0.125242-1.36620.087222
580.0122670.13380.446886
59-0.006693-0.0730.47096
60-0.028317-0.30890.378969

\begin{tabular}{lllllllll}
\hline
Partial Autocorrelation Function \tabularnewline
Time lag k & PACF(k) & T-STAT & P-value \tabularnewline
1 & -0.216906 & -2.3662 & 0.009794 \tabularnewline
2 & -0.104807 & -1.1433 & 0.127603 \tabularnewline
3 & -0.191113 & -2.0848 & 0.019613 \tabularnewline
4 & -0.021979 & -0.2398 & 0.405463 \tabularnewline
5 & -0.161887 & -1.766 & 0.039982 \tabularnewline
6 & -0.047081 & -0.5136 & 0.304244 \tabularnewline
7 & -0.123989 & -1.3526 & 0.089381 \tabularnewline
8 & -0.013633 & -0.1487 & 0.441014 \tabularnewline
9 & -0.190288 & -2.0758 & 0.020033 \tabularnewline
10 & -0.202374 & -2.2076 & 0.014593 \tabularnewline
11 & -0.356777 & -3.892 & 8.2e-05 \tabularnewline
12 & 0.754905 & 8.235 & 0 \tabularnewline
13 & 0.022631 & 0.2469 & 0.402713 \tabularnewline
14 & 0.022006 & 0.2401 & 0.40535 \tabularnewline
15 & -0.014819 & -0.1617 & 0.435924 \tabularnewline
16 & 0.043267 & 0.472 & 0.318899 \tabularnewline
17 & 0.008468 & 0.0924 & 0.463279 \tabularnewline
18 & 0.07716 & 0.8417 & 0.200818 \tabularnewline
19 & -0.100726 & -1.0988 & 0.137039 \tabularnewline
20 & -0.019258 & -0.2101 & 0.416982 \tabularnewline
21 & 0.140163 & 1.529 & 0.064459 \tabularnewline
22 & 0.053431 & 0.5829 & 0.280543 \tabularnewline
23 & 0.021185 & 0.2311 & 0.408818 \tabularnewline
24 & -0.006015 & -0.0656 & 0.473895 \tabularnewline
25 & -0.016166 & -0.1763 & 0.430161 \tabularnewline
26 & 0.003922 & 0.0428 & 0.482974 \tabularnewline
27 & 0.0437 & 0.4767 & 0.317222 \tabularnewline
28 & -0.046821 & -0.5108 & 0.305233 \tabularnewline
29 & -0.04663 & -0.5087 & 0.305962 \tabularnewline
30 & 0.02574 & 0.2808 & 0.38968 \tabularnewline
31 & 0.071147 & 0.7761 & 0.21961 \tabularnewline
32 & -0.010283 & -0.1122 & 0.455439 \tabularnewline
33 & -0.060151 & -0.6562 & 0.256492 \tabularnewline
34 & -0.048444 & -0.5285 & 0.299081 \tabularnewline
35 & 0.058722 & 0.6406 & 0.261514 \tabularnewline
36 & -0.025592 & -0.2792 & 0.390299 \tabularnewline
37 & 0.00155 & 0.0169 & 0.493268 \tabularnewline
38 & -0.081776 & -0.8921 & 0.187078 \tabularnewline
39 & 0.006203 & 0.0677 & 0.473082 \tabularnewline
40 & -0.12315 & -1.3434 & 0.090847 \tabularnewline
41 & -0.043859 & -0.4784 & 0.316605 \tabularnewline
42 & -0.129025 & -1.4075 & 0.080943 \tabularnewline
43 & -0.025571 & -0.2789 & 0.390385 \tabularnewline
44 & 0.015936 & 0.1738 & 0.431143 \tabularnewline
45 & 0.019651 & 0.2144 & 0.415315 \tabularnewline
46 & -0.090472 & -0.9869 & 0.162839 \tabularnewline
47 & 0.040273 & 0.4393 & 0.330609 \tabularnewline
48 & -0.056761 & -0.6192 & 0.268489 \tabularnewline
49 & 0.105818 & 1.1543 & 0.125338 \tabularnewline
50 & 0.023897 & 0.2607 & 0.397394 \tabularnewline
51 & -0.051184 & -0.5584 & 0.288825 \tabularnewline
52 & -0.02502 & -0.2729 & 0.392688 \tabularnewline
53 & 0.00315 & 0.0344 & 0.486321 \tabularnewline
54 & -0.013409 & -0.1463 & 0.441976 \tabularnewline
55 & 0.073123 & 0.7977 & 0.213325 \tabularnewline
56 & -0.018367 & -0.2004 & 0.420771 \tabularnewline
57 & -0.125242 & -1.3662 & 0.087222 \tabularnewline
58 & 0.012267 & 0.1338 & 0.446886 \tabularnewline
59 & -0.006693 & -0.073 & 0.47096 \tabularnewline
60 & -0.028317 & -0.3089 & 0.378969 \tabularnewline
\hline
\end{tabular}
%Source: https://freestatistics.org/blog/index.php?pk=306902&T=2

[TABLE]
[ROW][C]Partial Autocorrelation Function[/C][/ROW]
[ROW][C]Time lag k[/C][C]PACF(k)[/C][C]T-STAT[/C][C]P-value[/C][/ROW]
[ROW][C]1[/C][C]-0.216906[/C][C]-2.3662[/C][C]0.009794[/C][/ROW]
[ROW][C]2[/C][C]-0.104807[/C][C]-1.1433[/C][C]0.127603[/C][/ROW]
[ROW][C]3[/C][C]-0.191113[/C][C]-2.0848[/C][C]0.019613[/C][/ROW]
[ROW][C]4[/C][C]-0.021979[/C][C]-0.2398[/C][C]0.405463[/C][/ROW]
[ROW][C]5[/C][C]-0.161887[/C][C]-1.766[/C][C]0.039982[/C][/ROW]
[ROW][C]6[/C][C]-0.047081[/C][C]-0.5136[/C][C]0.304244[/C][/ROW]
[ROW][C]7[/C][C]-0.123989[/C][C]-1.3526[/C][C]0.089381[/C][/ROW]
[ROW][C]8[/C][C]-0.013633[/C][C]-0.1487[/C][C]0.441014[/C][/ROW]
[ROW][C]9[/C][C]-0.190288[/C][C]-2.0758[/C][C]0.020033[/C][/ROW]
[ROW][C]10[/C][C]-0.202374[/C][C]-2.2076[/C][C]0.014593[/C][/ROW]
[ROW][C]11[/C][C]-0.356777[/C][C]-3.892[/C][C]8.2e-05[/C][/ROW]
[ROW][C]12[/C][C]0.754905[/C][C]8.235[/C][C]0[/C][/ROW]
[ROW][C]13[/C][C]0.022631[/C][C]0.2469[/C][C]0.402713[/C][/ROW]
[ROW][C]14[/C][C]0.022006[/C][C]0.2401[/C][C]0.40535[/C][/ROW]
[ROW][C]15[/C][C]-0.014819[/C][C]-0.1617[/C][C]0.435924[/C][/ROW]
[ROW][C]16[/C][C]0.043267[/C][C]0.472[/C][C]0.318899[/C][/ROW]
[ROW][C]17[/C][C]0.008468[/C][C]0.0924[/C][C]0.463279[/C][/ROW]
[ROW][C]18[/C][C]0.07716[/C][C]0.8417[/C][C]0.200818[/C][/ROW]
[ROW][C]19[/C][C]-0.100726[/C][C]-1.0988[/C][C]0.137039[/C][/ROW]
[ROW][C]20[/C][C]-0.019258[/C][C]-0.2101[/C][C]0.416982[/C][/ROW]
[ROW][C]21[/C][C]0.140163[/C][C]1.529[/C][C]0.064459[/C][/ROW]
[ROW][C]22[/C][C]0.053431[/C][C]0.5829[/C][C]0.280543[/C][/ROW]
[ROW][C]23[/C][C]0.021185[/C][C]0.2311[/C][C]0.408818[/C][/ROW]
[ROW][C]24[/C][C]-0.006015[/C][C]-0.0656[/C][C]0.473895[/C][/ROW]
[ROW][C]25[/C][C]-0.016166[/C][C]-0.1763[/C][C]0.430161[/C][/ROW]
[ROW][C]26[/C][C]0.003922[/C][C]0.0428[/C][C]0.482974[/C][/ROW]
[ROW][C]27[/C][C]0.0437[/C][C]0.4767[/C][C]0.317222[/C][/ROW]
[ROW][C]28[/C][C]-0.046821[/C][C]-0.5108[/C][C]0.305233[/C][/ROW]
[ROW][C]29[/C][C]-0.04663[/C][C]-0.5087[/C][C]0.305962[/C][/ROW]
[ROW][C]30[/C][C]0.02574[/C][C]0.2808[/C][C]0.38968[/C][/ROW]
[ROW][C]31[/C][C]0.071147[/C][C]0.7761[/C][C]0.21961[/C][/ROW]
[ROW][C]32[/C][C]-0.010283[/C][C]-0.1122[/C][C]0.455439[/C][/ROW]
[ROW][C]33[/C][C]-0.060151[/C][C]-0.6562[/C][C]0.256492[/C][/ROW]
[ROW][C]34[/C][C]-0.048444[/C][C]-0.5285[/C][C]0.299081[/C][/ROW]
[ROW][C]35[/C][C]0.058722[/C][C]0.6406[/C][C]0.261514[/C][/ROW]
[ROW][C]36[/C][C]-0.025592[/C][C]-0.2792[/C][C]0.390299[/C][/ROW]
[ROW][C]37[/C][C]0.00155[/C][C]0.0169[/C][C]0.493268[/C][/ROW]
[ROW][C]38[/C][C]-0.081776[/C][C]-0.8921[/C][C]0.187078[/C][/ROW]
[ROW][C]39[/C][C]0.006203[/C][C]0.0677[/C][C]0.473082[/C][/ROW]
[ROW][C]40[/C][C]-0.12315[/C][C]-1.3434[/C][C]0.090847[/C][/ROW]
[ROW][C]41[/C][C]-0.043859[/C][C]-0.4784[/C][C]0.316605[/C][/ROW]
[ROW][C]42[/C][C]-0.129025[/C][C]-1.4075[/C][C]0.080943[/C][/ROW]
[ROW][C]43[/C][C]-0.025571[/C][C]-0.2789[/C][C]0.390385[/C][/ROW]
[ROW][C]44[/C][C]0.015936[/C][C]0.1738[/C][C]0.431143[/C][/ROW]
[ROW][C]45[/C][C]0.019651[/C][C]0.2144[/C][C]0.415315[/C][/ROW]
[ROW][C]46[/C][C]-0.090472[/C][C]-0.9869[/C][C]0.162839[/C][/ROW]
[ROW][C]47[/C][C]0.040273[/C][C]0.4393[/C][C]0.330609[/C][/ROW]
[ROW][C]48[/C][C]-0.056761[/C][C]-0.6192[/C][C]0.268489[/C][/ROW]
[ROW][C]49[/C][C]0.105818[/C][C]1.1543[/C][C]0.125338[/C][/ROW]
[ROW][C]50[/C][C]0.023897[/C][C]0.2607[/C][C]0.397394[/C][/ROW]
[ROW][C]51[/C][C]-0.051184[/C][C]-0.5584[/C][C]0.288825[/C][/ROW]
[ROW][C]52[/C][C]-0.02502[/C][C]-0.2729[/C][C]0.392688[/C][/ROW]
[ROW][C]53[/C][C]0.00315[/C][C]0.0344[/C][C]0.486321[/C][/ROW]
[ROW][C]54[/C][C]-0.013409[/C][C]-0.1463[/C][C]0.441976[/C][/ROW]
[ROW][C]55[/C][C]0.073123[/C][C]0.7977[/C][C]0.213325[/C][/ROW]
[ROW][C]56[/C][C]-0.018367[/C][C]-0.2004[/C][C]0.420771[/C][/ROW]
[ROW][C]57[/C][C]-0.125242[/C][C]-1.3662[/C][C]0.087222[/C][/ROW]
[ROW][C]58[/C][C]0.012267[/C][C]0.1338[/C][C]0.446886[/C][/ROW]
[ROW][C]59[/C][C]-0.006693[/C][C]-0.073[/C][C]0.47096[/C][/ROW]
[ROW][C]60[/C][C]-0.028317[/C][C]-0.3089[/C][C]0.378969[/C][/ROW]
[/TABLE]
Source: https://freestatistics.org/blog/index.php?pk=306902&T=2

Globally Unique Identifier (entire table): ba.freestatistics.org/blog/index.php?pk=306902&T=2

As an alternative you can also use a QR Code:  

The GUIDs for individual cells are displayed in the table below:

Partial Autocorrelation Function
Time lag kPACF(k)T-STATP-value
1-0.216906-2.36620.009794
2-0.104807-1.14330.127603
3-0.191113-2.08480.019613
4-0.021979-0.23980.405463
5-0.161887-1.7660.039982
6-0.047081-0.51360.304244
7-0.123989-1.35260.089381
8-0.013633-0.14870.441014
9-0.190288-2.07580.020033
10-0.202374-2.20760.014593
11-0.356777-3.8928.2e-05
120.7549058.2350
130.0226310.24690.402713
140.0220060.24010.40535
15-0.014819-0.16170.435924
160.0432670.4720.318899
170.0084680.09240.463279
180.077160.84170.200818
19-0.100726-1.09880.137039
20-0.019258-0.21010.416982
210.1401631.5290.064459
220.0534310.58290.280543
230.0211850.23110.408818
24-0.006015-0.06560.473895
25-0.016166-0.17630.430161
260.0039220.04280.482974
270.04370.47670.317222
28-0.046821-0.51080.305233
29-0.04663-0.50870.305962
300.025740.28080.38968
310.0711470.77610.21961
32-0.010283-0.11220.455439
33-0.060151-0.65620.256492
34-0.048444-0.52850.299081
350.0587220.64060.261514
36-0.025592-0.27920.390299
370.001550.01690.493268
38-0.081776-0.89210.187078
390.0062030.06770.473082
40-0.12315-1.34340.090847
41-0.043859-0.47840.316605
42-0.129025-1.40750.080943
43-0.025571-0.27890.390385
440.0159360.17380.431143
450.0196510.21440.415315
46-0.090472-0.98690.162839
470.0402730.43930.330609
48-0.056761-0.61920.268489
490.1058181.15430.125338
500.0238970.26070.397394
51-0.051184-0.55840.288825
52-0.02502-0.27290.392688
530.003150.03440.486321
54-0.013409-0.14630.441976
550.0731230.79770.213325
56-0.018367-0.20040.420771
57-0.125242-1.36620.087222
580.0122670.13380.446886
59-0.006693-0.0730.47096
60-0.028317-0.30890.378969


Parameters (Session):
Parameters (R input):
par1 = 60 ; par2 = 1 ; par3 = 1 ; par4 = 0 ; par5 = 12 ; par6 = White Noise ; par7 = 0.95 ; par8 = ;
R code (references can be found in the software module):
if (par1 == 'Default') {
par1 = 10*log10(length(x))
} else {
par1 <- as.numeric(par1)
}
par2 <- as.numeric(par2)
par3 <- as.numeric(par3)
par4 <- as.numeric(par4)
par5 <- as.numeric(par5)
if (par6 == 'White Noise') par6 <- 'white' else par6 <- 'ma'
par7 <- as.numeric(par7)
if (par8 != '') par8 <- as.numeric(par8)
x <- na.omit(x)
ox <- x
if (par8 == '') {
if (par2 == 0) {
x <- log(x)
} else {
x <- (x ^ par2 - 1) / par2
}
} else {
x <- log(x,base=par8)
}
if (par3 > 0) x <- diff(x,lag=1,difference=par3)
if (par4 > 0) x <- diff(x,lag=par5,difference=par4)
bitmap(file='picts.png')
op <- par(mfrow=c(2,1))
plot(ox,type='l',main='Original Time Series',xlab='time',ylab='value')
if (par8=='') {
mytitle <- paste('Working Time Series (lambda=',par2,', d=',par3,', D=',par4,')',sep='')
mysub <- paste('(lambda=',par2,', d=',par3,', D=',par4,', CI=', par7, ', CI type=',par6,')',sep='')
} else {
mytitle <- paste('Working Time Series (base=',par8,', d=',par3,', D=',par4,')',sep='')
mysub <- paste('(base=',par8,', d=',par3,', D=',par4,', CI=', par7, ', CI type=',par6,')',sep='')
}
plot(x,type='l', main=mytitle,xlab='time',ylab='value')
par(op)
dev.off()
bitmap(file='pic1.png')
racf <- acf(x, par1, main='Autocorrelation', xlab='time lag', ylab='ACF', ci.type=par6, ci=par7, sub=mysub)
dev.off()
bitmap(file='pic2.png')
rpacf <- pacf(x,par1,main='Partial Autocorrelation',xlab='lags',ylab='PACF',sub=mysub)
dev.off()
(myacf <- c(racf$acf))
(mypacf <- c(rpacf$acf))
lengthx <- length(x)
sqrtn <- sqrt(lengthx)
load(file='createtable')
a<-table.start()
a<-table.row.start(a)
a<-table.element(a,'Autocorrelation Function',4,TRUE)
a<-table.row.end(a)
a<-table.row.start(a)
a<-table.element(a,'Time lag k',header=TRUE)
a<-table.element(a,'ACF(k)',header=TRUE)
a<-table.element(a,'T-STAT',header=TRUE)
a<-table.element(a,'P-value',header=TRUE)
a<-table.row.end(a)
for (i in 2:(par1+1)) {
a<-table.row.start(a)
a<-table.element(a,i-1,header=TRUE)
a<-table.element(a,round(myacf[i],6))
mytstat <- myacf[i]*sqrtn
a<-table.element(a,round(mytstat,4))
a<-table.element(a,round(1-pt(abs(mytstat),lengthx),6))
a<-table.row.end(a)
}
a<-table.end(a)
table.save(a,file='mytable.tab')
a<-table.start()
a<-table.row.start(a)
a<-table.element(a,'Partial Autocorrelation Function',4,TRUE)
a<-table.row.end(a)
a<-table.row.start(a)
a<-table.element(a,'Time lag k',header=TRUE)
a<-table.element(a,'PACF(k)',header=TRUE)
a<-table.element(a,'T-STAT',header=TRUE)
a<-table.element(a,'P-value',header=TRUE)
a<-table.row.end(a)
for (i in 1:par1) {
a<-table.row.start(a)
a<-table.element(a,i,header=TRUE)
a<-table.element(a,round(mypacf[i],6))
mytstat <- mypacf[i]*sqrtn
a<-table.element(a,round(mytstat,4))
a<-table.element(a,round(1-pt(abs(mytstat),lengthx),6))
a<-table.row.end(a)
}
a<-table.end(a)
table.save(a,file='mytable1.tab')