Free Statistics

of Irreproducible Research!

Author's title

Author*Unverified author*
R Software Modulerwasp_univariatedataseries.wasp
Title produced by softwareUnivariate Data Series
Date of computationWed, 09 Aug 2017 13:24:28 +0200
Cite this page as followsStatistical Computations at FreeStatistics.org, Office for Research Development and Education, URL https://freestatistics.org/blog/index.php?v=date/2017/Aug/09/t1502277892uxwjysfuzhrqu6k.htm/, Retrieved Tue, 14 May 2024 05:42:06 +0200
Statistical Computations at FreeStatistics.org, Office for Research Development and Education, URL https://freestatistics.org/blog/index.php?pk=, Retrieved Tue, 14 May 2024 05:42:06 +0200
QR Codes:

Original text written by user:
IsPrivate?No (this computation is public)
User-defined keywords
Estimated Impact0
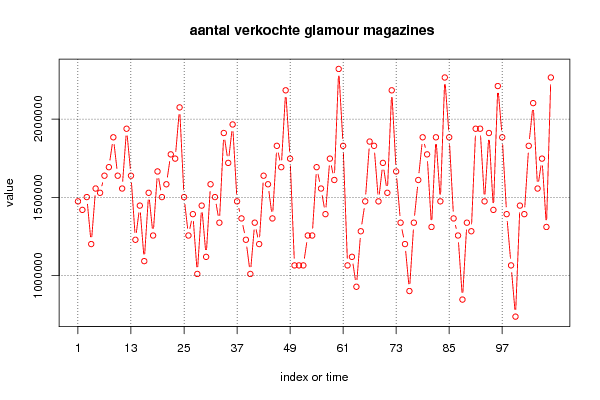
Dataseries X:
1474200
1419600
1501500
1201200
1556100
1528800
1638000
1692600
1883700
1638000
1556100
1938300
1638000
1228500
1446900
1092000
1528800
1255800
1665300
1501500
1583400
1774500
1747200
2074800
1501500
1255800
1392300
1010100
1446900
1119300
1583400
1501500
1337700
1911000
1719900
1965600
1474200
1365000
1228500
1010100
1337700
1201200
1638000
1583400
1365000
1829100
1692600
2184000
1747200
1064700
1064700
1064700
1255800
1255800
1692600
1556100
1392300
1747200
1610700
2320500
1829100
1064700
1119300
928200
1283100
1474200
1856400
1829100
1474200
1719900
1528800
2184000
1665300
1337700
1201200
900900
1337700
1610700
1883700
1774500
1310400
1883700
1474200
2265900
1883700
1365000
1255800
846300
1337700
1283100
1938300
1938300
1474200
1911000
1419600
2211300
1883700
1392300
1064700
737100
1446900
1392300
1829100
2102100
1556100
1747200
1310400
2265900


Summary of computational transaction
Raw Input view raw input (R code)
Raw Outputview raw output of R engine
Computing time1 seconds
R ServerBig Analytics Cloud Computing Center
R Framework error message
Warning: there are blank lines in the 'Data' field.
Please, use NA for missing data - blank lines are simply
 deleted and are NOT treated as missing values.

\begin{tabular}{lllllllll}
\hline
Summary of computational transaction \tabularnewline
Raw Input view raw input (R code)  \tabularnewline
Raw Outputview raw output of R engine  \tabularnewline
Computing time1 seconds \tabularnewline
R ServerBig Analytics Cloud Computing Center \tabularnewline
R Framework error message & 
Warning: there are blank lines in the 'Data' field.
Please, use NA for missing data - blank lines are simply
 deleted and are NOT treated as missing values.
\tabularnewline \hline \end{tabular} %Source: https://freestatistics.org/blog/index.php?pk=&T=0

[TABLE]
[ROW]
Summary of computational transaction[/C][/ROW] [ROW]Raw Input[/C] view raw input (R code) [/C][/ROW] [ROW]Raw Output[/C]view raw output of R engine [/C][/ROW] [ROW]Computing time[/C]1 seconds[/C][/ROW] [ROW]R Server[/C]Big Analytics Cloud Computing Center[/C][/ROW] [ROW]R Framework error message[/C][C]
Warning: there are blank lines in the 'Data' field.
Please, use NA for missing data - blank lines are simply
 deleted and are NOT treated as missing values.
[/C][/ROW] [/TABLE] Source: https://freestatistics.org/blog/index.php?pk=&T=0

Globally Unique Identifier (entire table): ba.freestatistics.org/blog/index.php?pk=&T=0

As an alternative you can also use a QR Code:  

The GUIDs for individual cells are displayed in the table below:

Summary of computational transaction
Raw Input view raw input (R code)
Raw Outputview raw output of R engine
Computing time1 seconds
R ServerBig Analytics Cloud Computing Center
R Framework error message
Warning: there are blank lines in the 'Data' field.
Please, use NA for missing data - blank lines are simply
 deleted and are NOT treated as missing values.


Univariate Dataseries
Name of dataseriesaantal verkochte glamour magazines
Sourceniet gekend
Descriptionhoeveelheid verkochte exemplaren glamour magazines
Number of observations108

\begin{tabular}{lllllllll}
\hline
Univariate Dataseries \tabularnewline
Name of dataseries & aantal verkochte glamour magazines  \tabularnewline
Source & niet gekend \tabularnewline
Description & hoeveelheid verkochte exemplaren glamour magazines  \tabularnewline
Number of observations & 108 \tabularnewline
\hline
\end{tabular}
%Source: https://freestatistics.org/blog/index.php?pk=&T=1

[TABLE]
[ROW][C]Univariate Dataseries[/C][/ROW]
[ROW][C]Name of dataseries[/C][C]aantal verkochte glamour magazines [/C][/ROW]
[ROW][C]Source[/C][C]niet gekend[/C][/ROW]
[ROW][C]Description[/C][C]hoeveelheid verkochte exemplaren glamour magazines [/C][/ROW]
[ROW][C]Number of observations[/C][C]108[/C][/ROW]
[/TABLE]
Source: https://freestatistics.org/blog/index.php?pk=&T=1

Globally Unique Identifier (entire table): ba.freestatistics.org/blog/index.php?pk=&T=1

As an alternative you can also use a QR Code:  

The GUIDs for individual cells are displayed in the table below:

Univariate Dataseries
Name of dataseriesaantal verkochte glamour magazines
Sourceniet gekend
Descriptionhoeveelheid verkochte exemplaren glamour magazines
Number of observations108


Summary Statistics of dataseries x
> summary(x)
   Min. 1st Qu.  Median    Mean 3rd Qu.    Max. 
 737100 1310400 1501500 1532592 1747200 2320500 

\begin{tabular}{lllllllll}
\hline
Summary Statistics of dataseries x \tabularnewline
> summary(x)
   Min. 1st Qu.  Median    Mean 3rd Qu.    Max. 
 737100 1310400 1501500 1532592 1747200 2320500 
\tabularnewline \hline \end{tabular} %Source: https://freestatistics.org/blog/index.php?pk=&T=2

[TABLE]
[ROW][C]Summary Statistics of dataseries x[/C][/ROW]
[ROW][C]
> summary(x)
   Min. 1st Qu.  Median    Mean 3rd Qu.    Max. 
 737100 1310400 1501500 1532592 1747200 2320500 
[/C][/ROW] [/TABLE] Source: https://freestatistics.org/blog/index.php?pk=&T=2

Globally Unique Identifier (entire table): ba.freestatistics.org/blog/index.php?pk=&T=2

As an alternative you can also use a QR Code:  

The GUIDs for individual cells are displayed in the table below:

Summary Statistics of dataseries x
> summary(x)
   Min. 1st Qu.  Median    Mean 3rd Qu.    Max. 
 737100 1310400 1501500 1532592 1747200 2320500 


Parameters (Session):
par1 = aantal verkochte glamour magazines ; par2 = niet gekend ; par3 = hoeveelheid verkochte exemplaren glamour magazines ; par4 = 12 ;
Parameters (R input):
par1 = aantal verkochte glamour magazines ; par2 = niet gekend ; par3 = hoeveelheid verkochte exemplaren glamour magazines ; par4 = 12 ;
R code (references can be found in the software module):
par4 <- '12'
par3 <- 'hoeveelheid verkochte exemplaren glamour magazines '
par2 <- 'niet gekend'
par1 <- 'aantal verkochte glamour magazines '
if (par4 != 'No season') {
par4 <- as.numeric(par4)
if (par4 < 4) par4 <- 12
}
summary(x)
n <- length(x)
bitmap(file='test1.png')
if (par4=='No season') {
plot(x,col=2,type='b',main=main,xlab=xlab,ylab=ylab,xaxt='n')
axis(1,at=seq(1,n,10))
}
if (par4!='No season') {
plot(x,col=2,type='b',main=main,xlab=xlab,ylab=ylab,xaxt='n')
axis(1,at=seq(1,n,par4))
grid(nx=0,ny=NULL,col='black')
abline(v=seq(1,n,par4),col='black',lty='dotted')
}
dev.off()
load(file='createtable')
a<-table.start()
a<-table.row.start(a)
a<-table.element(a,'Univariate Dataseries',2,TRUE)
a<-table.row.end(a)
a<-table.row.start(a)
a<-table.element(a,'Name of dataseries',header=TRUE)
a<-table.element(a,par1)
a<-table.row.end(a)
a<-table.row.start(a)
a<-table.element(a,'Source',header=TRUE)
a<-table.element(a,par2)
a<-table.row.end(a)
a<-table.row.start(a)
a<-table.element(a,'Description',header=TRUE)
a<-table.element(a,par3)
a<-table.row.end(a)
a<-table.row.start(a)
a<-table.element(a,'Number of observations',header=TRUE)
a<-table.element(a,length(x))
a<-table.row.end(a)
a<-table.end(a)
table.save(a,file='mytable.tab')
a<-table.start()
a<-table.row.start(a)
a<-table.element(a,'Summary Statistics of dataseries x',1,TRUE)
a<-table.row.end(a)
a<-table.row.start(a)
a<-table.element(a,paste('
',RC.texteval('summary(x)'),'
',sep=''))
a<-table.row.end(a)
a<-table.end(a)
table.save(a,file='mytable1.tab')