Free Statistics
of Irreproducible Research!
Description of Statistical Computation | |||||||||||||||||||||||||||||||||||||||||||||||||||||||||||
|---|---|---|---|---|---|---|---|---|---|---|---|---|---|---|---|---|---|---|---|---|---|---|---|---|---|---|---|---|---|---|---|---|---|---|---|---|---|---|---|---|---|---|---|---|---|---|---|---|---|---|---|---|---|---|---|---|---|---|---|
| Author's title | |||||||||||||||||||||||||||||||||||||||||||||||||||||||||||
| Author | *Unverified author* | ||||||||||||||||||||||||||||||||||||||||||||||||||||||||||
| R Software Module | rwasp_univariatedataseries.wasp | ||||||||||||||||||||||||||||||||||||||||||||||||||||||||||
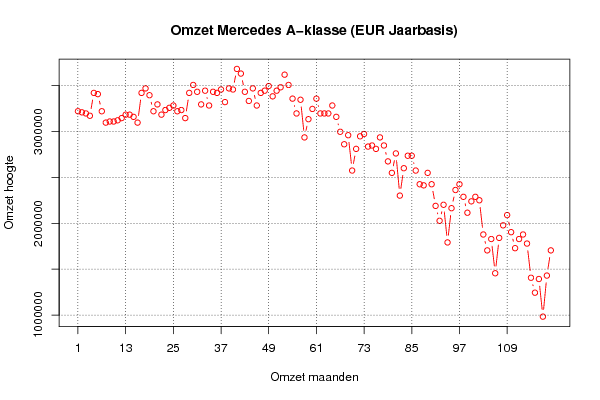
| Title produced by software | Univariate Data Series | ||||||||||||||||||||||||||||||||||||||||||||||||||||||||||
| Date of computation | Wed, 09 Aug 2017 19:08:27 +0200 | ||||||||||||||||||||||||||||||||||||||||||||||||||||||||||
| Cite this page as follows | Statistical Computations at FreeStatistics.org, Office for Research Development and Education, URL https://freestatistics.org/blog/index.php?v=date/2017/Aug/09/t1502298540epk4hxq3m8tlc11.htm/, Retrieved Tue, 14 May 2024 16:09:36 +0000 | ||||||||||||||||||||||||||||||||||||||||||||||||||||||||||
| Statistical Computations at FreeStatistics.org, Office for Research Development and Education, URL https://freestatistics.org/blog/index.php?pk=307031, Retrieved Tue, 14 May 2024 16:09:36 +0000 | |||||||||||||||||||||||||||||||||||||||||||||||||||||||||||
| QR Codes: | |||||||||||||||||||||||||||||||||||||||||||||||||||||||||||
|
| |||||||||||||||||||||||||||||||||||||||||||||||||||||||||||
| Original text written by user: | |||||||||||||||||||||||||||||||||||||||||||||||||||||||||||
| IsPrivate? | No (this computation is public) | ||||||||||||||||||||||||||||||||||||||||||||||||||||||||||
| User-defined keywords | |||||||||||||||||||||||||||||||||||||||||||||||||||||||||||
| Estimated Impact | 124 | ||||||||||||||||||||||||||||||||||||||||||||||||||||||||||
Tree of Dependent Computations | |||||||||||||||||||||||||||||||||||||||||||||||||||||||||||
| Family? (F = Feedback message, R = changed R code, M = changed R Module, P = changed Parameters, D = changed Data) | |||||||||||||||||||||||||||||||||||||||||||||||||||||||||||
| - [Univariate Data Series] [Omzet Mercedes A-...] [2017-08-09 17:08:27] [35d4184f59ec62fac19bf382c4afaa07] [Current] - RMPD [Histogram] [] [2017-08-09 19:05:16] [761e4adbe8124e6083bfb711aef3fb41] - RMPD [Kernel Density Estimation] [] [2017-08-09 20:11:37] [761e4adbe8124e6083bfb711aef3fb41] - RMPD [Kernel Density Estimation] [Yunis Eillyas] [2017-08-09 20:11:37] [761e4adbe8124e6083bfb711aef3fb41] - RMPD [Kernel Density Estimation] [Yunis Eillyas] [2017-08-09 20:21:50] [761e4adbe8124e6083bfb711aef3fb41] - RMPD [Kernel Density Estimation] [YUNIS EILLYAS ] [2017-08-09 20:32:45] [761e4adbe8124e6083bfb711aef3fb41] - RMPD [Notched Boxplots] [Omzet Mercedes A-...] [2017-08-09 21:15:22] [761e4adbe8124e6083bfb711aef3fb41] - RMPD [Harrell-Davis Quantiles] [] [2017-08-09 21:45:23] [761e4adbe8124e6083bfb711aef3fb41] - RMPD [Central Tendency] [] [2017-08-09 22:40:51] [761e4adbe8124e6083bfb711aef3fb41] - RMPD [(Partial) Autocorrelation Function] [] [2017-08-10 00:37:55] [761e4adbe8124e6083bfb711aef3fb41] - RMP [Standard Deviation-Mean Plot] [] [2017-08-16 11:30:21] [761e4adbe8124e6083bfb711aef3fb41] - RMP [Classical Decomposition] [] [2017-08-16 12:59:43] [761e4adbe8124e6083bfb711aef3fb41] - RMPD [Univariate Data Series] [] [2017-08-16 14:56:14] [761e4adbe8124e6083bfb711aef3fb41] - RMPD [Kernel Density Estimation] [] [2017-08-16 15:21:22] [761e4adbe8124e6083bfb711aef3fb41] - RMP [Harrell-Davis Quantiles] [] [2017-08-16 15:51:45] [761e4adbe8124e6083bfb711aef3fb41] - RMP [Harrell-Davis Quantiles] [] [2017-08-16 16:08:08] [761e4adbe8124e6083bfb711aef3fb41] - RMP [Notched Boxplots] [] [2017-08-16 16:32:00] [761e4adbe8124e6083bfb711aef3fb41] - RMP [Mean Plot] [] [2017-08-16 16:48:25] [761e4adbe8124e6083bfb711aef3fb41] - RMP [Variability] [] [2017-08-16 16:52:31] [761e4adbe8124e6083bfb711aef3fb41] - RMP [Standard Deviation-Mean Plot] [] [2017-08-16 16:58:16] [761e4adbe8124e6083bfb711aef3fb41] - RMPD [Exponential Smoothing] [] [2017-08-16 17:09:53] [761e4adbe8124e6083bfb711aef3fb41] - RMPD [Harrell-Davis Quantiles] [] [2017-08-16 17:17:23] [761e4adbe8124e6083bfb711aef3fb41] | |||||||||||||||||||||||||||||||||||||||||||||||||||||||||||
| Feedback Forum | |||||||||||||||||||||||||||||||||||||||||||||||||||||||||||
Post a new message | |||||||||||||||||||||||||||||||||||||||||||||||||||||||||||
Dataset | |||||||||||||||||||||||||||||||||||||||||||||||||||||||||||
| Dataseries X: | |||||||||||||||||||||||||||||||||||||||||||||||||||||||||||
3221816 3209817 3197649 3172468 3421574 3408392 3221816 3097770 3109769 3109769 3123120 3147118 3184467 3184467 3160469 3097770 3421574 3470922 3396393 3221816 3296514 3184467 3234998 3259165 3284346 3221816 3234998 3147118 3421574 3508271 3433742 3296514 3445741 3284346 3433742 3421574 3458923 3321695 3470922 3458923 3682848 3632317 3433742 3333694 3470922 3284346 3421574 3445741 3496272 3384394 3445741 3483090 3620318 3508271 3359044 3197649 3347045 2936375 3135119 3246997 3359044 3197649 3197649 3197649 3284346 3160469 2997891 2861846 2960542 2575222 2811315 2948543 2973724 2836496 2848495 2811315 2936375 2848495 2675270 2550041 2761798 2301949 2600572 2736617 2736617 2575222 2425995 2413996 2550041 2425995 2190071 2027493 2202070 1791569 2164721 2363296 2425995 2288767 2115373 2239419 2288767 2251418 1878097 1704872 1828749 1455597 1840917 1978145 2090023 1903447 1728870 1828749 1878097 1779401 1406249 1243671 1392898 982397 1430247 1704872 | |||||||||||||||||||||||||||||||||||||||||||||||||||||||||||
Tables (Output of Computation) | |||||||||||||||||||||||||||||||||||||||||||||||||||||||||||
| |||||||||||||||||||||||||||||||||||||||||||||||||||||||||||
Figures (Output of Computation) | |||||||||||||||||||||||||||||||||||||||||||||||||||||||||||
Input Parameters & R Code | |||||||||||||||||||||||||||||||||||||||||||||||||||||||||||
| Parameters (Session): | |||||||||||||||||||||||||||||||||||||||||||||||||||||||||||
| par1 = Omzet Mercedes A-klasse ; par2 = Mercedes ; par3 = Omzet Mercedes A-klasse ; par4 = 12 ; | |||||||||||||||||||||||||||||||||||||||||||||||||||||||||||
| Parameters (R input): | |||||||||||||||||||||||||||||||||||||||||||||||||||||||||||
| par1 = Omzet Mercedes A-klasse ; par2 = Mercedes ; par3 = Omzet Mercedes A-klasse ; par4 = 12 ; | |||||||||||||||||||||||||||||||||||||||||||||||||||||||||||
| R code (references can be found in the software module): | |||||||||||||||||||||||||||||||||||||||||||||||||||||||||||
if (par4 != 'No season') { | |||||||||||||||||||||||||||||||||||||||||||||||||||||||||||