Free Statistics

of Irreproducible Research!

Author's title

Author*Unverified author*
R Software Modulerwasp_smp.wasp
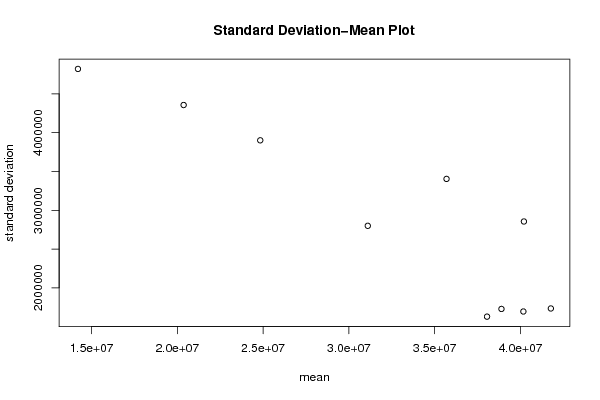
Title produced by softwareStandard Deviation-Mean Plot
Date of computationSat, 12 Aug 2017 17:52:37 +0200
Cite this page as followsStatistical Computations at FreeStatistics.org, Office for Research Development and Education, URL https://freestatistics.org/blog/index.php?v=date/2017/Aug/12/t1502553173oecdlh62bxou068.htm/, Retrieved Fri, 10 May 2024 05:59:52 +0000
Statistical Computations at FreeStatistics.org, Office for Research Development and Education, URL https://freestatistics.org/blog/index.php?pk=307134, Retrieved Fri, 10 May 2024 05:59:52 +0000
QR Codes:

Original text written by user:
IsPrivate?No (this computation is public)
User-defined keywords
Estimated Impact147
Family? (F = Feedback message, R = changed R code, M = changed R Module, P = changed Parameters, D = changed Data)
-       [Standard Deviation-Mean Plot] [] [2017-08-12 15:52:37] [270a72b021b4bbf70c885af1fd2608d6] [Current]
Feedback Forum

Post a new message
Dataseries X:
38327240.00
38147255.00
37964735.00
37587020.00
41323610.00
41125880.00
38327240.00
36466550.00
36646535.00
36646535.00
36846800.00
37206770.00
37767005.00
37767005.00
37407035.00
36466550.00
41323610.00
42063830.00
40945895.00
38327240.00
39447710.00
37767005.00
38524970.00
38887475.00
39265190.00
38327240.00
38524970.00
37206770.00
41323610.00
42624065.00
41506130.00
39447710.00
41686115.00
39265190.00
41506130.00
41323610.00
41883845.00
39825425.00
42063830.00
41883845.00
45242720.00
44484755.00
41506130.00
40005410.00
42063830.00
39265190.00
41323610.00
41686115.00
42444080.00
40765910.00
41686115.00
42246350.00
44304770.00
42624065.00
40385660.00
37964735.00
40205675.00
34045625.00
37026785.00
38704955.00
40385660.00
37964735.00
37964735.00
37964735.00
39265190.00
37407035.00
34968365.00
32927690.00
34408130.00
28628330.00
32169725.00
34228145.00
34605860.00
32547440.00
32727425.00
32169725.00
34045625.00
32727425.00
30129050.00
28250615.00
31426970.00
24529235.00
29008580.00
31049255.00
31049255.00
28628330.00
26389925.00
26209940.00
28250615.00
26389925.00
22851065.00
20412395.00
23031050.00
16873535.00
22470815.00
25449440.00
26389925.00
24331505.00
21730595.00
23591285.00
24331505.00
23771270.00
18171455.00
15573080.00
17431235.00
11833955.00
17613755.00
19672175.00
21350345.00
18551705.00
15933050.00
17431235.00
18171455.00
16691015.00
11093735.00
8655065.00
10893470.00
4735955.00
11453705.00
15573080.00


Summary of computational transaction
Raw Input view raw input (R code)
Raw Outputview raw output of R engine
Computing time1 seconds
R ServerBig Analytics Cloud Computing Center

\begin{tabular}{lllllllll}
\hline
Summary of computational transaction \tabularnewline
Raw Input view raw input (R code)  \tabularnewline
Raw Outputview raw output of R engine  \tabularnewline
Computing time1 seconds \tabularnewline
R ServerBig Analytics Cloud Computing Center \tabularnewline
\hline
\end{tabular}
%Source: https://freestatistics.org/blog/index.php?pk=307134&T=0

[TABLE]
[ROW]
Summary of computational transaction[/C][/ROW] [ROW]Raw Input[/C] view raw input (R code) [/C][/ROW] [ROW]Raw Output[/C]view raw output of R engine [/C][/ROW] [ROW]Computing time[/C]1 seconds[/C][/ROW] [ROW]R Server[/C]Big Analytics Cloud Computing Center[/C][/ROW] [/TABLE] Source: https://freestatistics.org/blog/index.php?pk=307134&T=0

Globally Unique Identifier (entire table): ba.freestatistics.org/blog/index.php?pk=307134&T=0

As an alternative you can also use a QR Code:  

The GUIDs for individual cells are displayed in the table below:

Summary of computational transaction
Raw Input view raw input (R code)
Raw Outputview raw output of R engine
Computing time1 seconds
R ServerBig Analytics Cloud Computing Center


Standard Deviation-Mean Plot
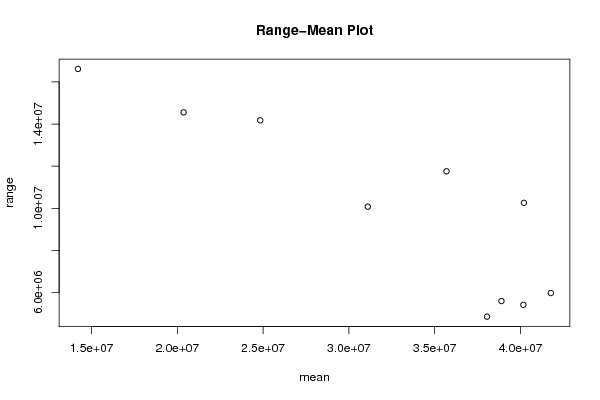
SectionMeanStandard DeviationRange
138051347.51628379.299574924857060
238891277.51727819.964052845597280
340167227.51694771.412907015417295
441769558.751733976.541597285977530
540200393.752855443.8820229710259145
635690206.253404455.8586025611757330
731101433.752799746.2258586310076625
824833857.53902216.9948065214175720
9203701454357348.7112197214555970
1014211151.254822383.3226594716614390

\begin{tabular}{lllllllll}
\hline
Standard Deviation-Mean Plot \tabularnewline
Section & Mean & Standard Deviation & Range \tabularnewline
1 & 38051347.5 & 1628379.29957492 & 4857060 \tabularnewline
2 & 38891277.5 & 1727819.96405284 & 5597280 \tabularnewline
3 & 40167227.5 & 1694771.41290701 & 5417295 \tabularnewline
4 & 41769558.75 & 1733976.54159728 & 5977530 \tabularnewline
5 & 40200393.75 & 2855443.88202297 & 10259145 \tabularnewline
6 & 35690206.25 & 3404455.85860256 & 11757330 \tabularnewline
7 & 31101433.75 & 2799746.22585863 & 10076625 \tabularnewline
8 & 24833857.5 & 3902216.99480652 & 14175720 \tabularnewline
9 & 20370145 & 4357348.71121972 & 14555970 \tabularnewline
10 & 14211151.25 & 4822383.32265947 & 16614390 \tabularnewline
\hline
\end{tabular}
%Source: https://freestatistics.org/blog/index.php?pk=307134&T=1

[TABLE]
[ROW][C]Standard Deviation-Mean Plot[/C][/ROW]
[ROW][C]Section[/C][C]Mean[/C][C]Standard Deviation[/C][C]Range[/C][/ROW]
[ROW][C]1[/C][C]38051347.5[/C][C]1628379.29957492[/C][C]4857060[/C][/ROW]
[ROW][C]2[/C][C]38891277.5[/C][C]1727819.96405284[/C][C]5597280[/C][/ROW]
[ROW][C]3[/C][C]40167227.5[/C][C]1694771.41290701[/C][C]5417295[/C][/ROW]
[ROW][C]4[/C][C]41769558.75[/C][C]1733976.54159728[/C][C]5977530[/C][/ROW]
[ROW][C]5[/C][C]40200393.75[/C][C]2855443.88202297[/C][C]10259145[/C][/ROW]
[ROW][C]6[/C][C]35690206.25[/C][C]3404455.85860256[/C][C]11757330[/C][/ROW]
[ROW][C]7[/C][C]31101433.75[/C][C]2799746.22585863[/C][C]10076625[/C][/ROW]
[ROW][C]8[/C][C]24833857.5[/C][C]3902216.99480652[/C][C]14175720[/C][/ROW]
[ROW][C]9[/C][C]20370145[/C][C]4357348.71121972[/C][C]14555970[/C][/ROW]
[ROW][C]10[/C][C]14211151.25[/C][C]4822383.32265947[/C][C]16614390[/C][/ROW]
[/TABLE]
Source: https://freestatistics.org/blog/index.php?pk=307134&T=1

Globally Unique Identifier (entire table): ba.freestatistics.org/blog/index.php?pk=307134&T=1

As an alternative you can also use a QR Code:  

The GUIDs for individual cells are displayed in the table below:

Standard Deviation-Mean Plot
SectionMeanStandard DeviationRange
138051347.51628379.299574924857060
238891277.51727819.964052845597280
340167227.51694771.412907015417295
441769558.751733976.541597285977530
540200393.752855443.8820229710259145
635690206.253404455.8586025611757330
731101433.752799746.2258586310076625
824833857.53902216.9948065214175720
9203701454357348.7112197214555970
1014211151.254822383.3226594716614390


Regression: S.E.(k) = alpha + beta * Mean(k)
alpha6573330.38467482
beta-0.113151792219188
S.D.0.0185894327362385
T-STAT-6.08688784777213
p-value0.000293686871073616

\begin{tabular}{lllllllll}
\hline
Regression: S.E.(k) = alpha + beta * Mean(k) \tabularnewline
alpha & 6573330.38467482 \tabularnewline
beta & -0.113151792219188 \tabularnewline
S.D. & 0.0185894327362385 \tabularnewline
T-STAT & -6.08688784777213 \tabularnewline
p-value & 0.000293686871073616 \tabularnewline
\hline
\end{tabular}
%Source: https://freestatistics.org/blog/index.php?pk=307134&T=2

[TABLE]
[ROW][C]Regression: S.E.(k) = alpha + beta * Mean(k)[/C][/ROW]
[ROW][C]alpha[/C][C]6573330.38467482[/C][/ROW]
[ROW][C]beta[/C][C]-0.113151792219188[/C][/ROW]
[ROW][C]S.D.[/C][C]0.0185894327362385[/C][/ROW]
[ROW][C]T-STAT[/C][C]-6.08688784777213[/C][/ROW]
[ROW][C]p-value[/C][C]0.000293686871073616[/C][/ROW]
[/TABLE]
Source: https://freestatistics.org/blog/index.php?pk=307134&T=2

Globally Unique Identifier (entire table): ba.freestatistics.org/blog/index.php?pk=307134&T=2

As an alternative you can also use a QR Code:  

The GUIDs for individual cells are displayed in the table below:

Regression: S.E.(k) = alpha + beta * Mean(k)
alpha6573330.38467482
beta-0.113151792219188
S.D.0.0185894327362385
T-STAT-6.08688784777213
p-value0.000293686871073616


Regression: ln S.E.(k) = alpha + beta * ln Mean(k)
alpha31.6754980983751
beta-0.978608016258378
S.D.0.232210749780917
T-STAT-4.21430970435978
p-value0.00293853925685169
Lambda1.97860801625838

\begin{tabular}{lllllllll}
\hline
Regression: ln S.E.(k) = alpha + beta * ln Mean(k) \tabularnewline
alpha & 31.6754980983751 \tabularnewline
beta & -0.978608016258378 \tabularnewline
S.D. & 0.232210749780917 \tabularnewline
T-STAT & -4.21430970435978 \tabularnewline
p-value & 0.00293853925685169 \tabularnewline
Lambda & 1.97860801625838 \tabularnewline
\hline
\end{tabular}
%Source: https://freestatistics.org/blog/index.php?pk=307134&T=3

[TABLE]
[ROW][C]Regression: ln S.E.(k) = alpha + beta * ln Mean(k)[/C][/ROW]
[ROW][C]alpha[/C][C]31.6754980983751[/C][/ROW]
[ROW][C]beta[/C][C]-0.978608016258378[/C][/ROW]
[ROW][C]S.D.[/C][C]0.232210749780917[/C][/ROW]
[ROW][C]T-STAT[/C][C]-4.21430970435978[/C][/ROW]
[ROW][C]p-value[/C][C]0.00293853925685169[/C][/ROW]
[ROW][C]Lambda[/C][C]1.97860801625838[/C][/ROW]
[/TABLE]
Source: https://freestatistics.org/blog/index.php?pk=307134&T=3

Globally Unique Identifier (entire table): ba.freestatistics.org/blog/index.php?pk=307134&T=3

As an alternative you can also use a QR Code:  

The GUIDs for individual cells are displayed in the table below:

Regression: ln S.E.(k) = alpha + beta * ln Mean(k)
alpha31.6754980983751
beta-0.978608016258378
S.D.0.232210749780917
T-STAT-4.21430970435978
p-value0.00293853925685169
Lambda1.97860801625838


Parameters (Session):
par1 = 48481212 ; par2 = 11 ; par3 = 01 ; par4 = 01 ; par5 = 1212 ; par6 = White NoiseWhite Noise ; par7 = 0.950.95 ;
Parameters (R input):
par1 = 12 ;
R code (references can be found in the software module):
par1 <- as.numeric(par1)
(n <- length(x))
(np <- floor(n / par1))
arr <- array(NA,dim=c(par1,np))
j <- 0
k <- 1
for (i in 1:(np*par1))
{
j = j + 1
arr[j,k] <- x[i]
if (j == par1) {
j = 0
k=k+1
}
}
arr
arr.mean <- array(NA,dim=np)
arr.sd <- array(NA,dim=np)
arr.range <- array(NA,dim=np)
for (j in 1:np)
{
arr.mean[j] <- mean(arr[,j],na.rm=TRUE)
arr.sd[j] <- sd(arr[,j],na.rm=TRUE)
arr.range[j] <- max(arr[,j],na.rm=TRUE) - min(arr[,j],na.rm=TRUE)
}
arr.mean
arr.sd
arr.range
(lm1 <- lm(arr.sd~arr.mean))
(lnlm1 <- lm(log(arr.sd)~log(arr.mean)))
(lm2 <- lm(arr.range~arr.mean))
bitmap(file='test1.png')
plot(arr.mean,arr.sd,main='Standard Deviation-Mean Plot',xlab='mean',ylab='standard deviation')
dev.off()
bitmap(file='test2.png')
plot(arr.mean,arr.range,main='Range-Mean Plot',xlab='mean',ylab='range')
dev.off()
load(file='createtable')
a<-table.start()
a<-table.row.start(a)
a<-table.element(a,'Standard Deviation-Mean Plot',4,TRUE)
a<-table.row.end(a)
a<-table.row.start(a)
a<-table.element(a,'Section',header=TRUE)
a<-table.element(a,'Mean',header=TRUE)
a<-table.element(a,'Standard Deviation',header=TRUE)
a<-table.element(a,'Range',header=TRUE)
a<-table.row.end(a)
for (j in 1:np) {
a<-table.row.start(a)
a<-table.element(a,j,header=TRUE)
a<-table.element(a,arr.mean[j])
a<-table.element(a,arr.sd[j] )
a<-table.element(a,arr.range[j] )
a<-table.row.end(a)
}
a<-table.end(a)
table.save(a,file='mytable.tab')
a<-table.start()
a<-table.row.start(a)
a<-table.element(a,'Regression: S.E.(k) = alpha + beta * Mean(k)',2,TRUE)
a<-table.row.end(a)
a<-table.row.start(a)
a<-table.element(a,'alpha',header=TRUE)
a<-table.element(a,lm1$coefficients[[1]])
a<-table.row.end(a)
a<-table.row.start(a)
a<-table.element(a,'beta',header=TRUE)
a<-table.element(a,lm1$coefficients[[2]])
a<-table.row.end(a)
a<-table.row.start(a)
a<-table.element(a,'S.D.',header=TRUE)
a<-table.element(a,summary(lm1)$coefficients[2,2])
a<-table.row.end(a)
a<-table.row.start(a)
a<-table.element(a,'T-STAT',header=TRUE)
a<-table.element(a,summary(lm1)$coefficients[2,3])
a<-table.row.end(a)
a<-table.row.start(a)
a<-table.element(a,'p-value',header=TRUE)
a<-table.element(a,summary(lm1)$coefficients[2,4])
a<-table.row.end(a)
a<-table.end(a)
table.save(a,file='mytable1.tab')
a<-table.start()
a<-table.row.start(a)
a<-table.element(a,'Regression: ln S.E.(k) = alpha + beta * ln Mean(k)',2,TRUE)
a<-table.row.end(a)
a<-table.row.start(a)
a<-table.element(a,'alpha',header=TRUE)
a<-table.element(a,lnlm1$coefficients[[1]])
a<-table.row.end(a)
a<-table.row.start(a)
a<-table.element(a,'beta',header=TRUE)
a<-table.element(a,lnlm1$coefficients[[2]])
a<-table.row.end(a)
a<-table.row.start(a)
a<-table.element(a,'S.D.',header=TRUE)
a<-table.element(a,summary(lnlm1)$coefficients[2,2])
a<-table.row.end(a)
a<-table.row.start(a)
a<-table.element(a,'T-STAT',header=TRUE)
a<-table.element(a,summary(lnlm1)$coefficients[2,3])
a<-table.row.end(a)
a<-table.row.start(a)
a<-table.element(a,'p-value',header=TRUE)
a<-table.element(a,summary(lnlm1)$coefficients[2,4])
a<-table.row.end(a)
a<-table.row.start(a)
a<-table.element(a,'Lambda',header=TRUE)
a<-table.element(a,1-lnlm1$coefficients[[2]])
a<-table.row.end(a)
a<-table.end(a)
table.save(a,file='mytable2.tab')