Free Statistics

of Irreproducible Research!

Author's title

Author*Unverified author*
R Software Modulerwasp_notchedbox1.wasp
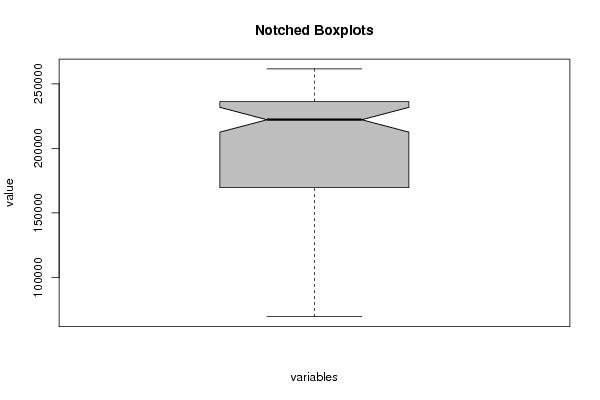
Title produced by softwareNotched Boxplots
Date of computationSun, 13 Aug 2017 12:37:53 +0200
Cite this page as followsStatistical Computations at FreeStatistics.org, Office for Research Development and Education, URL https://freestatistics.org/blog/index.php?v=date/2017/Aug/13/t1502620708q2kpo2s76d7l0mh.htm/, Retrieved Thu, 09 May 2024 20:59:11 +0000
Statistical Computations at FreeStatistics.org, Office for Research Development and Education, URL https://freestatistics.org/blog/index.php?pk=307167, Retrieved Thu, 09 May 2024 20:59:11 +0000
QR Codes:

Original text written by user:
IsPrivate?No (this computation is public)
User-defined keywords
Estimated Impact124
Family? (F = Feedback message, R = changed R code, M = changed R Module, P = changed Parameters, D = changed Data)
-       [Notched Boxplots] [Omzet product BVB...] [2017-08-13 10:37:53] [6bb7048e855cced252efb5418d255fa6] [Current]
Feedback Forum

Post a new message
Dataseries X:
228768
227916
227052
225264
242952
242016
228768
219960
220812
220812
221760
223464
226116
226116
224412
219960
242952
246456
241164
228768
234072
226116
229704
231420
233208
228768
229704
223464
242952
249108
243816
234072
244668
233208
243816
242952
245604
235860
246456
245604
261504
257916
243816
236712
246456
233208
242952
244668
248256
240312
244668
247320
257064
249108
238512
227052
237660
208500
222612
230556
238512
227052
227052
227052
233208
224412
212868
203208
210216
182856
199620
209364
211152
201408
202260
199620
208500
202260
189960
181068
196104
163452
184656
194316
194316
182856
172260
171408
181068
172260
155508
143964
156360
127212
153708
167808
172260
162516
150204
159012
162516
159864
133356
121056
129852
103356
130716
140460
148404
135156
122760
129852
133356
126348
99852
88308
98904
69756
101556
121056


Summary of computational transaction
Raw Input view raw input (R code)
Raw Outputview raw output of R engine
Computing time1 seconds
R ServerBig Analytics Cloud Computing Center

\begin{tabular}{lllllllll}
\hline
Summary of computational transaction \tabularnewline
Raw Input view raw input (R code)  \tabularnewline
Raw Outputview raw output of R engine  \tabularnewline
Computing time1 seconds \tabularnewline
R ServerBig Analytics Cloud Computing Center \tabularnewline
\hline
\end{tabular}
%Source: https://freestatistics.org/blog/index.php?pk=307167&T=0

[TABLE]
[ROW]
Summary of computational transaction[/C][/ROW] [ROW]Raw Input[/C] view raw input (R code) [/C][/ROW] [ROW]Raw Output[/C]view raw output of R engine [/C][/ROW] [ROW]Computing time[/C]1 seconds[/C][/ROW] [ROW]R Server[/C]Big Analytics Cloud Computing Center[/C][/ROW] [/TABLE] Source: https://freestatistics.org/blog/index.php?pk=307167&T=0

Globally Unique Identifier (entire table): ba.freestatistics.org/blog/index.php?pk=307167&T=0

As an alternative you can also use a QR Code:  

The GUIDs for individual cells are displayed in the table below:

Summary of computational transaction
Raw Input view raw input (R code)
Raw Outputview raw output of R engine
Computing time1 seconds
R ServerBig Analytics Cloud Computing Center


Boxplot statistics
Variablelower whiskerlower hingemedianupper hingeupper whisker
A69756169608222186236286261504

\begin{tabular}{lllllllll}
\hline
Boxplot statistics \tabularnewline
Variable & lower whisker & lower hinge & median & upper hinge & upper whisker \tabularnewline
A & 69756 & 169608 & 222186 & 236286 & 261504 \tabularnewline
\hline
\end{tabular}
%Source: https://freestatistics.org/blog/index.php?pk=307167&T=1

[TABLE]
[ROW][C]Boxplot statistics[/C][/ROW]
[ROW][C]Variable[/C][C]lower whisker[/C][C]lower hinge[/C][C]median[/C][C]upper hinge[/C][C]upper whisker[/C][/ROW]
[ROW][C]A[/C][C]69756[/C][C]169608[/C][C]222186[/C][C]236286[/C][C]261504[/C][/ROW]
[/TABLE]
Source: https://freestatistics.org/blog/index.php?pk=307167&T=1

Globally Unique Identifier (entire table): ba.freestatistics.org/blog/index.php?pk=307167&T=1

As an alternative you can also use a QR Code:  

The GUIDs for individual cells are displayed in the table below:

Boxplot statistics
Variablelower whiskerlower hingemedianupper hingeupper whisker
A69756169608222186236286261504


Boxplot Notches
Variablelower boundmedianupper bound
A212568.791565143222186231803.208434857

\begin{tabular}{lllllllll}
\hline
Boxplot Notches \tabularnewline
Variable & lower bound & median & upper bound \tabularnewline
A & 212568.791565143 & 222186 & 231803.208434857 \tabularnewline
\hline
\end{tabular}
%Source: https://freestatistics.org/blog/index.php?pk=307167&T=2

[TABLE]
[ROW][C]Boxplot Notches[/C][/ROW]
[ROW][C]Variable[/C][C]lower bound[/C][C]median[/C][C]upper bound[/C][/ROW]
[ROW][C]A[/C][C]212568.791565143[/C][C]222186[/C][C]231803.208434857[/C][/ROW]
[/TABLE]
Source: https://freestatistics.org/blog/index.php?pk=307167&T=2

Globally Unique Identifier (entire table): ba.freestatistics.org/blog/index.php?pk=307167&T=2

As an alternative you can also use a QR Code:  

The GUIDs for individual cells are displayed in the table below:

Boxplot Notches
Variablelower boundmedianupper bound
A212568.791565143222186231803.208434857


Parameters (Session):
par1 = grey ; par2 = no ;
Parameters (R input):
par1 = grey ; par2 = no ;
R code (references can be found in the software module):
par2 <- 'yes'
par1 <- 'grey'
if(par2=='yes') {
z <- na.omit(as.data.frame(t(y)))
} else {
z <- as.data.frame(t(y))
}
bitmap(file='test1.png')
(r<-boxplot(z ,xlab=xlab,ylab=ylab,main=main,notch=TRUE,col=par1))
dev.off()
load(file='createtable')
a<-table.start()
a<-table.row.start(a)
a<-table.element(a,'Boxplot statistics',6,TRUE)
a<-table.row.end(a)
a<-table.row.start(a)
a<-table.element(a,'Variable',1,TRUE)
a<-table.element(a,'lower whisker',1,TRUE)
a<-table.element(a,'lower hinge',1,TRUE)
a<-table.element(a,'median',1,TRUE)
a<-table.element(a,'upper hinge',1,TRUE)
a<-table.element(a,'upper whisker',1,TRUE)
a<-table.row.end(a)
for (i in 1:length(y[,1]))
{
a<-table.row.start(a)
a<-table.element(a,dimnames(t(x))[[2]][i],1,TRUE)
for (j in 1:5)
{
a<-table.element(a,r$stats[j,i])
}
a<-table.row.end(a)
}
a<-table.end(a)
table.save(a,file='mytable.tab')
a<-table.start()
a<-table.row.start(a)
a<-table.element(a,'Boxplot Notches',4,TRUE)
a<-table.row.end(a)
a<-table.row.start(a)
a<-table.element(a,'Variable',1,TRUE)
a<-table.element(a,'lower bound',1,TRUE)
a<-table.element(a,'median',1,TRUE)
a<-table.element(a,'upper bound',1,TRUE)
a<-table.row.end(a)
for (i in 1:length(y[,1]))
{
a<-table.row.start(a)
a<-table.element(a,dimnames(t(x))[[2]][i],1,TRUE)
a<-table.element(a,r$conf[1,i])
a<-table.element(a,r$stats[3,i])
a<-table.element(a,r$conf[2,i])
a<-table.row.end(a)
}
a<-table.end(a)
table.save(a,file='mytable1.tab')