Free Statistics

of Irreproducible Research!

Author's title

Author*Unverified author*
R Software Modulerwasp_autocorrelation.wasp
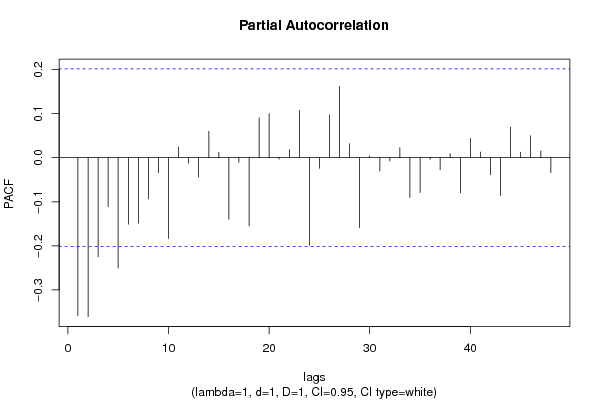
Title produced by software(Partial) Autocorrelation Function
Date of computationSun, 13 Aug 2017 13:24:13 +0200
Cite this page as followsStatistical Computations at FreeStatistics.org, Office for Research Development and Education, URL https://freestatistics.org/blog/index.php?v=date/2017/Aug/13/t1502623479gorverrrdwfvthy.htm/, Retrieved Fri, 10 May 2024 11:34:52 +0000
Statistical Computations at FreeStatistics.org, Office for Research Development and Education, URL https://freestatistics.org/blog/index.php?pk=307175, Retrieved Fri, 10 May 2024 11:34:52 +0000
QR Codes:

Original text written by user:
IsPrivate?No (this computation is public)
User-defined keywords
Estimated Impact115
Family? (F = Feedback message, R = changed R code, M = changed R Module, P = changed Parameters, D = changed Data)
-       [(Partial) Autocorrelation Function] [] [2017-08-13 11:24:13] [270a72b021b4bbf70c885af1fd2608d6] [Current]
Feedback Forum

Post a new message
Dataseries X:
14741900
14195900
15014900
12011900
15560900
15287900
16379900
16925900
18836900
16379900
15560900
19382900
16379900
12284900
14468900
10919900
15287900
12557900
16652900
15014900
15833900
17744900
17471900
20747900
15014900
12557900
13922900
10100900
14468900
11192900
15833900
15014900
13376900
19109900
17198900
19655900
14741900
13649900
12284900
10100900
13376900
12011900
16379900
15833900
13649900
18290900
16925900
21839900
17471900
10646900
10646900
10646900
12557900
12557900
16925900
15560900
13922900
17471900
16106900
23204900
18290900
10646900
11192900
9281900
12830900
14741900
18563900
18290900
14741900
17198900
15287900
21839900
16652900
13376900
12011900
9008900
13376900
16106900
18836900
17744900
13103900
18836900
14741900
22658900
18836900
13649900
12557900
8462900
13376900
12830900
19382900
19382900
14741900
19109900
14195900
22112900
18836900
13922900
10646900
7370900
14468900
13922900
18290900
21020900
15560900
17471900
13103900
22658900


Summary of computational transaction
Raw Input view raw input (R code)
Raw Outputview raw output of R engine
Computing time2 seconds
R ServerBig Analytics Cloud Computing Center

\begin{tabular}{lllllllll}
\hline
Summary of computational transaction \tabularnewline
Raw Input view raw input (R code)  \tabularnewline
Raw Outputview raw output of R engine  \tabularnewline
Computing time2 seconds \tabularnewline
R ServerBig Analytics Cloud Computing Center \tabularnewline
\hline
\end{tabular}
%Source: https://freestatistics.org/blog/index.php?pk=307175&T=0

[TABLE]
[ROW]
Summary of computational transaction[/C][/ROW] [ROW]Raw Input[/C] view raw input (R code) [/C][/ROW] [ROW]Raw Output[/C]view raw output of R engine [/C][/ROW] [ROW]Computing time[/C]2 seconds[/C][/ROW] [ROW]R Server[/C]Big Analytics Cloud Computing Center[/C][/ROW] [/TABLE] Source: https://freestatistics.org/blog/index.php?pk=307175&T=0

Globally Unique Identifier (entire table): ba.freestatistics.org/blog/index.php?pk=307175&T=0

As an alternative you can also use a QR Code:  

The GUIDs for individual cells are displayed in the table below:

Summary of computational transaction
Raw Input view raw input (R code)
Raw Outputview raw output of R engine
Computing time2 seconds
R ServerBig Analytics Cloud Computing Center


Autocorrelation Function
Time lag kACF(k)T-STATP-value
1-0.358012-3.48950.000368
2-0.186126-1.81410.036407
30.0491320.47890.316562
40.0602820.58760.279112
5-0.14613-1.42430.078818
60.0716370.69820.243369
70.020430.19910.421296
80.0079980.0780.469012
90.0127550.12430.45066
10-0.10017-0.97630.165688
110.140931.37360.086397
12-0.036398-0.35480.361778
13-0.067433-0.65730.256302
140.0741110.72230.235927
15-0.005116-0.04990.480167
16-0.156015-1.52060.065835
170.1462561.42550.078641
18-0.05833-0.56850.285507
190.1154571.12530.13164
20-0.004148-0.04040.483918
21-0.103365-1.00750.158132
22-0.002467-0.0240.490435
230.1197931.16760.122946
24-0.259643-2.53070.006514
250.1585061.54490.062845
260.1619141.57810.058928
27-0.091505-0.89190.187354
28-0.116944-1.13980.128612
29-0.024068-0.23460.407516
300.1221741.19080.118349
31-0.028767-0.28040.389897
32-0.014158-0.1380.445267
33-0.001934-0.01890.492499
340.0283470.27630.391463
35-0.121326-1.18250.119971
360.1165321.13580.129445
370.0464020.45230.326052
38-0.063396-0.61790.269056
39-0.047828-0.46620.321079
400.1247521.21590.113513
41-0.123371-1.20250.116085
42-0.000204-0.0020.49921
43-0.017343-0.1690.433064
440.1520551.48210.070818
45-0.030692-0.29920.382739
46-0.067385-0.65680.256452
47-0.027793-0.27090.393531
480.0262650.2560.399254

\begin{tabular}{lllllllll}
\hline
Autocorrelation Function \tabularnewline
Time lag k & ACF(k) & T-STAT & P-value \tabularnewline
1 & -0.358012 & -3.4895 & 0.000368 \tabularnewline
2 & -0.186126 & -1.8141 & 0.036407 \tabularnewline
3 & 0.049132 & 0.4789 & 0.316562 \tabularnewline
4 & 0.060282 & 0.5876 & 0.279112 \tabularnewline
5 & -0.14613 & -1.4243 & 0.078818 \tabularnewline
6 & 0.071637 & 0.6982 & 0.243369 \tabularnewline
7 & 0.02043 & 0.1991 & 0.421296 \tabularnewline
8 & 0.007998 & 0.078 & 0.469012 \tabularnewline
9 & 0.012755 & 0.1243 & 0.45066 \tabularnewline
10 & -0.10017 & -0.9763 & 0.165688 \tabularnewline
11 & 0.14093 & 1.3736 & 0.086397 \tabularnewline
12 & -0.036398 & -0.3548 & 0.361778 \tabularnewline
13 & -0.067433 & -0.6573 & 0.256302 \tabularnewline
14 & 0.074111 & 0.7223 & 0.235927 \tabularnewline
15 & -0.005116 & -0.0499 & 0.480167 \tabularnewline
16 & -0.156015 & -1.5206 & 0.065835 \tabularnewline
17 & 0.146256 & 1.4255 & 0.078641 \tabularnewline
18 & -0.05833 & -0.5685 & 0.285507 \tabularnewline
19 & 0.115457 & 1.1253 & 0.13164 \tabularnewline
20 & -0.004148 & -0.0404 & 0.483918 \tabularnewline
21 & -0.103365 & -1.0075 & 0.158132 \tabularnewline
22 & -0.002467 & -0.024 & 0.490435 \tabularnewline
23 & 0.119793 & 1.1676 & 0.122946 \tabularnewline
24 & -0.259643 & -2.5307 & 0.006514 \tabularnewline
25 & 0.158506 & 1.5449 & 0.062845 \tabularnewline
26 & 0.161914 & 1.5781 & 0.058928 \tabularnewline
27 & -0.091505 & -0.8919 & 0.187354 \tabularnewline
28 & -0.116944 & -1.1398 & 0.128612 \tabularnewline
29 & -0.024068 & -0.2346 & 0.407516 \tabularnewline
30 & 0.122174 & 1.1908 & 0.118349 \tabularnewline
31 & -0.028767 & -0.2804 & 0.389897 \tabularnewline
32 & -0.014158 & -0.138 & 0.445267 \tabularnewline
33 & -0.001934 & -0.0189 & 0.492499 \tabularnewline
34 & 0.028347 & 0.2763 & 0.391463 \tabularnewline
35 & -0.121326 & -1.1825 & 0.119971 \tabularnewline
36 & 0.116532 & 1.1358 & 0.129445 \tabularnewline
37 & 0.046402 & 0.4523 & 0.326052 \tabularnewline
38 & -0.063396 & -0.6179 & 0.269056 \tabularnewline
39 & -0.047828 & -0.4662 & 0.321079 \tabularnewline
40 & 0.124752 & 1.2159 & 0.113513 \tabularnewline
41 & -0.123371 & -1.2025 & 0.116085 \tabularnewline
42 & -0.000204 & -0.002 & 0.49921 \tabularnewline
43 & -0.017343 & -0.169 & 0.433064 \tabularnewline
44 & 0.152055 & 1.4821 & 0.070818 \tabularnewline
45 & -0.030692 & -0.2992 & 0.382739 \tabularnewline
46 & -0.067385 & -0.6568 & 0.256452 \tabularnewline
47 & -0.027793 & -0.2709 & 0.393531 \tabularnewline
48 & 0.026265 & 0.256 & 0.399254 \tabularnewline
\hline
\end{tabular}
%Source: https://freestatistics.org/blog/index.php?pk=307175&T=1

[TABLE]
[ROW][C]Autocorrelation Function[/C][/ROW]
[ROW][C]Time lag k[/C][C]ACF(k)[/C][C]T-STAT[/C][C]P-value[/C][/ROW]
[ROW][C]1[/C][C]-0.358012[/C][C]-3.4895[/C][C]0.000368[/C][/ROW]
[ROW][C]2[/C][C]-0.186126[/C][C]-1.8141[/C][C]0.036407[/C][/ROW]
[ROW][C]3[/C][C]0.049132[/C][C]0.4789[/C][C]0.316562[/C][/ROW]
[ROW][C]4[/C][C]0.060282[/C][C]0.5876[/C][C]0.279112[/C][/ROW]
[ROW][C]5[/C][C]-0.14613[/C][C]-1.4243[/C][C]0.078818[/C][/ROW]
[ROW][C]6[/C][C]0.071637[/C][C]0.6982[/C][C]0.243369[/C][/ROW]
[ROW][C]7[/C][C]0.02043[/C][C]0.1991[/C][C]0.421296[/C][/ROW]
[ROW][C]8[/C][C]0.007998[/C][C]0.078[/C][C]0.469012[/C][/ROW]
[ROW][C]9[/C][C]0.012755[/C][C]0.1243[/C][C]0.45066[/C][/ROW]
[ROW][C]10[/C][C]-0.10017[/C][C]-0.9763[/C][C]0.165688[/C][/ROW]
[ROW][C]11[/C][C]0.14093[/C][C]1.3736[/C][C]0.086397[/C][/ROW]
[ROW][C]12[/C][C]-0.036398[/C][C]-0.3548[/C][C]0.361778[/C][/ROW]
[ROW][C]13[/C][C]-0.067433[/C][C]-0.6573[/C][C]0.256302[/C][/ROW]
[ROW][C]14[/C][C]0.074111[/C][C]0.7223[/C][C]0.235927[/C][/ROW]
[ROW][C]15[/C][C]-0.005116[/C][C]-0.0499[/C][C]0.480167[/C][/ROW]
[ROW][C]16[/C][C]-0.156015[/C][C]-1.5206[/C][C]0.065835[/C][/ROW]
[ROW][C]17[/C][C]0.146256[/C][C]1.4255[/C][C]0.078641[/C][/ROW]
[ROW][C]18[/C][C]-0.05833[/C][C]-0.5685[/C][C]0.285507[/C][/ROW]
[ROW][C]19[/C][C]0.115457[/C][C]1.1253[/C][C]0.13164[/C][/ROW]
[ROW][C]20[/C][C]-0.004148[/C][C]-0.0404[/C][C]0.483918[/C][/ROW]
[ROW][C]21[/C][C]-0.103365[/C][C]-1.0075[/C][C]0.158132[/C][/ROW]
[ROW][C]22[/C][C]-0.002467[/C][C]-0.024[/C][C]0.490435[/C][/ROW]
[ROW][C]23[/C][C]0.119793[/C][C]1.1676[/C][C]0.122946[/C][/ROW]
[ROW][C]24[/C][C]-0.259643[/C][C]-2.5307[/C][C]0.006514[/C][/ROW]
[ROW][C]25[/C][C]0.158506[/C][C]1.5449[/C][C]0.062845[/C][/ROW]
[ROW][C]26[/C][C]0.161914[/C][C]1.5781[/C][C]0.058928[/C][/ROW]
[ROW][C]27[/C][C]-0.091505[/C][C]-0.8919[/C][C]0.187354[/C][/ROW]
[ROW][C]28[/C][C]-0.116944[/C][C]-1.1398[/C][C]0.128612[/C][/ROW]
[ROW][C]29[/C][C]-0.024068[/C][C]-0.2346[/C][C]0.407516[/C][/ROW]
[ROW][C]30[/C][C]0.122174[/C][C]1.1908[/C][C]0.118349[/C][/ROW]
[ROW][C]31[/C][C]-0.028767[/C][C]-0.2804[/C][C]0.389897[/C][/ROW]
[ROW][C]32[/C][C]-0.014158[/C][C]-0.138[/C][C]0.445267[/C][/ROW]
[ROW][C]33[/C][C]-0.001934[/C][C]-0.0189[/C][C]0.492499[/C][/ROW]
[ROW][C]34[/C][C]0.028347[/C][C]0.2763[/C][C]0.391463[/C][/ROW]
[ROW][C]35[/C][C]-0.121326[/C][C]-1.1825[/C][C]0.119971[/C][/ROW]
[ROW][C]36[/C][C]0.116532[/C][C]1.1358[/C][C]0.129445[/C][/ROW]
[ROW][C]37[/C][C]0.046402[/C][C]0.4523[/C][C]0.326052[/C][/ROW]
[ROW][C]38[/C][C]-0.063396[/C][C]-0.6179[/C][C]0.269056[/C][/ROW]
[ROW][C]39[/C][C]-0.047828[/C][C]-0.4662[/C][C]0.321079[/C][/ROW]
[ROW][C]40[/C][C]0.124752[/C][C]1.2159[/C][C]0.113513[/C][/ROW]
[ROW][C]41[/C][C]-0.123371[/C][C]-1.2025[/C][C]0.116085[/C][/ROW]
[ROW][C]42[/C][C]-0.000204[/C][C]-0.002[/C][C]0.49921[/C][/ROW]
[ROW][C]43[/C][C]-0.017343[/C][C]-0.169[/C][C]0.433064[/C][/ROW]
[ROW][C]44[/C][C]0.152055[/C][C]1.4821[/C][C]0.070818[/C][/ROW]
[ROW][C]45[/C][C]-0.030692[/C][C]-0.2992[/C][C]0.382739[/C][/ROW]
[ROW][C]46[/C][C]-0.067385[/C][C]-0.6568[/C][C]0.256452[/C][/ROW]
[ROW][C]47[/C][C]-0.027793[/C][C]-0.2709[/C][C]0.393531[/C][/ROW]
[ROW][C]48[/C][C]0.026265[/C][C]0.256[/C][C]0.399254[/C][/ROW]
[/TABLE]
Source: https://freestatistics.org/blog/index.php?pk=307175&T=1

Globally Unique Identifier (entire table): ba.freestatistics.org/blog/index.php?pk=307175&T=1

As an alternative you can also use a QR Code:  

The GUIDs for individual cells are displayed in the table below:

Autocorrelation Function
Time lag kACF(k)T-STATP-value
1-0.358012-3.48950.000368
2-0.186126-1.81410.036407
30.0491320.47890.316562
40.0602820.58760.279112
5-0.14613-1.42430.078818
60.0716370.69820.243369
70.020430.19910.421296
80.0079980.0780.469012
90.0127550.12430.45066
10-0.10017-0.97630.165688
110.140931.37360.086397
12-0.036398-0.35480.361778
13-0.067433-0.65730.256302
140.0741110.72230.235927
15-0.005116-0.04990.480167
16-0.156015-1.52060.065835
170.1462561.42550.078641
18-0.05833-0.56850.285507
190.1154571.12530.13164
20-0.004148-0.04040.483918
21-0.103365-1.00750.158132
22-0.002467-0.0240.490435
230.1197931.16760.122946
24-0.259643-2.53070.006514
250.1585061.54490.062845
260.1619141.57810.058928
27-0.091505-0.89190.187354
28-0.116944-1.13980.128612
29-0.024068-0.23460.407516
300.1221741.19080.118349
31-0.028767-0.28040.389897
32-0.014158-0.1380.445267
33-0.001934-0.01890.492499
340.0283470.27630.391463
35-0.121326-1.18250.119971
360.1165321.13580.129445
370.0464020.45230.326052
38-0.063396-0.61790.269056
39-0.047828-0.46620.321079
400.1247521.21590.113513
41-0.123371-1.20250.116085
42-0.000204-0.0020.49921
43-0.017343-0.1690.433064
440.1520551.48210.070818
45-0.030692-0.29920.382739
46-0.067385-0.65680.256452
47-0.027793-0.27090.393531
480.0262650.2560.399254


Partial Autocorrelation Function
Time lag kPACF(k)T-STATP-value
1-0.358012-3.48950.000368
2-0.360505-3.51380.000339
3-0.224898-2.1920.01541
4-0.11082-1.08010.141407
5-0.250211-2.43880.008298
6-0.150764-1.46950.072505
7-0.148443-1.44680.075617
8-0.093473-0.91110.182284
9-0.033938-0.33080.370768
10-0.182829-1.7820.038972
110.0237980.2320.408536
12-0.012375-0.12060.452123
13-0.043805-0.4270.335188
140.0598240.58310.280606
150.0116370.11340.454969
16-0.139606-1.36070.088412
17-0.010355-0.10090.45991
18-0.154784-1.50860.067354
190.0901640.87880.190861
200.0995380.97020.16721
21-0.003305-0.03220.487185
220.0185880.18120.428308
230.1072051.04490.149359
24-0.198681-1.93650.027889
25-0.024248-0.23630.406838
260.0966750.94230.174222
270.1611961.57110.059736
280.0318180.31010.378573
29-0.158826-1.5480.062468
300.0038130.03720.485216
31-0.030161-0.2940.384712
32-0.007746-0.07550.469988
330.022610.22040.413026
34-0.090346-0.88060.190382
35-0.079222-0.77220.220968
36-0.003636-0.03540.485902
37-0.027313-0.26620.395327
380.0087030.08480.466289
39-0.079872-0.77850.219106
400.0436740.42570.33565
410.0125430.12230.451478
42-0.038635-0.37660.353669
43-0.086492-0.8430.200667
440.0689720.67230.251527
450.0122870.11980.452465
460.0496990.48440.314606
470.0153180.14930.440815
48-0.033915-0.33060.370851

\begin{tabular}{lllllllll}
\hline
Partial Autocorrelation Function \tabularnewline
Time lag k & PACF(k) & T-STAT & P-value \tabularnewline
1 & -0.358012 & -3.4895 & 0.000368 \tabularnewline
2 & -0.360505 & -3.5138 & 0.000339 \tabularnewline
3 & -0.224898 & -2.192 & 0.01541 \tabularnewline
4 & -0.11082 & -1.0801 & 0.141407 \tabularnewline
5 & -0.250211 & -2.4388 & 0.008298 \tabularnewline
6 & -0.150764 & -1.4695 & 0.072505 \tabularnewline
7 & -0.148443 & -1.4468 & 0.075617 \tabularnewline
8 & -0.093473 & -0.9111 & 0.182284 \tabularnewline
9 & -0.033938 & -0.3308 & 0.370768 \tabularnewline
10 & -0.182829 & -1.782 & 0.038972 \tabularnewline
11 & 0.023798 & 0.232 & 0.408536 \tabularnewline
12 & -0.012375 & -0.1206 & 0.452123 \tabularnewline
13 & -0.043805 & -0.427 & 0.335188 \tabularnewline
14 & 0.059824 & 0.5831 & 0.280606 \tabularnewline
15 & 0.011637 & 0.1134 & 0.454969 \tabularnewline
16 & -0.139606 & -1.3607 & 0.088412 \tabularnewline
17 & -0.010355 & -0.1009 & 0.45991 \tabularnewline
18 & -0.154784 & -1.5086 & 0.067354 \tabularnewline
19 & 0.090164 & 0.8788 & 0.190861 \tabularnewline
20 & 0.099538 & 0.9702 & 0.16721 \tabularnewline
21 & -0.003305 & -0.0322 & 0.487185 \tabularnewline
22 & 0.018588 & 0.1812 & 0.428308 \tabularnewline
23 & 0.107205 & 1.0449 & 0.149359 \tabularnewline
24 & -0.198681 & -1.9365 & 0.027889 \tabularnewline
25 & -0.024248 & -0.2363 & 0.406838 \tabularnewline
26 & 0.096675 & 0.9423 & 0.174222 \tabularnewline
27 & 0.161196 & 1.5711 & 0.059736 \tabularnewline
28 & 0.031818 & 0.3101 & 0.378573 \tabularnewline
29 & -0.158826 & -1.548 & 0.062468 \tabularnewline
30 & 0.003813 & 0.0372 & 0.485216 \tabularnewline
31 & -0.030161 & -0.294 & 0.384712 \tabularnewline
32 & -0.007746 & -0.0755 & 0.469988 \tabularnewline
33 & 0.02261 & 0.2204 & 0.413026 \tabularnewline
34 & -0.090346 & -0.8806 & 0.190382 \tabularnewline
35 & -0.079222 & -0.7722 & 0.220968 \tabularnewline
36 & -0.003636 & -0.0354 & 0.485902 \tabularnewline
37 & -0.027313 & -0.2662 & 0.395327 \tabularnewline
38 & 0.008703 & 0.0848 & 0.466289 \tabularnewline
39 & -0.079872 & -0.7785 & 0.219106 \tabularnewline
40 & 0.043674 & 0.4257 & 0.33565 \tabularnewline
41 & 0.012543 & 0.1223 & 0.451478 \tabularnewline
42 & -0.038635 & -0.3766 & 0.353669 \tabularnewline
43 & -0.086492 & -0.843 & 0.200667 \tabularnewline
44 & 0.068972 & 0.6723 & 0.251527 \tabularnewline
45 & 0.012287 & 0.1198 & 0.452465 \tabularnewline
46 & 0.049699 & 0.4844 & 0.314606 \tabularnewline
47 & 0.015318 & 0.1493 & 0.440815 \tabularnewline
48 & -0.033915 & -0.3306 & 0.370851 \tabularnewline
\hline
\end{tabular}
%Source: https://freestatistics.org/blog/index.php?pk=307175&T=2

[TABLE]
[ROW][C]Partial Autocorrelation Function[/C][/ROW]
[ROW][C]Time lag k[/C][C]PACF(k)[/C][C]T-STAT[/C][C]P-value[/C][/ROW]
[ROW][C]1[/C][C]-0.358012[/C][C]-3.4895[/C][C]0.000368[/C][/ROW]
[ROW][C]2[/C][C]-0.360505[/C][C]-3.5138[/C][C]0.000339[/C][/ROW]
[ROW][C]3[/C][C]-0.224898[/C][C]-2.192[/C][C]0.01541[/C][/ROW]
[ROW][C]4[/C][C]-0.11082[/C][C]-1.0801[/C][C]0.141407[/C][/ROW]
[ROW][C]5[/C][C]-0.250211[/C][C]-2.4388[/C][C]0.008298[/C][/ROW]
[ROW][C]6[/C][C]-0.150764[/C][C]-1.4695[/C][C]0.072505[/C][/ROW]
[ROW][C]7[/C][C]-0.148443[/C][C]-1.4468[/C][C]0.075617[/C][/ROW]
[ROW][C]8[/C][C]-0.093473[/C][C]-0.9111[/C][C]0.182284[/C][/ROW]
[ROW][C]9[/C][C]-0.033938[/C][C]-0.3308[/C][C]0.370768[/C][/ROW]
[ROW][C]10[/C][C]-0.182829[/C][C]-1.782[/C][C]0.038972[/C][/ROW]
[ROW][C]11[/C][C]0.023798[/C][C]0.232[/C][C]0.408536[/C][/ROW]
[ROW][C]12[/C][C]-0.012375[/C][C]-0.1206[/C][C]0.452123[/C][/ROW]
[ROW][C]13[/C][C]-0.043805[/C][C]-0.427[/C][C]0.335188[/C][/ROW]
[ROW][C]14[/C][C]0.059824[/C][C]0.5831[/C][C]0.280606[/C][/ROW]
[ROW][C]15[/C][C]0.011637[/C][C]0.1134[/C][C]0.454969[/C][/ROW]
[ROW][C]16[/C][C]-0.139606[/C][C]-1.3607[/C][C]0.088412[/C][/ROW]
[ROW][C]17[/C][C]-0.010355[/C][C]-0.1009[/C][C]0.45991[/C][/ROW]
[ROW][C]18[/C][C]-0.154784[/C][C]-1.5086[/C][C]0.067354[/C][/ROW]
[ROW][C]19[/C][C]0.090164[/C][C]0.8788[/C][C]0.190861[/C][/ROW]
[ROW][C]20[/C][C]0.099538[/C][C]0.9702[/C][C]0.16721[/C][/ROW]
[ROW][C]21[/C][C]-0.003305[/C][C]-0.0322[/C][C]0.487185[/C][/ROW]
[ROW][C]22[/C][C]0.018588[/C][C]0.1812[/C][C]0.428308[/C][/ROW]
[ROW][C]23[/C][C]0.107205[/C][C]1.0449[/C][C]0.149359[/C][/ROW]
[ROW][C]24[/C][C]-0.198681[/C][C]-1.9365[/C][C]0.027889[/C][/ROW]
[ROW][C]25[/C][C]-0.024248[/C][C]-0.2363[/C][C]0.406838[/C][/ROW]
[ROW][C]26[/C][C]0.096675[/C][C]0.9423[/C][C]0.174222[/C][/ROW]
[ROW][C]27[/C][C]0.161196[/C][C]1.5711[/C][C]0.059736[/C][/ROW]
[ROW][C]28[/C][C]0.031818[/C][C]0.3101[/C][C]0.378573[/C][/ROW]
[ROW][C]29[/C][C]-0.158826[/C][C]-1.548[/C][C]0.062468[/C][/ROW]
[ROW][C]30[/C][C]0.003813[/C][C]0.0372[/C][C]0.485216[/C][/ROW]
[ROW][C]31[/C][C]-0.030161[/C][C]-0.294[/C][C]0.384712[/C][/ROW]
[ROW][C]32[/C][C]-0.007746[/C][C]-0.0755[/C][C]0.469988[/C][/ROW]
[ROW][C]33[/C][C]0.02261[/C][C]0.2204[/C][C]0.413026[/C][/ROW]
[ROW][C]34[/C][C]-0.090346[/C][C]-0.8806[/C][C]0.190382[/C][/ROW]
[ROW][C]35[/C][C]-0.079222[/C][C]-0.7722[/C][C]0.220968[/C][/ROW]
[ROW][C]36[/C][C]-0.003636[/C][C]-0.0354[/C][C]0.485902[/C][/ROW]
[ROW][C]37[/C][C]-0.027313[/C][C]-0.2662[/C][C]0.395327[/C][/ROW]
[ROW][C]38[/C][C]0.008703[/C][C]0.0848[/C][C]0.466289[/C][/ROW]
[ROW][C]39[/C][C]-0.079872[/C][C]-0.7785[/C][C]0.219106[/C][/ROW]
[ROW][C]40[/C][C]0.043674[/C][C]0.4257[/C][C]0.33565[/C][/ROW]
[ROW][C]41[/C][C]0.012543[/C][C]0.1223[/C][C]0.451478[/C][/ROW]
[ROW][C]42[/C][C]-0.038635[/C][C]-0.3766[/C][C]0.353669[/C][/ROW]
[ROW][C]43[/C][C]-0.086492[/C][C]-0.843[/C][C]0.200667[/C][/ROW]
[ROW][C]44[/C][C]0.068972[/C][C]0.6723[/C][C]0.251527[/C][/ROW]
[ROW][C]45[/C][C]0.012287[/C][C]0.1198[/C][C]0.452465[/C][/ROW]
[ROW][C]46[/C][C]0.049699[/C][C]0.4844[/C][C]0.314606[/C][/ROW]
[ROW][C]47[/C][C]0.015318[/C][C]0.1493[/C][C]0.440815[/C][/ROW]
[ROW][C]48[/C][C]-0.033915[/C][C]-0.3306[/C][C]0.370851[/C][/ROW]
[/TABLE]
Source: https://freestatistics.org/blog/index.php?pk=307175&T=2

Globally Unique Identifier (entire table): ba.freestatistics.org/blog/index.php?pk=307175&T=2

As an alternative you can also use a QR Code:  

The GUIDs for individual cells are displayed in the table below:

Partial Autocorrelation Function
Time lag kPACF(k)T-STATP-value
1-0.358012-3.48950.000368
2-0.360505-3.51380.000339
3-0.224898-2.1920.01541
4-0.11082-1.08010.141407
5-0.250211-2.43880.008298
6-0.150764-1.46950.072505
7-0.148443-1.44680.075617
8-0.093473-0.91110.182284
9-0.033938-0.33080.370768
10-0.182829-1.7820.038972
110.0237980.2320.408536
12-0.012375-0.12060.452123
13-0.043805-0.4270.335188
140.0598240.58310.280606
150.0116370.11340.454969
16-0.139606-1.36070.088412
17-0.010355-0.10090.45991
18-0.154784-1.50860.067354
190.0901640.87880.190861
200.0995380.97020.16721
21-0.003305-0.03220.487185
220.0185880.18120.428308
230.1072051.04490.149359
24-0.198681-1.93650.027889
25-0.024248-0.23630.406838
260.0966750.94230.174222
270.1611961.57110.059736
280.0318180.31010.378573
29-0.158826-1.5480.062468
300.0038130.03720.485216
31-0.030161-0.2940.384712
32-0.007746-0.07550.469988
330.022610.22040.413026
34-0.090346-0.88060.190382
35-0.079222-0.77220.220968
36-0.003636-0.03540.485902
37-0.027313-0.26620.395327
380.0087030.08480.466289
39-0.079872-0.77850.219106
400.0436740.42570.33565
410.0125430.12230.451478
42-0.038635-0.37660.353669
43-0.086492-0.8430.200667
440.0689720.67230.251527
450.0122870.11980.452465
460.0496990.48440.314606
470.0153180.14930.440815
48-0.033915-0.33060.370851


Parameters (Session):
Parameters (R input):
par1 = 48 ; par2 = 1 ; par3 = 1 ; par4 = 1 ; par5 = 12 ; par6 = White Noise ; par7 = 0.95 ; par8 = ;
R code (references can be found in the software module):
par8 <- ''
par7 <- '0.95'
par6 <- 'White Noise'
par5 <- '12'
par4 <- '0'
par3 <- '0'
par2 <- '1'
par1 <- '48'
if (par1 == 'Default') {
par1 = 10*log10(length(x))
} else {
par1 <- as.numeric(par1)
}
par2 <- as.numeric(par2)
par3 <- as.numeric(par3)
par4 <- as.numeric(par4)
par5 <- as.numeric(par5)
if (par6 == 'White Noise') par6 <- 'white' else par6 <- 'ma'
par7 <- as.numeric(par7)
if (par8 != '') par8 <- as.numeric(par8)
x <- na.omit(x)
ox <- x
if (par8 == '') {
if (par2 == 0) {
x <- log(x)
} else {
x <- (x ^ par2 - 1) / par2
}
} else {
x <- log(x,base=par8)
}
if (par3 > 0) x <- diff(x,lag=1,difference=par3)
if (par4 > 0) x <- diff(x,lag=par5,difference=par4)
bitmap(file='picts.png')
op <- par(mfrow=c(2,1))
plot(ox,type='l',main='Original Time Series',xlab='time',ylab='value')
if (par8=='') {
mytitle <- paste('Working Time Series (lambda=',par2,', d=',par3,', D=',par4,')',sep='')
mysub <- paste('(lambda=',par2,', d=',par3,', D=',par4,', CI=', par7, ', CI type=',par6,')',sep='')
} else {
mytitle <- paste('Working Time Series (base=',par8,', d=',par3,', D=',par4,')',sep='')
mysub <- paste('(base=',par8,', d=',par3,', D=',par4,', CI=', par7, ', CI type=',par6,')',sep='')
}
plot(x,type='l', main=mytitle,xlab='time',ylab='value')
par(op)
dev.off()
bitmap(file='pic1.png')
racf <- acf(x, par1, main='Autocorrelation', xlab='time lag', ylab='ACF', ci.type=par6, ci=par7, sub=mysub)
dev.off()
bitmap(file='pic2.png')
rpacf <- pacf(x,par1,main='Partial Autocorrelation',xlab='lags',ylab='PACF',sub=mysub)
dev.off()
(myacf <- c(racf$acf))
(mypacf <- c(rpacf$acf))
lengthx <- length(x)
sqrtn <- sqrt(lengthx)
load(file='createtable')
a<-table.start()
a<-table.row.start(a)
a<-table.element(a,'Autocorrelation Function',4,TRUE)
a<-table.row.end(a)
a<-table.row.start(a)
a<-table.element(a,'Time lag k',header=TRUE)
a<-table.element(a,'ACF(k)',header=TRUE)
a<-table.element(a,'T-STAT',header=TRUE)
a<-table.element(a,'P-value',header=TRUE)
a<-table.row.end(a)
for (i in 2:(par1+1)) {
a<-table.row.start(a)
a<-table.element(a,i-1,header=TRUE)
a<-table.element(a,round(myacf[i],6))
mytstat <- myacf[i]*sqrtn
a<-table.element(a,round(mytstat,4))
a<-table.element(a,round(1-pt(abs(mytstat),lengthx),6))
a<-table.row.end(a)
}
a<-table.end(a)
table.save(a,file='mytable.tab')
a<-table.start()
a<-table.row.start(a)
a<-table.element(a,'Partial Autocorrelation Function',4,TRUE)
a<-table.row.end(a)
a<-table.row.start(a)
a<-table.element(a,'Time lag k',header=TRUE)
a<-table.element(a,'PACF(k)',header=TRUE)
a<-table.element(a,'T-STAT',header=TRUE)
a<-table.element(a,'P-value',header=TRUE)
a<-table.row.end(a)
for (i in 1:par1) {
a<-table.row.start(a)
a<-table.element(a,i,header=TRUE)
a<-table.element(a,round(mypacf[i],6))
mytstat <- mypacf[i]*sqrtn
a<-table.element(a,round(mytstat,4))
a<-table.element(a,round(1-pt(abs(mytstat),lengthx),6))
a<-table.row.end(a)
}
a<-table.end(a)
table.save(a,file='mytable1.tab')