Free Statistics
of Irreproducible Research!
Description of Statistical Computation | ||||||||||||||||||||||||||||||||||||||||||
|---|---|---|---|---|---|---|---|---|---|---|---|---|---|---|---|---|---|---|---|---|---|---|---|---|---|---|---|---|---|---|---|---|---|---|---|---|---|---|---|---|---|---|
| Author's title | ||||||||||||||||||||||||||||||||||||||||||
| Author | *Unverified author* | |||||||||||||||||||||||||||||||||||||||||
| R Software Module | rwasp_meanversusmedian.wasp | |||||||||||||||||||||||||||||||||||||||||
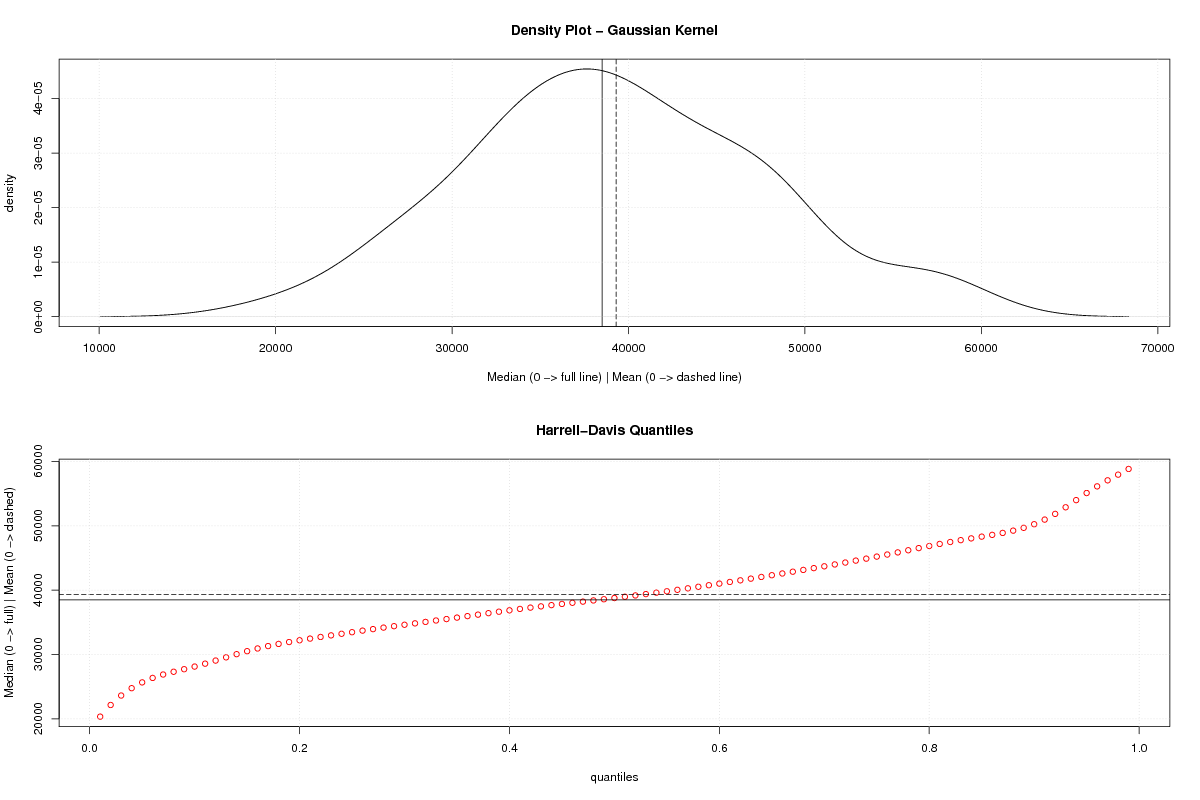
| Title produced by software | Mean versus Median | |||||||||||||||||||||||||||||||||||||||||
| Date of computation | Mon, 14 Aug 2017 15:37:39 +0200 | |||||||||||||||||||||||||||||||||||||||||
| Cite this page as follows | Statistical Computations at FreeStatistics.org, Office for Research Development and Education, URL https://freestatistics.org/blog/index.php?v=date/2017/Aug/14/t1502717945es1x4j6do0ywc1g.htm/, Retrieved Sun, 12 May 2024 12:53:38 +0000 | |||||||||||||||||||||||||||||||||||||||||
| Statistical Computations at FreeStatistics.org, Office for Research Development and Education, URL https://freestatistics.org/blog/index.php?pk=307223, Retrieved Sun, 12 May 2024 12:53:38 +0000 | ||||||||||||||||||||||||||||||||||||||||||
| QR Codes: | ||||||||||||||||||||||||||||||||||||||||||
|
| ||||||||||||||||||||||||||||||||||||||||||
| Original text written by user: | ||||||||||||||||||||||||||||||||||||||||||
| IsPrivate? | No (this computation is public) | |||||||||||||||||||||||||||||||||||||||||
| User-defined keywords | ||||||||||||||||||||||||||||||||||||||||||
| Estimated Impact | 106 | |||||||||||||||||||||||||||||||||||||||||
Tree of Dependent Computations | ||||||||||||||||||||||||||||||||||||||||||
| Family? (F = Feedback message, R = changed R code, M = changed R Module, P = changed Parameters, D = changed Data) | ||||||||||||||||||||||||||||||||||||||||||
| - [Mean versus Median] [aantal verkochte ...] [2017-08-14 13:37:39] [ff90ea2d7baa48124a9630d5b785d73f] [Current] | ||||||||||||||||||||||||||||||||||||||||||
| Feedback Forum | ||||||||||||||||||||||||||||||||||||||||||
Post a new message | ||||||||||||||||||||||||||||||||||||||||||
Dataset | ||||||||||||||||||||||||||||||||||||||||||
| Dataseries X: | ||||||||||||||||||||||||||||||||||||||||||
37800 36400 38500 30800 39900 39200 42000 43400 48300 42000 39900 49700 42000 31500 37100 28000 39200 32200 42700 38500 40600 45500 44800 53200 38500 32200 35700 25900 37100 28700 40600 38500 34300 49000 44100 50400 37800 35000 31500 25900 34300 30800 42000 40600 35000 46900 43400 56000 44800 27300 27300 27300 32200 32200 43400 39900 35700 44800 41300 59500 46900 27300 28700 23800 32900 37800 47600 46900 37800 44100 39200 56000 42700 34300 30800 23100 34300 41300 48300 45500 33600 48300 37800 58100 48300 35000 32200 21700 34300 32900 49700 49700 37800 49000 36400 56700 48300 35700 27300 18900 37100 35700 46900 53900 39900 44800 33600 58100 | ||||||||||||||||||||||||||||||||||||||||||
Tables (Output of Computation) | ||||||||||||||||||||||||||||||||||||||||||
| ||||||||||||||||||||||||||||||||||||||||||
Figures (Output of Computation) | ||||||||||||||||||||||||||||||||||||||||||
Input Parameters & R Code | ||||||||||||||||||||||||||||||||||||||||||
| Parameters (Session): | ||||||||||||||||||||||||||||||||||||||||||
| Parameters (R input): | ||||||||||||||||||||||||||||||||||||||||||
| R code (references can be found in the software module): | ||||||||||||||||||||||||||||||||||||||||||
library(Hmisc) | ||||||||||||||||||||||||||||||||||||||||||