Free Statistics

of Irreproducible Research!

Author's title

Author*Unverified author*
R Software Modulerwasp_autocorrelation.wasp
Title produced by software(Partial) Autocorrelation Function
Date of computationMon, 14 Aug 2017 15:56:23 +0200
Cite this page as followsStatistical Computations at FreeStatistics.org, Office for Research Development and Education, URL https://freestatistics.org/blog/index.php?v=date/2017/Aug/14/t15027190291hn0p1mn1equ79g.htm/, Retrieved Sun, 12 May 2024 21:22:23 +0000
Statistical Computations at FreeStatistics.org, Office for Research Development and Education, URL https://freestatistics.org/blog/index.php?pk=307225, Retrieved Sun, 12 May 2024 21:22:23 +0000
QR Codes:

Original text written by user:
IsPrivate?No (this computation is public)
User-defined keywords
Estimated Impact100
Family? (F = Feedback message, R = changed R code, M = changed R Module, P = changed Parameters, D = changed Data)
-       [(Partial) Autocorrelation Function] [aantal verkochte ...] [2017-08-14 13:56:23] [ff90ea2d7baa48124a9630d5b785d73f] [Current]
Feedback Forum

Post a new message
Dataseries X:
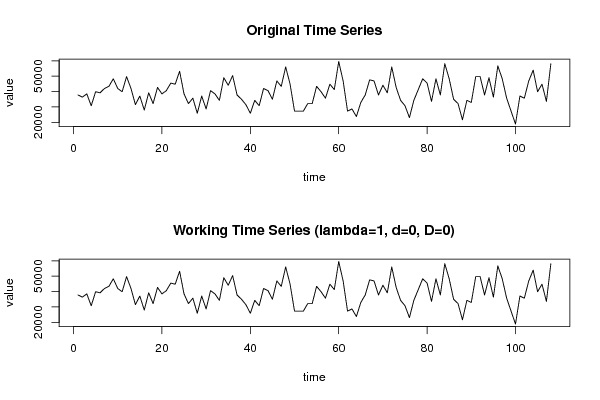
37800
36400
38500
30800
39900
39200
42000
43400
48300
42000
39900
49700
42000
31500
37100
28000
39200
32200
42700
38500
40600
45500
44800
53200
38500
32200
35700
25900
37100
28700
40600
38500
34300
49000
44100
50400
37800
35000
31500
25900
34300
30800
42000
40600
35000
46900
43400
56000
44800
27300
27300
27300
32200
32200
43400
39900
35700
44800
41300
59500
46900
27300
28700
23800
32900
37800
47600
46900
37800
44100
39200
56000
42700
34300
30800
23100
34300
41300
48300
45500
33600
48300
37800
58100
48300
35000
32200
21700
34300
32900
49700
49700
37800
49000
36400
56700
48300
35700
27300
18900
37100
35700
46900
53900
39900
44800
33600
58100


Summary of computational transaction
Raw Input view raw input (R code)
Raw Outputview raw output of R engine
Computing time2 seconds
R ServerBig Analytics Cloud Computing Center

\begin{tabular}{lllllllll}
\hline
Summary of computational transaction \tabularnewline
Raw Input view raw input (R code)  \tabularnewline
Raw Outputview raw output of R engine  \tabularnewline
Computing time2 seconds \tabularnewline
R ServerBig Analytics Cloud Computing Center \tabularnewline
\hline
\end{tabular}
%Source: https://freestatistics.org/blog/index.php?pk=307225&T=0

[TABLE]
[ROW]
Summary of computational transaction[/C][/ROW] [ROW]Raw Input[/C] view raw input (R code) [/C][/ROW] [ROW]Raw Output[/C]view raw output of R engine [/C][/ROW] [ROW]Computing time[/C]2 seconds[/C][/ROW] [ROW]R Server[/C]Big Analytics Cloud Computing Center[/C][/ROW] [/TABLE] Source: https://freestatistics.org/blog/index.php?pk=307225&T=0

Globally Unique Identifier (entire table): ba.freestatistics.org/blog/index.php?pk=307225&T=0

As an alternative you can also use a QR Code:  

The GUIDs for individual cells are displayed in the table below:

Summary of computational transaction
Raw Input view raw input (R code)
Raw Outputview raw output of R engine
Computing time2 seconds
R ServerBig Analytics Cloud Computing Center


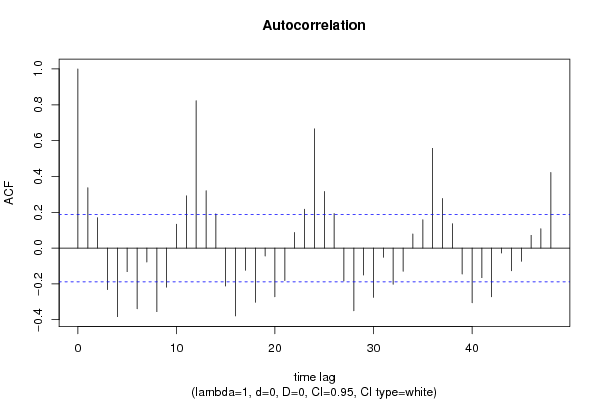
Autocorrelation Function
Time lag kACF(k)T-STATP-value
10.3366633.49870.00034
20.1690571.75690.040885
3-0.231794-2.40890.008847
4-0.382786-3.9786.3e-05
5-0.131504-1.36660.087291
6-0.338556-3.51840.000318
7-0.077437-0.80480.211365
8-0.354641-3.68550.000179
9-0.217904-2.26450.012769
100.1332671.3850.084461
110.2916383.03080.001527
120.8222228.54480
130.3196633.3220.00061
140.1907961.98280.024964
15-0.211977-2.20290.014862
16-0.378625-3.93487.4e-05
17-0.123426-1.28270.101174
18-0.302499-3.14370.001077
19-0.043995-0.45720.324218
20-0.271734-2.82390.002825
21-0.181085-1.88190.031272
220.0873580.90790.182989
230.2164872.24980.013245
240.6656696.91780
250.3163773.28790.000681
260.1924622.00010.023999
27-0.183063-1.90240.029888
28-0.350358-3.6410.000209
29-0.149914-1.5580.061085
30-0.275068-2.85860.002554
31-0.051083-0.53090.2983
32-0.201543-2.09450.019277
33-0.129517-1.3460.090563
340.0787830.81870.207368
350.1585861.64810.051122
360.5565235.78360
370.2772762.88150.002387
380.1359251.41260.080328
39-0.145191-1.50890.067126
40-0.305425-3.17410.000979
41-0.164851-1.71320.044774
42-0.271741-2.8240.002824
43-0.027706-0.28790.386977
44-0.12626-1.31210.096129
45-0.073662-0.76550.222816
460.0708820.73660.231473
470.108351.1260.131329
480.4221874.38751.3e-05

\begin{tabular}{lllllllll}
\hline
Autocorrelation Function \tabularnewline
Time lag k & ACF(k) & T-STAT & P-value \tabularnewline
1 & 0.336663 & 3.4987 & 0.00034 \tabularnewline
2 & 0.169057 & 1.7569 & 0.040885 \tabularnewline
3 & -0.231794 & -2.4089 & 0.008847 \tabularnewline
4 & -0.382786 & -3.978 & 6.3e-05 \tabularnewline
5 & -0.131504 & -1.3666 & 0.087291 \tabularnewline
6 & -0.338556 & -3.5184 & 0.000318 \tabularnewline
7 & -0.077437 & -0.8048 & 0.211365 \tabularnewline
8 & -0.354641 & -3.6855 & 0.000179 \tabularnewline
9 & -0.217904 & -2.2645 & 0.012769 \tabularnewline
10 & 0.133267 & 1.385 & 0.084461 \tabularnewline
11 & 0.291638 & 3.0308 & 0.001527 \tabularnewline
12 & 0.822222 & 8.5448 & 0 \tabularnewline
13 & 0.319663 & 3.322 & 0.00061 \tabularnewline
14 & 0.190796 & 1.9828 & 0.024964 \tabularnewline
15 & -0.211977 & -2.2029 & 0.014862 \tabularnewline
16 & -0.378625 & -3.9348 & 7.4e-05 \tabularnewline
17 & -0.123426 & -1.2827 & 0.101174 \tabularnewline
18 & -0.302499 & -3.1437 & 0.001077 \tabularnewline
19 & -0.043995 & -0.4572 & 0.324218 \tabularnewline
20 & -0.271734 & -2.8239 & 0.002825 \tabularnewline
21 & -0.181085 & -1.8819 & 0.031272 \tabularnewline
22 & 0.087358 & 0.9079 & 0.182989 \tabularnewline
23 & 0.216487 & 2.2498 & 0.013245 \tabularnewline
24 & 0.665669 & 6.9178 & 0 \tabularnewline
25 & 0.316377 & 3.2879 & 0.000681 \tabularnewline
26 & 0.192462 & 2.0001 & 0.023999 \tabularnewline
27 & -0.183063 & -1.9024 & 0.029888 \tabularnewline
28 & -0.350358 & -3.641 & 0.000209 \tabularnewline
29 & -0.149914 & -1.558 & 0.061085 \tabularnewline
30 & -0.275068 & -2.8586 & 0.002554 \tabularnewline
31 & -0.051083 & -0.5309 & 0.2983 \tabularnewline
32 & -0.201543 & -2.0945 & 0.019277 \tabularnewline
33 & -0.129517 & -1.346 & 0.090563 \tabularnewline
34 & 0.078783 & 0.8187 & 0.207368 \tabularnewline
35 & 0.158586 & 1.6481 & 0.051122 \tabularnewline
36 & 0.556523 & 5.7836 & 0 \tabularnewline
37 & 0.277276 & 2.8815 & 0.002387 \tabularnewline
38 & 0.135925 & 1.4126 & 0.080328 \tabularnewline
39 & -0.145191 & -1.5089 & 0.067126 \tabularnewline
40 & -0.305425 & -3.1741 & 0.000979 \tabularnewline
41 & -0.164851 & -1.7132 & 0.044774 \tabularnewline
42 & -0.271741 & -2.824 & 0.002824 \tabularnewline
43 & -0.027706 & -0.2879 & 0.386977 \tabularnewline
44 & -0.12626 & -1.3121 & 0.096129 \tabularnewline
45 & -0.073662 & -0.7655 & 0.222816 \tabularnewline
46 & 0.070882 & 0.7366 & 0.231473 \tabularnewline
47 & 0.10835 & 1.126 & 0.131329 \tabularnewline
48 & 0.422187 & 4.3875 & 1.3e-05 \tabularnewline
\hline
\end{tabular}
%Source: https://freestatistics.org/blog/index.php?pk=307225&T=1

[TABLE]
[ROW][C]Autocorrelation Function[/C][/ROW]
[ROW][C]Time lag k[/C][C]ACF(k)[/C][C]T-STAT[/C][C]P-value[/C][/ROW]
[ROW][C]1[/C][C]0.336663[/C][C]3.4987[/C][C]0.00034[/C][/ROW]
[ROW][C]2[/C][C]0.169057[/C][C]1.7569[/C][C]0.040885[/C][/ROW]
[ROW][C]3[/C][C]-0.231794[/C][C]-2.4089[/C][C]0.008847[/C][/ROW]
[ROW][C]4[/C][C]-0.382786[/C][C]-3.978[/C][C]6.3e-05[/C][/ROW]
[ROW][C]5[/C][C]-0.131504[/C][C]-1.3666[/C][C]0.087291[/C][/ROW]
[ROW][C]6[/C][C]-0.338556[/C][C]-3.5184[/C][C]0.000318[/C][/ROW]
[ROW][C]7[/C][C]-0.077437[/C][C]-0.8048[/C][C]0.211365[/C][/ROW]
[ROW][C]8[/C][C]-0.354641[/C][C]-3.6855[/C][C]0.000179[/C][/ROW]
[ROW][C]9[/C][C]-0.217904[/C][C]-2.2645[/C][C]0.012769[/C][/ROW]
[ROW][C]10[/C][C]0.133267[/C][C]1.385[/C][C]0.084461[/C][/ROW]
[ROW][C]11[/C][C]0.291638[/C][C]3.0308[/C][C]0.001527[/C][/ROW]
[ROW][C]12[/C][C]0.822222[/C][C]8.5448[/C][C]0[/C][/ROW]
[ROW][C]13[/C][C]0.319663[/C][C]3.322[/C][C]0.00061[/C][/ROW]
[ROW][C]14[/C][C]0.190796[/C][C]1.9828[/C][C]0.024964[/C][/ROW]
[ROW][C]15[/C][C]-0.211977[/C][C]-2.2029[/C][C]0.014862[/C][/ROW]
[ROW][C]16[/C][C]-0.378625[/C][C]-3.9348[/C][C]7.4e-05[/C][/ROW]
[ROW][C]17[/C][C]-0.123426[/C][C]-1.2827[/C][C]0.101174[/C][/ROW]
[ROW][C]18[/C][C]-0.302499[/C][C]-3.1437[/C][C]0.001077[/C][/ROW]
[ROW][C]19[/C][C]-0.043995[/C][C]-0.4572[/C][C]0.324218[/C][/ROW]
[ROW][C]20[/C][C]-0.271734[/C][C]-2.8239[/C][C]0.002825[/C][/ROW]
[ROW][C]21[/C][C]-0.181085[/C][C]-1.8819[/C][C]0.031272[/C][/ROW]
[ROW][C]22[/C][C]0.087358[/C][C]0.9079[/C][C]0.182989[/C][/ROW]
[ROW][C]23[/C][C]0.216487[/C][C]2.2498[/C][C]0.013245[/C][/ROW]
[ROW][C]24[/C][C]0.665669[/C][C]6.9178[/C][C]0[/C][/ROW]
[ROW][C]25[/C][C]0.316377[/C][C]3.2879[/C][C]0.000681[/C][/ROW]
[ROW][C]26[/C][C]0.192462[/C][C]2.0001[/C][C]0.023999[/C][/ROW]
[ROW][C]27[/C][C]-0.183063[/C][C]-1.9024[/C][C]0.029888[/C][/ROW]
[ROW][C]28[/C][C]-0.350358[/C][C]-3.641[/C][C]0.000209[/C][/ROW]
[ROW][C]29[/C][C]-0.149914[/C][C]-1.558[/C][C]0.061085[/C][/ROW]
[ROW][C]30[/C][C]-0.275068[/C][C]-2.8586[/C][C]0.002554[/C][/ROW]
[ROW][C]31[/C][C]-0.051083[/C][C]-0.5309[/C][C]0.2983[/C][/ROW]
[ROW][C]32[/C][C]-0.201543[/C][C]-2.0945[/C][C]0.019277[/C][/ROW]
[ROW][C]33[/C][C]-0.129517[/C][C]-1.346[/C][C]0.090563[/C][/ROW]
[ROW][C]34[/C][C]0.078783[/C][C]0.8187[/C][C]0.207368[/C][/ROW]
[ROW][C]35[/C][C]0.158586[/C][C]1.6481[/C][C]0.051122[/C][/ROW]
[ROW][C]36[/C][C]0.556523[/C][C]5.7836[/C][C]0[/C][/ROW]
[ROW][C]37[/C][C]0.277276[/C][C]2.8815[/C][C]0.002387[/C][/ROW]
[ROW][C]38[/C][C]0.135925[/C][C]1.4126[/C][C]0.080328[/C][/ROW]
[ROW][C]39[/C][C]-0.145191[/C][C]-1.5089[/C][C]0.067126[/C][/ROW]
[ROW][C]40[/C][C]-0.305425[/C][C]-3.1741[/C][C]0.000979[/C][/ROW]
[ROW][C]41[/C][C]-0.164851[/C][C]-1.7132[/C][C]0.044774[/C][/ROW]
[ROW][C]42[/C][C]-0.271741[/C][C]-2.824[/C][C]0.002824[/C][/ROW]
[ROW][C]43[/C][C]-0.027706[/C][C]-0.2879[/C][C]0.386977[/C][/ROW]
[ROW][C]44[/C][C]-0.12626[/C][C]-1.3121[/C][C]0.096129[/C][/ROW]
[ROW][C]45[/C][C]-0.073662[/C][C]-0.7655[/C][C]0.222816[/C][/ROW]
[ROW][C]46[/C][C]0.070882[/C][C]0.7366[/C][C]0.231473[/C][/ROW]
[ROW][C]47[/C][C]0.10835[/C][C]1.126[/C][C]0.131329[/C][/ROW]
[ROW][C]48[/C][C]0.422187[/C][C]4.3875[/C][C]1.3e-05[/C][/ROW]
[/TABLE]
Source: https://freestatistics.org/blog/index.php?pk=307225&T=1

Globally Unique Identifier (entire table): ba.freestatistics.org/blog/index.php?pk=307225&T=1

As an alternative you can also use a QR Code:  

The GUIDs for individual cells are displayed in the table below:

Autocorrelation Function
Time lag kACF(k)T-STATP-value
10.3366633.49870.00034
20.1690571.75690.040885
3-0.231794-2.40890.008847
4-0.382786-3.9786.3e-05
5-0.131504-1.36660.087291
6-0.338556-3.51840.000318
7-0.077437-0.80480.211365
8-0.354641-3.68550.000179
9-0.217904-2.26450.012769
100.1332671.3850.084461
110.2916383.03080.001527
120.8222228.54480
130.3196633.3220.00061
140.1907961.98280.024964
15-0.211977-2.20290.014862
16-0.378625-3.93487.4e-05
17-0.123426-1.28270.101174
18-0.302499-3.14370.001077
19-0.043995-0.45720.324218
20-0.271734-2.82390.002825
21-0.181085-1.88190.031272
220.0873580.90790.182989
230.2164872.24980.013245
240.6656696.91780
250.3163773.28790.000681
260.1924622.00010.023999
27-0.183063-1.90240.029888
28-0.350358-3.6410.000209
29-0.149914-1.5580.061085
30-0.275068-2.85860.002554
31-0.051083-0.53090.2983
32-0.201543-2.09450.019277
33-0.129517-1.3460.090563
340.0787830.81870.207368
350.1585861.64810.051122
360.5565235.78360
370.2772762.88150.002387
380.1359251.41260.080328
39-0.145191-1.50890.067126
40-0.305425-3.17410.000979
41-0.164851-1.71320.044774
42-0.271741-2.8240.002824
43-0.027706-0.28790.386977
44-0.12626-1.31210.096129
45-0.073662-0.76550.222816
460.0708820.73660.231473
470.108351.1260.131329
480.4221874.38751.3e-05


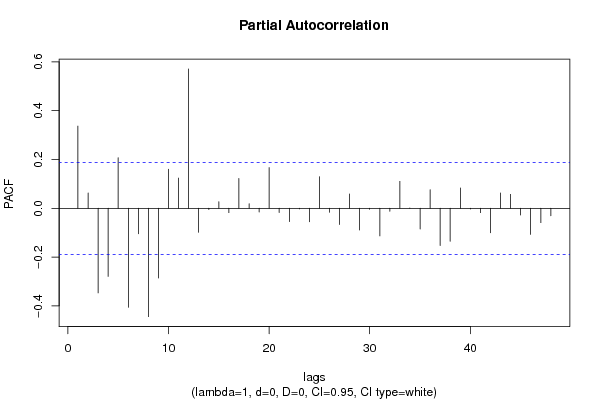
Partial Autocorrelation Function
Time lag kPACF(k)T-STATP-value
10.3366633.49870.00034
20.0628380.6530.257563
3-0.34681-3.60420.000238
4-0.279258-2.90210.002247
50.2070782.1520.016812
6-0.405723-4.21642.6e-05
7-0.104224-1.08310.140582
8-0.444314-4.61745e-06
9-0.286191-2.97420.001812
100.1599921.66270.049637
110.1236311.28480.100804
120.5711325.93540
13-0.098578-1.02450.153955
14-0.005205-0.05410.47848
150.0266640.27710.391115
16-0.017876-0.18580.426486
170.121991.26780.103805
180.018680.19410.423221
19-0.015145-0.15740.437615
200.1667231.73260.043007
21-0.017057-0.17730.429819
22-0.054664-0.56810.285579
23-0.002629-0.02730.489128
24-0.055508-0.57690.28262
250.1294751.34550.090634
26-0.016448-0.17090.432298
27-0.066876-0.6950.244274
280.0585320.60830.272138
29-0.089156-0.92650.178116
30-0.00381-0.03960.484244
31-0.113289-1.17730.120826
32-0.012498-0.12990.448449
330.1104221.14750.126846
340.0012650.01310.494768
35-0.085369-0.88720.188478
360.0758440.78820.216155
37-0.152474-1.58460.057996
38-0.135011-1.40310.081732
390.0832810.86550.194348
40-0.003349-0.03480.486149
41-0.017896-0.1860.426406
42-0.100266-1.0420.14987
430.0626250.65080.258273
440.0569290.59160.27767
45-0.027336-0.28410.388446
46-0.106976-1.11170.134362
47-0.058908-0.61220.270851
48-0.030833-0.32040.374634

\begin{tabular}{lllllllll}
\hline
Partial Autocorrelation Function \tabularnewline
Time lag k & PACF(k) & T-STAT & P-value \tabularnewline
1 & 0.336663 & 3.4987 & 0.00034 \tabularnewline
2 & 0.062838 & 0.653 & 0.257563 \tabularnewline
3 & -0.34681 & -3.6042 & 0.000238 \tabularnewline
4 & -0.279258 & -2.9021 & 0.002247 \tabularnewline
5 & 0.207078 & 2.152 & 0.016812 \tabularnewline
6 & -0.405723 & -4.2164 & 2.6e-05 \tabularnewline
7 & -0.104224 & -1.0831 & 0.140582 \tabularnewline
8 & -0.444314 & -4.6174 & 5e-06 \tabularnewline
9 & -0.286191 & -2.9742 & 0.001812 \tabularnewline
10 & 0.159992 & 1.6627 & 0.049637 \tabularnewline
11 & 0.123631 & 1.2848 & 0.100804 \tabularnewline
12 & 0.571132 & 5.9354 & 0 \tabularnewline
13 & -0.098578 & -1.0245 & 0.153955 \tabularnewline
14 & -0.005205 & -0.0541 & 0.47848 \tabularnewline
15 & 0.026664 & 0.2771 & 0.391115 \tabularnewline
16 & -0.017876 & -0.1858 & 0.426486 \tabularnewline
17 & 0.12199 & 1.2678 & 0.103805 \tabularnewline
18 & 0.01868 & 0.1941 & 0.423221 \tabularnewline
19 & -0.015145 & -0.1574 & 0.437615 \tabularnewline
20 & 0.166723 & 1.7326 & 0.043007 \tabularnewline
21 & -0.017057 & -0.1773 & 0.429819 \tabularnewline
22 & -0.054664 & -0.5681 & 0.285579 \tabularnewline
23 & -0.002629 & -0.0273 & 0.489128 \tabularnewline
24 & -0.055508 & -0.5769 & 0.28262 \tabularnewline
25 & 0.129475 & 1.3455 & 0.090634 \tabularnewline
26 & -0.016448 & -0.1709 & 0.432298 \tabularnewline
27 & -0.066876 & -0.695 & 0.244274 \tabularnewline
28 & 0.058532 & 0.6083 & 0.272138 \tabularnewline
29 & -0.089156 & -0.9265 & 0.178116 \tabularnewline
30 & -0.00381 & -0.0396 & 0.484244 \tabularnewline
31 & -0.113289 & -1.1773 & 0.120826 \tabularnewline
32 & -0.012498 & -0.1299 & 0.448449 \tabularnewline
33 & 0.110422 & 1.1475 & 0.126846 \tabularnewline
34 & 0.001265 & 0.0131 & 0.494768 \tabularnewline
35 & -0.085369 & -0.8872 & 0.188478 \tabularnewline
36 & 0.075844 & 0.7882 & 0.216155 \tabularnewline
37 & -0.152474 & -1.5846 & 0.057996 \tabularnewline
38 & -0.135011 & -1.4031 & 0.081732 \tabularnewline
39 & 0.083281 & 0.8655 & 0.194348 \tabularnewline
40 & -0.003349 & -0.0348 & 0.486149 \tabularnewline
41 & -0.017896 & -0.186 & 0.426406 \tabularnewline
42 & -0.100266 & -1.042 & 0.14987 \tabularnewline
43 & 0.062625 & 0.6508 & 0.258273 \tabularnewline
44 & 0.056929 & 0.5916 & 0.27767 \tabularnewline
45 & -0.027336 & -0.2841 & 0.388446 \tabularnewline
46 & -0.106976 & -1.1117 & 0.134362 \tabularnewline
47 & -0.058908 & -0.6122 & 0.270851 \tabularnewline
48 & -0.030833 & -0.3204 & 0.374634 \tabularnewline
\hline
\end{tabular}
%Source: https://freestatistics.org/blog/index.php?pk=307225&T=2

[TABLE]
[ROW][C]Partial Autocorrelation Function[/C][/ROW]
[ROW][C]Time lag k[/C][C]PACF(k)[/C][C]T-STAT[/C][C]P-value[/C][/ROW]
[ROW][C]1[/C][C]0.336663[/C][C]3.4987[/C][C]0.00034[/C][/ROW]
[ROW][C]2[/C][C]0.062838[/C][C]0.653[/C][C]0.257563[/C][/ROW]
[ROW][C]3[/C][C]-0.34681[/C][C]-3.6042[/C][C]0.000238[/C][/ROW]
[ROW][C]4[/C][C]-0.279258[/C][C]-2.9021[/C][C]0.002247[/C][/ROW]
[ROW][C]5[/C][C]0.207078[/C][C]2.152[/C][C]0.016812[/C][/ROW]
[ROW][C]6[/C][C]-0.405723[/C][C]-4.2164[/C][C]2.6e-05[/C][/ROW]
[ROW][C]7[/C][C]-0.104224[/C][C]-1.0831[/C][C]0.140582[/C][/ROW]
[ROW][C]8[/C][C]-0.444314[/C][C]-4.6174[/C][C]5e-06[/C][/ROW]
[ROW][C]9[/C][C]-0.286191[/C][C]-2.9742[/C][C]0.001812[/C][/ROW]
[ROW][C]10[/C][C]0.159992[/C][C]1.6627[/C][C]0.049637[/C][/ROW]
[ROW][C]11[/C][C]0.123631[/C][C]1.2848[/C][C]0.100804[/C][/ROW]
[ROW][C]12[/C][C]0.571132[/C][C]5.9354[/C][C]0[/C][/ROW]
[ROW][C]13[/C][C]-0.098578[/C][C]-1.0245[/C][C]0.153955[/C][/ROW]
[ROW][C]14[/C][C]-0.005205[/C][C]-0.0541[/C][C]0.47848[/C][/ROW]
[ROW][C]15[/C][C]0.026664[/C][C]0.2771[/C][C]0.391115[/C][/ROW]
[ROW][C]16[/C][C]-0.017876[/C][C]-0.1858[/C][C]0.426486[/C][/ROW]
[ROW][C]17[/C][C]0.12199[/C][C]1.2678[/C][C]0.103805[/C][/ROW]
[ROW][C]18[/C][C]0.01868[/C][C]0.1941[/C][C]0.423221[/C][/ROW]
[ROW][C]19[/C][C]-0.015145[/C][C]-0.1574[/C][C]0.437615[/C][/ROW]
[ROW][C]20[/C][C]0.166723[/C][C]1.7326[/C][C]0.043007[/C][/ROW]
[ROW][C]21[/C][C]-0.017057[/C][C]-0.1773[/C][C]0.429819[/C][/ROW]
[ROW][C]22[/C][C]-0.054664[/C][C]-0.5681[/C][C]0.285579[/C][/ROW]
[ROW][C]23[/C][C]-0.002629[/C][C]-0.0273[/C][C]0.489128[/C][/ROW]
[ROW][C]24[/C][C]-0.055508[/C][C]-0.5769[/C][C]0.28262[/C][/ROW]
[ROW][C]25[/C][C]0.129475[/C][C]1.3455[/C][C]0.090634[/C][/ROW]
[ROW][C]26[/C][C]-0.016448[/C][C]-0.1709[/C][C]0.432298[/C][/ROW]
[ROW][C]27[/C][C]-0.066876[/C][C]-0.695[/C][C]0.244274[/C][/ROW]
[ROW][C]28[/C][C]0.058532[/C][C]0.6083[/C][C]0.272138[/C][/ROW]
[ROW][C]29[/C][C]-0.089156[/C][C]-0.9265[/C][C]0.178116[/C][/ROW]
[ROW][C]30[/C][C]-0.00381[/C][C]-0.0396[/C][C]0.484244[/C][/ROW]
[ROW][C]31[/C][C]-0.113289[/C][C]-1.1773[/C][C]0.120826[/C][/ROW]
[ROW][C]32[/C][C]-0.012498[/C][C]-0.1299[/C][C]0.448449[/C][/ROW]
[ROW][C]33[/C][C]0.110422[/C][C]1.1475[/C][C]0.126846[/C][/ROW]
[ROW][C]34[/C][C]0.001265[/C][C]0.0131[/C][C]0.494768[/C][/ROW]
[ROW][C]35[/C][C]-0.085369[/C][C]-0.8872[/C][C]0.188478[/C][/ROW]
[ROW][C]36[/C][C]0.075844[/C][C]0.7882[/C][C]0.216155[/C][/ROW]
[ROW][C]37[/C][C]-0.152474[/C][C]-1.5846[/C][C]0.057996[/C][/ROW]
[ROW][C]38[/C][C]-0.135011[/C][C]-1.4031[/C][C]0.081732[/C][/ROW]
[ROW][C]39[/C][C]0.083281[/C][C]0.8655[/C][C]0.194348[/C][/ROW]
[ROW][C]40[/C][C]-0.003349[/C][C]-0.0348[/C][C]0.486149[/C][/ROW]
[ROW][C]41[/C][C]-0.017896[/C][C]-0.186[/C][C]0.426406[/C][/ROW]
[ROW][C]42[/C][C]-0.100266[/C][C]-1.042[/C][C]0.14987[/C][/ROW]
[ROW][C]43[/C][C]0.062625[/C][C]0.6508[/C][C]0.258273[/C][/ROW]
[ROW][C]44[/C][C]0.056929[/C][C]0.5916[/C][C]0.27767[/C][/ROW]
[ROW][C]45[/C][C]-0.027336[/C][C]-0.2841[/C][C]0.388446[/C][/ROW]
[ROW][C]46[/C][C]-0.106976[/C][C]-1.1117[/C][C]0.134362[/C][/ROW]
[ROW][C]47[/C][C]-0.058908[/C][C]-0.6122[/C][C]0.270851[/C][/ROW]
[ROW][C]48[/C][C]-0.030833[/C][C]-0.3204[/C][C]0.374634[/C][/ROW]
[/TABLE]
Source: https://freestatistics.org/blog/index.php?pk=307225&T=2

Globally Unique Identifier (entire table): ba.freestatistics.org/blog/index.php?pk=307225&T=2

As an alternative you can also use a QR Code:  

The GUIDs for individual cells are displayed in the table below:

Partial Autocorrelation Function
Time lag kPACF(k)T-STATP-value
10.3366633.49870.00034
20.0628380.6530.257563
3-0.34681-3.60420.000238
4-0.279258-2.90210.002247
50.2070782.1520.016812
6-0.405723-4.21642.6e-05
7-0.104224-1.08310.140582
8-0.444314-4.61745e-06
9-0.286191-2.97420.001812
100.1599921.66270.049637
110.1236311.28480.100804
120.5711325.93540
13-0.098578-1.02450.153955
14-0.005205-0.05410.47848
150.0266640.27710.391115
16-0.017876-0.18580.426486
170.121991.26780.103805
180.018680.19410.423221
19-0.015145-0.15740.437615
200.1667231.73260.043007
21-0.017057-0.17730.429819
22-0.054664-0.56810.285579
23-0.002629-0.02730.489128
24-0.055508-0.57690.28262
250.1294751.34550.090634
26-0.016448-0.17090.432298
27-0.066876-0.6950.244274
280.0585320.60830.272138
29-0.089156-0.92650.178116
30-0.00381-0.03960.484244
31-0.113289-1.17730.120826
32-0.012498-0.12990.448449
330.1104221.14750.126846
340.0012650.01310.494768
35-0.085369-0.88720.188478
360.0758440.78820.216155
37-0.152474-1.58460.057996
38-0.135011-1.40310.081732
390.0832810.86550.194348
40-0.003349-0.03480.486149
41-0.017896-0.1860.426406
42-0.100266-1.0420.14987
430.0626250.65080.258273
440.0569290.59160.27767
45-0.027336-0.28410.388446
46-0.106976-1.11170.134362
47-0.058908-0.61220.270851
48-0.030833-0.32040.374634


Parameters (Session):
Parameters (R input):
par1 = 48 ; par2 = 1 ; par3 = 0 ; par4 = 0 ; par5 = 12 ; par6 = White Noise ; par7 = 0.95 ; par8 = ;
R code (references can be found in the software module):
if (par1 == 'Default') {
par1 = 10*log10(length(x))
} else {
par1 <- as.numeric(par1)
}
par2 <- as.numeric(par2)
par3 <- as.numeric(par3)
par4 <- as.numeric(par4)
par5 <- as.numeric(par5)
if (par6 == 'White Noise') par6 <- 'white' else par6 <- 'ma'
par7 <- as.numeric(par7)
if (par8 != '') par8 <- as.numeric(par8)
x <- na.omit(x)
ox <- x
if (par8 == '') {
if (par2 == 0) {
x <- log(x)
} else {
x <- (x ^ par2 - 1) / par2
}
} else {
x <- log(x,base=par8)
}
if (par3 > 0) x <- diff(x,lag=1,difference=par3)
if (par4 > 0) x <- diff(x,lag=par5,difference=par4)
bitmap(file='picts.png')
op <- par(mfrow=c(2,1))
plot(ox,type='l',main='Original Time Series',xlab='time',ylab='value')
if (par8=='') {
mytitle <- paste('Working Time Series (lambda=',par2,', d=',par3,', D=',par4,')',sep='')
mysub <- paste('(lambda=',par2,', d=',par3,', D=',par4,', CI=', par7, ', CI type=',par6,')',sep='')
} else {
mytitle <- paste('Working Time Series (base=',par8,', d=',par3,', D=',par4,')',sep='')
mysub <- paste('(base=',par8,', d=',par3,', D=',par4,', CI=', par7, ', CI type=',par6,')',sep='')
}
plot(x,type='l', main=mytitle,xlab='time',ylab='value')
par(op)
dev.off()
bitmap(file='pic1.png')
racf <- acf(x, par1, main='Autocorrelation', xlab='time lag', ylab='ACF', ci.type=par6, ci=par7, sub=mysub)
dev.off()
bitmap(file='pic2.png')
rpacf <- pacf(x,par1,main='Partial Autocorrelation',xlab='lags',ylab='PACF',sub=mysub)
dev.off()
(myacf <- c(racf$acf))
(mypacf <- c(rpacf$acf))
lengthx <- length(x)
sqrtn <- sqrt(lengthx)
load(file='createtable')
a<-table.start()
a<-table.row.start(a)
a<-table.element(a,'Autocorrelation Function',4,TRUE)
a<-table.row.end(a)
a<-table.row.start(a)
a<-table.element(a,'Time lag k',header=TRUE)
a<-table.element(a,'ACF(k)',header=TRUE)
a<-table.element(a,'T-STAT',header=TRUE)
a<-table.element(a,'P-value',header=TRUE)
a<-table.row.end(a)
for (i in 2:(par1+1)) {
a<-table.row.start(a)
a<-table.element(a,i-1,header=TRUE)
a<-table.element(a,round(myacf[i],6))
mytstat <- myacf[i]*sqrtn
a<-table.element(a,round(mytstat,4))
a<-table.element(a,round(1-pt(abs(mytstat),lengthx),6))
a<-table.row.end(a)
}
a<-table.end(a)
table.save(a,file='mytable.tab')
a<-table.start()
a<-table.row.start(a)
a<-table.element(a,'Partial Autocorrelation Function',4,TRUE)
a<-table.row.end(a)
a<-table.row.start(a)
a<-table.element(a,'Time lag k',header=TRUE)
a<-table.element(a,'PACF(k)',header=TRUE)
a<-table.element(a,'T-STAT',header=TRUE)
a<-table.element(a,'P-value',header=TRUE)
a<-table.row.end(a)
for (i in 1:par1) {
a<-table.row.start(a)
a<-table.element(a,i,header=TRUE)
a<-table.element(a,round(mypacf[i],6))
mytstat <- mypacf[i]*sqrtn
a<-table.element(a,round(mytstat,4))
a<-table.element(a,round(1-pt(abs(mytstat),lengthx),6))
a<-table.row.end(a)
}
a<-table.end(a)
table.save(a,file='mytable1.tab')