Free Statistics

of Irreproducible Research!

Author's title

Author*Unverified author*
R Software Modulerwasp_smp.wasp
Title produced by softwareStandard Deviation-Mean Plot
Date of computationMon, 14 Aug 2017 17:14:22 +0200
Cite this page as followsStatistical Computations at FreeStatistics.org, Office for Research Development and Education, URL https://freestatistics.org/blog/index.php?v=date/2017/Aug/14/t1502723808h4zy1wm059xl3e9.htm/, Retrieved Mon, 13 May 2024 19:09:11 +0000
Statistical Computations at FreeStatistics.org, Office for Research Development and Education, URL https://freestatistics.org/blog/index.php?pk=307237, Retrieved Mon, 13 May 2024 19:09:11 +0000
QR Codes:

Original text written by user:
IsPrivate?No (this computation is public)
User-defined keywords
Estimated Impact102
Family? (F = Feedback message, R = changed R code, M = changed R Module, P = changed Parameters, D = changed Data)
-       [Standard Deviation-Mean Plot] [aantal verkochte ...] [2017-08-14 15:14:22] [ff90ea2d7baa48124a9630d5b785d73f] [Current]
Feedback Forum

Post a new message
Dataseries X:
37800
36400
38500
30800
39900
39200
42000
43400
48300
42000
39900
49700
42000
31500
37100
28000
39200
32200
42700
38500
40600
45500
44800
53200
38500
32200
35700
25900
37100
28700
40600
38500
34300
49000
44100
50400
37800
35000
31500
25900
34300
30800
42000
40600
35000
46900
43400
56000
44800
27300
27300
27300
32200
32200
43400
39900
35700
44800
41300
59500
46900
27300
28700
23800
32900
37800
47600
46900
37800
44100
39200
56000
42700
34300
30800
23100
34300
41300
48300
45500
33600
48300
37800
58100
48300
35000
32200
21700
34300
32900
49700
49700
37800
49000
36400
56700
48300
35700
27300
18900
37100
35700
46900
53900
39900
44800
33600
58100


Summary of computational transaction
Raw Input view raw input (R code)
Raw Outputview raw output of R engine
Computing time1 seconds
R ServerBig Analytics Cloud Computing Center

\begin{tabular}{lllllllll}
\hline
Summary of computational transaction \tabularnewline
Raw Input view raw input (R code)  \tabularnewline
Raw Outputview raw output of R engine  \tabularnewline
Computing time1 seconds \tabularnewline
R ServerBig Analytics Cloud Computing Center \tabularnewline
\hline
\end{tabular}
%Source: https://freestatistics.org/blog/index.php?pk=307237&T=0

[TABLE]
[ROW]
Summary of computational transaction[/C][/ROW] [ROW]Raw Input[/C] view raw input (R code) [/C][/ROW] [ROW]Raw Output[/C]view raw output of R engine [/C][/ROW] [ROW]Computing time[/C]1 seconds[/C][/ROW] [ROW]R Server[/C]Big Analytics Cloud Computing Center[/C][/ROW] [/TABLE] Source: https://freestatistics.org/blog/index.php?pk=307237&T=0

Globally Unique Identifier (entire table): ba.freestatistics.org/blog/index.php?pk=307237&T=0

As an alternative you can also use a QR Code:  

The GUIDs for individual cells are displayed in the table below:

Summary of computational transaction
Raw Input view raw input (R code)
Raw Outputview raw output of R engine
Computing time1 seconds
R ServerBig Analytics Cloud Computing Center


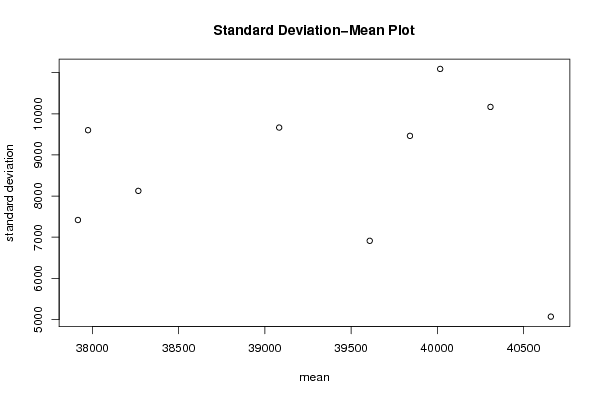
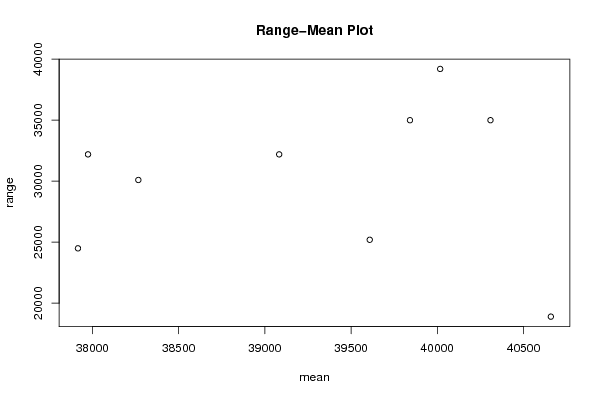
Standard Deviation-Mean Plot
SectionMeanStandard DeviationRange
140658.33333333335069.4196069683518900
239608.33333333336913.2886968548225200
337916.66666666677419.1194446061724500
438266.66666666678126.8727445469830100
5379759603.1363248017732200
639083.33333333339666.5151503277132200
739841.66666666679464.523071433535000
840308.333333333310167.904792964435000
940016.666666666711091.424478834939200

\begin{tabular}{lllllllll}
\hline
Standard Deviation-Mean Plot \tabularnewline
Section & Mean & Standard Deviation & Range \tabularnewline
1 & 40658.3333333333 & 5069.41960696835 & 18900 \tabularnewline
2 & 39608.3333333333 & 6913.28869685482 & 25200 \tabularnewline
3 & 37916.6666666667 & 7419.11944460617 & 24500 \tabularnewline
4 & 38266.6666666667 & 8126.87274454698 & 30100 \tabularnewline
5 & 37975 & 9603.13632480177 & 32200 \tabularnewline
6 & 39083.3333333333 & 9666.51515032771 & 32200 \tabularnewline
7 & 39841.6666666667 & 9464.5230714335 & 35000 \tabularnewline
8 & 40308.3333333333 & 10167.9047929644 & 35000 \tabularnewline
9 & 40016.6666666667 & 11091.4244788349 & 39200 \tabularnewline
\hline
\end{tabular}
%Source: https://freestatistics.org/blog/index.php?pk=307237&T=1

[TABLE]
[ROW][C]Standard Deviation-Mean Plot[/C][/ROW]
[ROW][C]Section[/C][C]Mean[/C][C]Standard Deviation[/C][C]Range[/C][/ROW]
[ROW][C]1[/C][C]40658.3333333333[/C][C]5069.41960696835[/C][C]18900[/C][/ROW]
[ROW][C]2[/C][C]39608.3333333333[/C][C]6913.28869685482[/C][C]25200[/C][/ROW]
[ROW][C]3[/C][C]37916.6666666667[/C][C]7419.11944460617[/C][C]24500[/C][/ROW]
[ROW][C]4[/C][C]38266.6666666667[/C][C]8126.87274454698[/C][C]30100[/C][/ROW]
[ROW][C]5[/C][C]37975[/C][C]9603.13632480177[/C][C]32200[/C][/ROW]
[ROW][C]6[/C][C]39083.3333333333[/C][C]9666.51515032771[/C][C]32200[/C][/ROW]
[ROW][C]7[/C][C]39841.6666666667[/C][C]9464.5230714335[/C][C]35000[/C][/ROW]
[ROW][C]8[/C][C]40308.3333333333[/C][C]10167.9047929644[/C][C]35000[/C][/ROW]
[ROW][C]9[/C][C]40016.6666666667[/C][C]11091.4244788349[/C][C]39200[/C][/ROW]
[/TABLE]
Source: https://freestatistics.org/blog/index.php?pk=307237&T=1

Globally Unique Identifier (entire table): ba.freestatistics.org/blog/index.php?pk=307237&T=1

As an alternative you can also use a QR Code:  

The GUIDs for individual cells are displayed in the table below:

Standard Deviation-Mean Plot
SectionMeanStandard DeviationRange
140658.33333333335069.4196069683518900
239608.33333333336913.2886968548225200
337916.66666666677419.1194446061724500
438266.66666666678126.8727445469830100
5379759603.1363248017732200
639083.33333333339666.5151503277132200
739841.66666666679464.523071433535000
840308.333333333310167.904792964435000
940016.666666666711091.424478834939200


Regression: S.E.(k) = alpha + beta * Mean(k)
alpha12835.9986497207
beta-0.107448317059866
S.D.0.688757001617609
T-STAT-0.156003230177717
p-value0.88043412050898

\begin{tabular}{lllllllll}
\hline
Regression: S.E.(k) = alpha + beta * Mean(k) \tabularnewline
alpha & 12835.9986497207 \tabularnewline
beta & -0.107448317059866 \tabularnewline
S.D. & 0.688757001617609 \tabularnewline
T-STAT & -0.156003230177717 \tabularnewline
p-value & 0.88043412050898 \tabularnewline
\hline
\end{tabular}
%Source: https://freestatistics.org/blog/index.php?pk=307237&T=2

[TABLE]
[ROW][C]Regression: S.E.(k) = alpha + beta * Mean(k)[/C][/ROW]
[ROW][C]alpha[/C][C]12835.9986497207[/C][/ROW]
[ROW][C]beta[/C][C]-0.107448317059866[/C][/ROW]
[ROW][C]S.D.[/C][C]0.688757001617609[/C][/ROW]
[ROW][C]T-STAT[/C][C]-0.156003230177717[/C][/ROW]
[ROW][C]p-value[/C][C]0.88043412050898[/C][/ROW]
[/TABLE]
Source: https://freestatistics.org/blog/index.php?pk=307237&T=2

Globally Unique Identifier (entire table): ba.freestatistics.org/blog/index.php?pk=307237&T=2

As an alternative you can also use a QR Code:  

The GUIDs for individual cells are displayed in the table below:

Regression: S.E.(k) = alpha + beta * Mean(k)
alpha12835.9986497207
beta-0.107448317059866
S.D.0.688757001617609
T-STAT-0.156003230177717
p-value0.88043412050898


Regression: ln S.E.(k) = alpha + beta * ln Mean(k)
alpha22.7500176376188
beta-1.29633550728137
S.D.3.45582772786266
T-STAT-0.375115778147633
p-value0.718681736243571
Lambda2.29633550728137

\begin{tabular}{lllllllll}
\hline
Regression: ln S.E.(k) = alpha + beta * ln Mean(k) \tabularnewline
alpha & 22.7500176376188 \tabularnewline
beta & -1.29633550728137 \tabularnewline
S.D. & 3.45582772786266 \tabularnewline
T-STAT & -0.375115778147633 \tabularnewline
p-value & 0.718681736243571 \tabularnewline
Lambda & 2.29633550728137 \tabularnewline
\hline
\end{tabular}
%Source: https://freestatistics.org/blog/index.php?pk=307237&T=3

[TABLE]
[ROW][C]Regression: ln S.E.(k) = alpha + beta * ln Mean(k)[/C][/ROW]
[ROW][C]alpha[/C][C]22.7500176376188[/C][/ROW]
[ROW][C]beta[/C][C]-1.29633550728137[/C][/ROW]
[ROW][C]S.D.[/C][C]3.45582772786266[/C][/ROW]
[ROW][C]T-STAT[/C][C]-0.375115778147633[/C][/ROW]
[ROW][C]p-value[/C][C]0.718681736243571[/C][/ROW]
[ROW][C]Lambda[/C][C]2.29633550728137[/C][/ROW]
[/TABLE]
Source: https://freestatistics.org/blog/index.php?pk=307237&T=3

Globally Unique Identifier (entire table): ba.freestatistics.org/blog/index.php?pk=307237&T=3

As an alternative you can also use a QR Code:  

The GUIDs for individual cells are displayed in the table below:

Regression: ln S.E.(k) = alpha + beta * ln Mean(k)
alpha22.7500176376188
beta-1.29633550728137
S.D.3.45582772786266
T-STAT-0.375115778147633
p-value0.718681736243571
Lambda2.29633550728137


Parameters (Session):
par1 = 12 ;
Parameters (R input):
par1 = 12 ;
R code (references can be found in the software module):
par1 <- as.numeric(par1)
(n <- length(x))
(np <- floor(n / par1))
arr <- array(NA,dim=c(par1,np))
j <- 0
k <- 1
for (i in 1:(np*par1))
{
j = j + 1
arr[j,k] <- x[i]
if (j == par1) {
j = 0
k=k+1
}
}
arr
arr.mean <- array(NA,dim=np)
arr.sd <- array(NA,dim=np)
arr.range <- array(NA,dim=np)
for (j in 1:np)
{
arr.mean[j] <- mean(arr[,j],na.rm=TRUE)
arr.sd[j] <- sd(arr[,j],na.rm=TRUE)
arr.range[j] <- max(arr[,j],na.rm=TRUE) - min(arr[,j],na.rm=TRUE)
}
arr.mean
arr.sd
arr.range
(lm1 <- lm(arr.sd~arr.mean))
(lnlm1 <- lm(log(arr.sd)~log(arr.mean)))
(lm2 <- lm(arr.range~arr.mean))
bitmap(file='test1.png')
plot(arr.mean,arr.sd,main='Standard Deviation-Mean Plot',xlab='mean',ylab='standard deviation')
dev.off()
bitmap(file='test2.png')
plot(arr.mean,arr.range,main='Range-Mean Plot',xlab='mean',ylab='range')
dev.off()
load(file='createtable')
a<-table.start()
a<-table.row.start(a)
a<-table.element(a,'Standard Deviation-Mean Plot',4,TRUE)
a<-table.row.end(a)
a<-table.row.start(a)
a<-table.element(a,'Section',header=TRUE)
a<-table.element(a,'Mean',header=TRUE)
a<-table.element(a,'Standard Deviation',header=TRUE)
a<-table.element(a,'Range',header=TRUE)
a<-table.row.end(a)
for (j in 1:np) {
a<-table.row.start(a)
a<-table.element(a,j,header=TRUE)
a<-table.element(a,arr.mean[j])
a<-table.element(a,arr.sd[j] )
a<-table.element(a,arr.range[j] )
a<-table.row.end(a)
}
a<-table.end(a)
table.save(a,file='mytable.tab')
a<-table.start()
a<-table.row.start(a)
a<-table.element(a,'Regression: S.E.(k) = alpha + beta * Mean(k)',2,TRUE)
a<-table.row.end(a)
a<-table.row.start(a)
a<-table.element(a,'alpha',header=TRUE)
a<-table.element(a,lm1$coefficients[[1]])
a<-table.row.end(a)
a<-table.row.start(a)
a<-table.element(a,'beta',header=TRUE)
a<-table.element(a,lm1$coefficients[[2]])
a<-table.row.end(a)
a<-table.row.start(a)
a<-table.element(a,'S.D.',header=TRUE)
a<-table.element(a,summary(lm1)$coefficients[2,2])
a<-table.row.end(a)
a<-table.row.start(a)
a<-table.element(a,'T-STAT',header=TRUE)
a<-table.element(a,summary(lm1)$coefficients[2,3])
a<-table.row.end(a)
a<-table.row.start(a)
a<-table.element(a,'p-value',header=TRUE)
a<-table.element(a,summary(lm1)$coefficients[2,4])
a<-table.row.end(a)
a<-table.end(a)
table.save(a,file='mytable1.tab')
a<-table.start()
a<-table.row.start(a)
a<-table.element(a,'Regression: ln S.E.(k) = alpha + beta * ln Mean(k)',2,TRUE)
a<-table.row.end(a)
a<-table.row.start(a)
a<-table.element(a,'alpha',header=TRUE)
a<-table.element(a,lnlm1$coefficients[[1]])
a<-table.row.end(a)
a<-table.row.start(a)
a<-table.element(a,'beta',header=TRUE)
a<-table.element(a,lnlm1$coefficients[[2]])
a<-table.row.end(a)
a<-table.row.start(a)
a<-table.element(a,'S.D.',header=TRUE)
a<-table.element(a,summary(lnlm1)$coefficients[2,2])
a<-table.row.end(a)
a<-table.row.start(a)
a<-table.element(a,'T-STAT',header=TRUE)
a<-table.element(a,summary(lnlm1)$coefficients[2,3])
a<-table.row.end(a)
a<-table.row.start(a)
a<-table.element(a,'p-value',header=TRUE)
a<-table.element(a,summary(lnlm1)$coefficients[2,4])
a<-table.row.end(a)
a<-table.row.start(a)
a<-table.element(a,'Lambda',header=TRUE)
a<-table.element(a,1-lnlm1$coefficients[[2]])
a<-table.row.end(a)
a<-table.end(a)
table.save(a,file='mytable2.tab')