Free Statistics

of Irreproducible Research!

Author's title

Author*Unverified author*
R Software Modulerwasp_notchedbox1.wasp
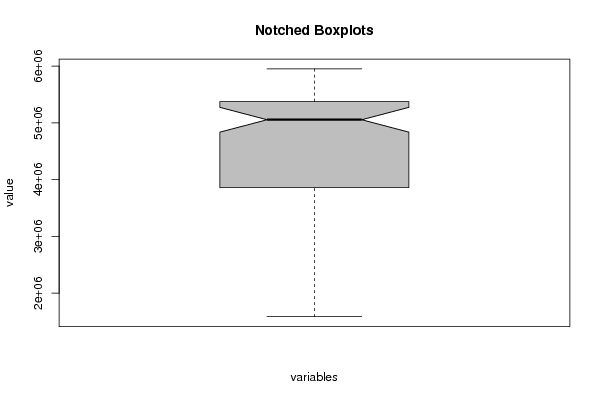
Title produced by softwareNotched Boxplots
Date of computationWed, 16 Aug 2017 11:05:22 +0200
Cite this page as followsStatistical Computations at FreeStatistics.org, Office for Research Development and Education, URL https://freestatistics.org/blog/index.php?v=date/2017/Aug/16/t150287488080mi8n45fdxgef8.htm/, Retrieved Sat, 11 May 2024 12:03:43 +0000
Statistical Computations at FreeStatistics.org, Office for Research Development and Education, URL https://freestatistics.org/blog/index.php?pk=307355, Retrieved Sat, 11 May 2024 12:03:43 +0000
QR Codes:

Original text written by user:
IsPrivate?No (this computation is public)
User-defined keywords
Estimated Impact147
Family? (F = Feedback message, R = changed R code, M = changed R Module, P = changed Parameters, D = changed Data)
-       [Notched Boxplots] [] [2017-08-16 09:05:22] [f8975010d6e80ebfdd11eb899305ce74] [Current]
Feedback Forum

Post a new message
Dataseries X:
5204472
5185089
5165433
5124756
5527158
5505864
5204472
5004090
5023473
5023473
5045040
5083806
5144139
5144139
5105373
5004090
5527158
5606874
5486481
5204472
5325138
5144139
5225766
5264805
5305482
5204472
5225766
5083806
5527158
5667207
5546814
5325138
5566197
5305482
5546814
5527158
5587491
5365815
5606874
5587491
5949216
5867589
5546814
5385198
5606874
5305482
5527158
5566197
5647824
5467098
5566197
5626530
5848206
5667207
5426148
5165433
5406765
4743375
5064423
5245149
5426148
5165433
5165433
5165433
5305482
5105373
4842747
4622982
4782414
4159974
4541355
4763031
4803708
4582032
4601415
4541355
4743375
4601415
4321590
4119297
4461366
3718533
4200924
4420689
4420689
4159974
3918915
3899532
4119297
3918915
3537807
3275181
3557190
2894073
3496857
3817632
3918915
3697239
3417141
3617523
3697239
3636906
3033849
2754024
2954133
2351349
2973789
3195465
3376191
3074799
2792790
2954133
3033849
2874417
2271633
2009007
2250066
1586949
2310399
2754024


Summary of computational transaction
Raw Input view raw input (R code)
Raw Outputview raw output of R engine
Computing time1 seconds
R ServerBig Analytics Cloud Computing Center

\begin{tabular}{lllllllll}
\hline
Summary of computational transaction \tabularnewline
Raw Input view raw input (R code)  \tabularnewline
Raw Outputview raw output of R engine  \tabularnewline
Computing time1 seconds \tabularnewline
R ServerBig Analytics Cloud Computing Center \tabularnewline
\hline
\end{tabular}
%Source: https://freestatistics.org/blog/index.php?pk=307355&T=0

[TABLE]
[ROW]
Summary of computational transaction[/C][/ROW] [ROW]Raw Input[/C] view raw input (R code) [/C][/ROW] [ROW]Raw Output[/C]view raw output of R engine [/C][/ROW] [ROW]Computing time[/C]1 seconds[/C][/ROW] [ROW]R Server[/C]Big Analytics Cloud Computing Center[/C][/ROW] [/TABLE] Source: https://freestatistics.org/blog/index.php?pk=307355&T=0

Globally Unique Identifier (entire table): ba.freestatistics.org/blog/index.php?pk=307355&T=0

As an alternative you can also use a QR Code:  

The GUIDs for individual cells are displayed in the table below:

Summary of computational transaction
Raw Input view raw input (R code)
Raw Outputview raw output of R engine
Computing time1 seconds
R ServerBig Analytics Cloud Computing Center


Boxplot statistics
Variablelower whiskerlower hingemedianupper hingeupper whisker
A158694938585825054731.55375506.55949216

\begin{tabular}{lllllllll}
\hline
Boxplot statistics \tabularnewline
Variable & lower whisker & lower hinge & median & upper hinge & upper whisker \tabularnewline
A & 1586949 & 3858582 & 5054731.5 & 5375506.5 & 5949216 \tabularnewline
\hline
\end{tabular}
%Source: https://freestatistics.org/blog/index.php?pk=307355&T=1

[TABLE]
[ROW][C]Boxplot statistics[/C][/ROW]
[ROW][C]Variable[/C][C]lower whisker[/C][C]lower hinge[/C][C]median[/C][C]upper hinge[/C][C]upper whisker[/C][/ROW]
[ROW][C]A[/C][C]1586949[/C][C]3858582[/C][C]5054731.5[/C][C]5375506.5[/C][C]5949216[/C][/ROW]
[/TABLE]
Source: https://freestatistics.org/blog/index.php?pk=307355&T=1

Globally Unique Identifier (entire table): ba.freestatistics.org/blog/index.php?pk=307355&T=1

As an alternative you can also use a QR Code:  

The GUIDs for individual cells are displayed in the table below:

Boxplot statistics
Variablelower whiskerlower hingemedianupper hingeupper whisker
A158694938585825054731.55375506.55949216


Boxplot Notches
Variablelower boundmedianupper bound
A4835940.008107015054731.55273522.99189299

\begin{tabular}{lllllllll}
\hline
Boxplot Notches \tabularnewline
Variable & lower bound & median & upper bound \tabularnewline
A & 4835940.00810701 & 5054731.5 & 5273522.99189299 \tabularnewline
\hline
\end{tabular}
%Source: https://freestatistics.org/blog/index.php?pk=307355&T=2

[TABLE]
[ROW][C]Boxplot Notches[/C][/ROW]
[ROW][C]Variable[/C][C]lower bound[/C][C]median[/C][C]upper bound[/C][/ROW]
[ROW][C]A[/C][C]4835940.00810701[/C][C]5054731.5[/C][C]5273522.99189299[/C][/ROW]
[/TABLE]
Source: https://freestatistics.org/blog/index.php?pk=307355&T=2

Globally Unique Identifier (entire table): ba.freestatistics.org/blog/index.php?pk=307355&T=2

As an alternative you can also use a QR Code:  

The GUIDs for individual cells are displayed in the table below:

Boxplot Notches
Variablelower boundmedianupper bound
A4835940.008107015054731.55273522.99189299


Parameters (Session):
par1 = grey ; par2 = no ;
Parameters (R input):
par1 = grey ; par2 = no ;
R code (references can be found in the software module):
if(par2=='yes') {
z <- na.omit(as.data.frame(t(y)))
} else {
z <- as.data.frame(t(y))
}
bitmap(file='test1.png')
(r<-boxplot(z ,xlab=xlab,ylab=ylab,main=main,notch=TRUE,col=par1))
dev.off()
load(file='createtable')
a<-table.start()
a<-table.row.start(a)
a<-table.element(a,'Boxplot statistics',6,TRUE)
a<-table.row.end(a)
a<-table.row.start(a)
a<-table.element(a,'Variable',1,TRUE)
a<-table.element(a,'lower whisker',1,TRUE)
a<-table.element(a,'lower hinge',1,TRUE)
a<-table.element(a,'median',1,TRUE)
a<-table.element(a,'upper hinge',1,TRUE)
a<-table.element(a,'upper whisker',1,TRUE)
a<-table.row.end(a)
for (i in 1:length(y[,1]))
{
a<-table.row.start(a)
a<-table.element(a,dimnames(t(x))[[2]][i],1,TRUE)
for (j in 1:5)
{
a<-table.element(a,r$stats[j,i])
}
a<-table.row.end(a)
}
a<-table.end(a)
table.save(a,file='mytable.tab')
a<-table.start()
a<-table.row.start(a)
a<-table.element(a,'Boxplot Notches',4,TRUE)
a<-table.row.end(a)
a<-table.row.start(a)
a<-table.element(a,'Variable',1,TRUE)
a<-table.element(a,'lower bound',1,TRUE)
a<-table.element(a,'median',1,TRUE)
a<-table.element(a,'upper bound',1,TRUE)
a<-table.row.end(a)
for (i in 1:length(y[,1]))
{
a<-table.row.start(a)
a<-table.element(a,dimnames(t(x))[[2]][i],1,TRUE)
a<-table.element(a,r$conf[1,i])
a<-table.element(a,r$stats[3,i])
a<-table.element(a,r$conf[2,i])
a<-table.row.end(a)
}
a<-table.end(a)
table.save(a,file='mytable1.tab')