Free Statistics

of Irreproducible Research!

Author's title

Author*Unverified author*
R Software Modulerwasp_autocorrelation.wasp
Title produced by software(Partial) Autocorrelation Function
Date of computationWed, 16 Aug 2017 12:34:23 +0200
Cite this page as followsStatistical Computations at FreeStatistics.org, Office for Research Development and Education, URL https://freestatistics.org/blog/index.php?v=date/2017/Aug/16/t1502879691em6bbl48sotnqy4.htm/, Retrieved Sat, 11 May 2024 13:56:51 +0000
Statistical Computations at FreeStatistics.org, Office for Research Development and Education, URL https://freestatistics.org/blog/index.php?pk=307364, Retrieved Sat, 11 May 2024 13:56:51 +0000
QR Codes:

Original text written by user:
IsPrivate?No (this computation is public)
User-defined keywords
Estimated Impact104
Family? (F = Feedback message, R = changed R code, M = changed R Module, P = changed Parameters, D = changed Data)
-       [(Partial) Autocorrelation Function] [] [2017-08-16 10:34:23] [d41d8cd98f00b204e9800998ecf8427e] [Current]
Feedback Forum

Post a new message
Dataseries X:
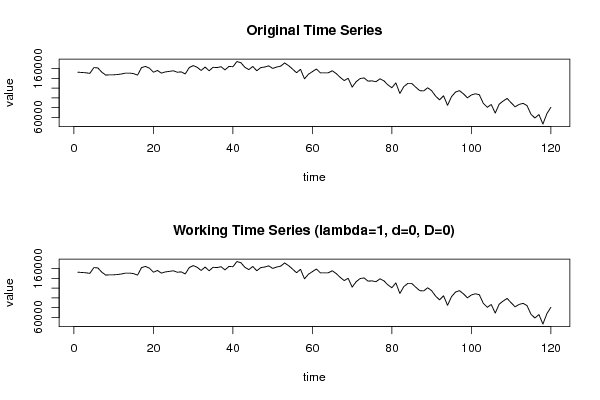
152512
151944
151368
150176
161968
161344
152512
146640
147208
147208
147840
148976
150744
150744
149608
146640
161968
164304
160776
152512
156048
150744
153136
154280
155472
152512
153136
148976
161968
166072
162544
156048
163112
155472
162544
161968
163736
157240
164304
163736
174336
171944
162544
157808
164304
155472
161968
163112
165504
160208
163112
164880
171376
166072
159008
151368
158440
139000
148408
153704
159008
151368
151368
151368
155472
149608
141912
135472
140144
121904
133080
139576
140768
134272
134840
133080
139000
134840
126640
120712
130736
108968
123104
129544
129544
121904
114840
114272
120712
114840
103672
95976
104240
84808
102472
111872
114840
108344
100136
106008
108344
106576
88904
80704
86568
68904
87144
93640
98936
90104
81840
86568
88904
84232
66568
58872
65936
46504
67704
80704


Summary of computational transaction
Raw Input view raw input (R code)
Raw Outputview raw output of R engine
Computing time2 seconds
R ServerBig Analytics Cloud Computing Center

\begin{tabular}{lllllllll}
\hline
Summary of computational transaction \tabularnewline
Raw Input view raw input (R code)  \tabularnewline
Raw Outputview raw output of R engine  \tabularnewline
Computing time2 seconds \tabularnewline
R ServerBig Analytics Cloud Computing Center \tabularnewline
\hline
\end{tabular}
%Source: https://freestatistics.org/blog/index.php?pk=307364&T=0

[TABLE]
[ROW]
Summary of computational transaction[/C][/ROW] [ROW]Raw Input[/C] view raw input (R code) [/C][/ROW] [ROW]Raw Output[/C]view raw output of R engine [/C][/ROW] [ROW]Computing time[/C]2 seconds[/C][/ROW] [ROW]R Server[/C]Big Analytics Cloud Computing Center[/C][/ROW] [/TABLE] Source: https://freestatistics.org/blog/index.php?pk=307364&T=0

Globally Unique Identifier (entire table): ba.freestatistics.org/blog/index.php?pk=307364&T=0

As an alternative you can also use a QR Code:  

The GUIDs for individual cells are displayed in the table below:

Summary of computational transaction
Raw Input view raw input (R code)
Raw Outputview raw output of R engine
Computing time2 seconds
R ServerBig Analytics Cloud Computing Center


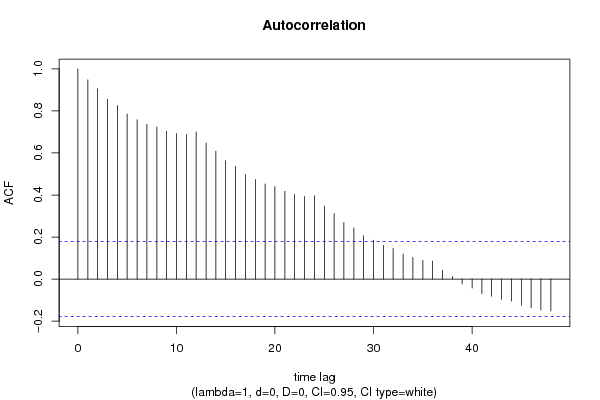
Autocorrelation Function
Time lag kACF(k)T-STATP-value
10.94790310.38380
20.9052669.91670
30.8557299.3740
40.8262069.05060
50.785688.60670
60.7579688.30310
70.7361898.06450
80.7236547.92720
90.7031827.7030
100.6921027.58160
110.6875717.5320
120.7001337.66960
130.647967.0980
140.6088366.66950
150.5635126.1730
160.5363635.87560
170.4979735.4550
180.4738355.19060
190.4526914.9591e-06
200.440014.82012e-06
210.4182934.58226e-06
220.4033944.4191.1e-05
230.3933244.30871.7e-05
240.3968984.34781.4e-05
250.3480743.8130.000109
260.3117633.41520.000435
270.2687162.94360.001948
280.243362.66590.004369
290.2063782.26080.012788
300.1844192.02020.022794
310.1603371.75640.040785
320.1452791.59150.057069
330.119031.30390.09738
340.1022791.12040.132388
350.0881890.96610.167977
360.0855640.93730.17524
370.0421530.46180.322544
380.0125270.13720.445541
39-0.023121-0.25330.400243
40-0.042346-0.46390.321788
41-0.070055-0.76740.22217
42-0.081845-0.89660.185873
43-0.096617-1.05840.146003
44-0.105098-1.15130.125951
45-0.124959-1.36890.086801
46-0.136033-1.49020.069402
47-0.147634-1.61720.054226
48-0.152258-1.66790.048972

\begin{tabular}{lllllllll}
\hline
Autocorrelation Function \tabularnewline
Time lag k & ACF(k) & T-STAT & P-value \tabularnewline
1 & 0.947903 & 10.3838 & 0 \tabularnewline
2 & 0.905266 & 9.9167 & 0 \tabularnewline
3 & 0.855729 & 9.374 & 0 \tabularnewline
4 & 0.826206 & 9.0506 & 0 \tabularnewline
5 & 0.78568 & 8.6067 & 0 \tabularnewline
6 & 0.757968 & 8.3031 & 0 \tabularnewline
7 & 0.736189 & 8.0645 & 0 \tabularnewline
8 & 0.723654 & 7.9272 & 0 \tabularnewline
9 & 0.703182 & 7.703 & 0 \tabularnewline
10 & 0.692102 & 7.5816 & 0 \tabularnewline
11 & 0.687571 & 7.532 & 0 \tabularnewline
12 & 0.700133 & 7.6696 & 0 \tabularnewline
13 & 0.64796 & 7.098 & 0 \tabularnewline
14 & 0.608836 & 6.6695 & 0 \tabularnewline
15 & 0.563512 & 6.173 & 0 \tabularnewline
16 & 0.536363 & 5.8756 & 0 \tabularnewline
17 & 0.497973 & 5.455 & 0 \tabularnewline
18 & 0.473835 & 5.1906 & 0 \tabularnewline
19 & 0.452691 & 4.959 & 1e-06 \tabularnewline
20 & 0.44001 & 4.8201 & 2e-06 \tabularnewline
21 & 0.418293 & 4.5822 & 6e-06 \tabularnewline
22 & 0.403394 & 4.419 & 1.1e-05 \tabularnewline
23 & 0.393324 & 4.3087 & 1.7e-05 \tabularnewline
24 & 0.396898 & 4.3478 & 1.4e-05 \tabularnewline
25 & 0.348074 & 3.813 & 0.000109 \tabularnewline
26 & 0.311763 & 3.4152 & 0.000435 \tabularnewline
27 & 0.268716 & 2.9436 & 0.001948 \tabularnewline
28 & 0.24336 & 2.6659 & 0.004369 \tabularnewline
29 & 0.206378 & 2.2608 & 0.012788 \tabularnewline
30 & 0.184419 & 2.0202 & 0.022794 \tabularnewline
31 & 0.160337 & 1.7564 & 0.040785 \tabularnewline
32 & 0.145279 & 1.5915 & 0.057069 \tabularnewline
33 & 0.11903 & 1.3039 & 0.09738 \tabularnewline
34 & 0.102279 & 1.1204 & 0.132388 \tabularnewline
35 & 0.088189 & 0.9661 & 0.167977 \tabularnewline
36 & 0.085564 & 0.9373 & 0.17524 \tabularnewline
37 & 0.042153 & 0.4618 & 0.322544 \tabularnewline
38 & 0.012527 & 0.1372 & 0.445541 \tabularnewline
39 & -0.023121 & -0.2533 & 0.400243 \tabularnewline
40 & -0.042346 & -0.4639 & 0.321788 \tabularnewline
41 & -0.070055 & -0.7674 & 0.22217 \tabularnewline
42 & -0.081845 & -0.8966 & 0.185873 \tabularnewline
43 & -0.096617 & -1.0584 & 0.146003 \tabularnewline
44 & -0.105098 & -1.1513 & 0.125951 \tabularnewline
45 & -0.124959 & -1.3689 & 0.086801 \tabularnewline
46 & -0.136033 & -1.4902 & 0.069402 \tabularnewline
47 & -0.147634 & -1.6172 & 0.054226 \tabularnewline
48 & -0.152258 & -1.6679 & 0.048972 \tabularnewline
\hline
\end{tabular}
%Source: https://freestatistics.org/blog/index.php?pk=307364&T=1

[TABLE]
[ROW][C]Autocorrelation Function[/C][/ROW]
[ROW][C]Time lag k[/C][C]ACF(k)[/C][C]T-STAT[/C][C]P-value[/C][/ROW]
[ROW][C]1[/C][C]0.947903[/C][C]10.3838[/C][C]0[/C][/ROW]
[ROW][C]2[/C][C]0.905266[/C][C]9.9167[/C][C]0[/C][/ROW]
[ROW][C]3[/C][C]0.855729[/C][C]9.374[/C][C]0[/C][/ROW]
[ROW][C]4[/C][C]0.826206[/C][C]9.0506[/C][C]0[/C][/ROW]
[ROW][C]5[/C][C]0.78568[/C][C]8.6067[/C][C]0[/C][/ROW]
[ROW][C]6[/C][C]0.757968[/C][C]8.3031[/C][C]0[/C][/ROW]
[ROW][C]7[/C][C]0.736189[/C][C]8.0645[/C][C]0[/C][/ROW]
[ROW][C]8[/C][C]0.723654[/C][C]7.9272[/C][C]0[/C][/ROW]
[ROW][C]9[/C][C]0.703182[/C][C]7.703[/C][C]0[/C][/ROW]
[ROW][C]10[/C][C]0.692102[/C][C]7.5816[/C][C]0[/C][/ROW]
[ROW][C]11[/C][C]0.687571[/C][C]7.532[/C][C]0[/C][/ROW]
[ROW][C]12[/C][C]0.700133[/C][C]7.6696[/C][C]0[/C][/ROW]
[ROW][C]13[/C][C]0.64796[/C][C]7.098[/C][C]0[/C][/ROW]
[ROW][C]14[/C][C]0.608836[/C][C]6.6695[/C][C]0[/C][/ROW]
[ROW][C]15[/C][C]0.563512[/C][C]6.173[/C][C]0[/C][/ROW]
[ROW][C]16[/C][C]0.536363[/C][C]5.8756[/C][C]0[/C][/ROW]
[ROW][C]17[/C][C]0.497973[/C][C]5.455[/C][C]0[/C][/ROW]
[ROW][C]18[/C][C]0.473835[/C][C]5.1906[/C][C]0[/C][/ROW]
[ROW][C]19[/C][C]0.452691[/C][C]4.959[/C][C]1e-06[/C][/ROW]
[ROW][C]20[/C][C]0.44001[/C][C]4.8201[/C][C]2e-06[/C][/ROW]
[ROW][C]21[/C][C]0.418293[/C][C]4.5822[/C][C]6e-06[/C][/ROW]
[ROW][C]22[/C][C]0.403394[/C][C]4.419[/C][C]1.1e-05[/C][/ROW]
[ROW][C]23[/C][C]0.393324[/C][C]4.3087[/C][C]1.7e-05[/C][/ROW]
[ROW][C]24[/C][C]0.396898[/C][C]4.3478[/C][C]1.4e-05[/C][/ROW]
[ROW][C]25[/C][C]0.348074[/C][C]3.813[/C][C]0.000109[/C][/ROW]
[ROW][C]26[/C][C]0.311763[/C][C]3.4152[/C][C]0.000435[/C][/ROW]
[ROW][C]27[/C][C]0.268716[/C][C]2.9436[/C][C]0.001948[/C][/ROW]
[ROW][C]28[/C][C]0.24336[/C][C]2.6659[/C][C]0.004369[/C][/ROW]
[ROW][C]29[/C][C]0.206378[/C][C]2.2608[/C][C]0.012788[/C][/ROW]
[ROW][C]30[/C][C]0.184419[/C][C]2.0202[/C][C]0.022794[/C][/ROW]
[ROW][C]31[/C][C]0.160337[/C][C]1.7564[/C][C]0.040785[/C][/ROW]
[ROW][C]32[/C][C]0.145279[/C][C]1.5915[/C][C]0.057069[/C][/ROW]
[ROW][C]33[/C][C]0.11903[/C][C]1.3039[/C][C]0.09738[/C][/ROW]
[ROW][C]34[/C][C]0.102279[/C][C]1.1204[/C][C]0.132388[/C][/ROW]
[ROW][C]35[/C][C]0.088189[/C][C]0.9661[/C][C]0.167977[/C][/ROW]
[ROW][C]36[/C][C]0.085564[/C][C]0.9373[/C][C]0.17524[/C][/ROW]
[ROW][C]37[/C][C]0.042153[/C][C]0.4618[/C][C]0.322544[/C][/ROW]
[ROW][C]38[/C][C]0.012527[/C][C]0.1372[/C][C]0.445541[/C][/ROW]
[ROW][C]39[/C][C]-0.023121[/C][C]-0.2533[/C][C]0.400243[/C][/ROW]
[ROW][C]40[/C][C]-0.042346[/C][C]-0.4639[/C][C]0.321788[/C][/ROW]
[ROW][C]41[/C][C]-0.070055[/C][C]-0.7674[/C][C]0.22217[/C][/ROW]
[ROW][C]42[/C][C]-0.081845[/C][C]-0.8966[/C][C]0.185873[/C][/ROW]
[ROW][C]43[/C][C]-0.096617[/C][C]-1.0584[/C][C]0.146003[/C][/ROW]
[ROW][C]44[/C][C]-0.105098[/C][C]-1.1513[/C][C]0.125951[/C][/ROW]
[ROW][C]45[/C][C]-0.124959[/C][C]-1.3689[/C][C]0.086801[/C][/ROW]
[ROW][C]46[/C][C]-0.136033[/C][C]-1.4902[/C][C]0.069402[/C][/ROW]
[ROW][C]47[/C][C]-0.147634[/C][C]-1.6172[/C][C]0.054226[/C][/ROW]
[ROW][C]48[/C][C]-0.152258[/C][C]-1.6679[/C][C]0.048972[/C][/ROW]
[/TABLE]
Source: https://freestatistics.org/blog/index.php?pk=307364&T=1

Globally Unique Identifier (entire table): ba.freestatistics.org/blog/index.php?pk=307364&T=1

As an alternative you can also use a QR Code:  

The GUIDs for individual cells are displayed in the table below:

Autocorrelation Function
Time lag kACF(k)T-STATP-value
10.94790310.38380
20.9052669.91670
30.8557299.3740
40.8262069.05060
50.785688.60670
60.7579688.30310
70.7361898.06450
80.7236547.92720
90.7031827.7030
100.6921027.58160
110.6875717.5320
120.7001337.66960
130.647967.0980
140.6088366.66950
150.5635126.1730
160.5363635.87560
170.4979735.4550
180.4738355.19060
190.4526914.9591e-06
200.440014.82012e-06
210.4182934.58226e-06
220.4033944.4191.1e-05
230.3933244.30871.7e-05
240.3968984.34781.4e-05
250.3480743.8130.000109
260.3117633.41520.000435
270.2687162.94360.001948
280.243362.66590.004369
290.2063782.26080.012788
300.1844192.02020.022794
310.1603371.75640.040785
320.1452791.59150.057069
330.119031.30390.09738
340.1022791.12040.132388
350.0881890.96610.167977
360.0855640.93730.17524
370.0421530.46180.322544
380.0125270.13720.445541
39-0.023121-0.25330.400243
40-0.042346-0.46390.321788
41-0.070055-0.76740.22217
42-0.081845-0.89660.185873
43-0.096617-1.05840.146003
44-0.105098-1.15130.125951
45-0.124959-1.36890.086801
46-0.136033-1.49020.069402
47-0.147634-1.61720.054226
48-0.152258-1.66790.048972


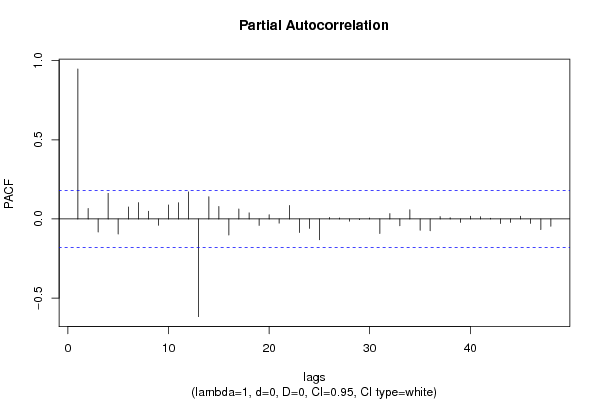
Partial Autocorrelation Function
Time lag kPACF(k)T-STATP-value
10.94790310.38380
20.0664850.72830.233921
3-0.082604-0.90490.18367
40.1617561.77190.039471
5-0.095006-1.04070.150044
60.0752330.82410.205747
70.1033481.13210.129921
80.0490890.53770.295874
9-0.040338-0.44190.329684
100.0882590.96680.167786
110.1024121.12190.132079
120.1708631.87170.031841
13-0.617564-6.76510
140.1401171.53490.06372
150.0791090.86660.193946
16-0.101788-1.1150.133532
170.0628720.68870.246163
180.0384160.42080.337316
19-0.041005-0.44920.327054
200.026510.29040.386003
21-0.026507-0.29040.386017
220.0847270.92810.177601
23-0.085814-0.940.17454
24-0.059736-0.65440.257061
25-0.132117-1.44730.075215
260.0095640.10480.458367
270.0063860.070.472174
28-0.014108-0.15450.438721
29-0.004643-0.05090.47976
300.0057190.06260.475076
31-0.091586-1.00330.158874
320.0335910.3680.356771
33-0.043549-0.47710.317095
340.0585110.6410.261385
35-0.071713-0.78560.216831
36-0.075129-0.8230.20607
370.0145270.15910.436916
380.0073090.08010.46816
39-0.021755-0.23830.406022
400.0172970.18950.425017
410.0142180.15570.438247
420.0038790.04250.483088
43-0.02902-0.31790.375557
44-0.021908-0.240.405372
450.0166560.18250.427764
46-0.028062-0.30740.379534
47-0.067435-0.73870.230761
48-0.046562-0.51010.305474

\begin{tabular}{lllllllll}
\hline
Partial Autocorrelation Function \tabularnewline
Time lag k & PACF(k) & T-STAT & P-value \tabularnewline
1 & 0.947903 & 10.3838 & 0 \tabularnewline
2 & 0.066485 & 0.7283 & 0.233921 \tabularnewline
3 & -0.082604 & -0.9049 & 0.18367 \tabularnewline
4 & 0.161756 & 1.7719 & 0.039471 \tabularnewline
5 & -0.095006 & -1.0407 & 0.150044 \tabularnewline
6 & 0.075233 & 0.8241 & 0.205747 \tabularnewline
7 & 0.103348 & 1.1321 & 0.129921 \tabularnewline
8 & 0.049089 & 0.5377 & 0.295874 \tabularnewline
9 & -0.040338 & -0.4419 & 0.329684 \tabularnewline
10 & 0.088259 & 0.9668 & 0.167786 \tabularnewline
11 & 0.102412 & 1.1219 & 0.132079 \tabularnewline
12 & 0.170863 & 1.8717 & 0.031841 \tabularnewline
13 & -0.617564 & -6.7651 & 0 \tabularnewline
14 & 0.140117 & 1.5349 & 0.06372 \tabularnewline
15 & 0.079109 & 0.8666 & 0.193946 \tabularnewline
16 & -0.101788 & -1.115 & 0.133532 \tabularnewline
17 & 0.062872 & 0.6887 & 0.246163 \tabularnewline
18 & 0.038416 & 0.4208 & 0.337316 \tabularnewline
19 & -0.041005 & -0.4492 & 0.327054 \tabularnewline
20 & 0.02651 & 0.2904 & 0.386003 \tabularnewline
21 & -0.026507 & -0.2904 & 0.386017 \tabularnewline
22 & 0.084727 & 0.9281 & 0.177601 \tabularnewline
23 & -0.085814 & -0.94 & 0.17454 \tabularnewline
24 & -0.059736 & -0.6544 & 0.257061 \tabularnewline
25 & -0.132117 & -1.4473 & 0.075215 \tabularnewline
26 & 0.009564 & 0.1048 & 0.458367 \tabularnewline
27 & 0.006386 & 0.07 & 0.472174 \tabularnewline
28 & -0.014108 & -0.1545 & 0.438721 \tabularnewline
29 & -0.004643 & -0.0509 & 0.47976 \tabularnewline
30 & 0.005719 & 0.0626 & 0.475076 \tabularnewline
31 & -0.091586 & -1.0033 & 0.158874 \tabularnewline
32 & 0.033591 & 0.368 & 0.356771 \tabularnewline
33 & -0.043549 & -0.4771 & 0.317095 \tabularnewline
34 & 0.058511 & 0.641 & 0.261385 \tabularnewline
35 & -0.071713 & -0.7856 & 0.216831 \tabularnewline
36 & -0.075129 & -0.823 & 0.20607 \tabularnewline
37 & 0.014527 & 0.1591 & 0.436916 \tabularnewline
38 & 0.007309 & 0.0801 & 0.46816 \tabularnewline
39 & -0.021755 & -0.2383 & 0.406022 \tabularnewline
40 & 0.017297 & 0.1895 & 0.425017 \tabularnewline
41 & 0.014218 & 0.1557 & 0.438247 \tabularnewline
42 & 0.003879 & 0.0425 & 0.483088 \tabularnewline
43 & -0.02902 & -0.3179 & 0.375557 \tabularnewline
44 & -0.021908 & -0.24 & 0.405372 \tabularnewline
45 & 0.016656 & 0.1825 & 0.427764 \tabularnewline
46 & -0.028062 & -0.3074 & 0.379534 \tabularnewline
47 & -0.067435 & -0.7387 & 0.230761 \tabularnewline
48 & -0.046562 & -0.5101 & 0.305474 \tabularnewline
\hline
\end{tabular}
%Source: https://freestatistics.org/blog/index.php?pk=307364&T=2

[TABLE]
[ROW][C]Partial Autocorrelation Function[/C][/ROW]
[ROW][C]Time lag k[/C][C]PACF(k)[/C][C]T-STAT[/C][C]P-value[/C][/ROW]
[ROW][C]1[/C][C]0.947903[/C][C]10.3838[/C][C]0[/C][/ROW]
[ROW][C]2[/C][C]0.066485[/C][C]0.7283[/C][C]0.233921[/C][/ROW]
[ROW][C]3[/C][C]-0.082604[/C][C]-0.9049[/C][C]0.18367[/C][/ROW]
[ROW][C]4[/C][C]0.161756[/C][C]1.7719[/C][C]0.039471[/C][/ROW]
[ROW][C]5[/C][C]-0.095006[/C][C]-1.0407[/C][C]0.150044[/C][/ROW]
[ROW][C]6[/C][C]0.075233[/C][C]0.8241[/C][C]0.205747[/C][/ROW]
[ROW][C]7[/C][C]0.103348[/C][C]1.1321[/C][C]0.129921[/C][/ROW]
[ROW][C]8[/C][C]0.049089[/C][C]0.5377[/C][C]0.295874[/C][/ROW]
[ROW][C]9[/C][C]-0.040338[/C][C]-0.4419[/C][C]0.329684[/C][/ROW]
[ROW][C]10[/C][C]0.088259[/C][C]0.9668[/C][C]0.167786[/C][/ROW]
[ROW][C]11[/C][C]0.102412[/C][C]1.1219[/C][C]0.132079[/C][/ROW]
[ROW][C]12[/C][C]0.170863[/C][C]1.8717[/C][C]0.031841[/C][/ROW]
[ROW][C]13[/C][C]-0.617564[/C][C]-6.7651[/C][C]0[/C][/ROW]
[ROW][C]14[/C][C]0.140117[/C][C]1.5349[/C][C]0.06372[/C][/ROW]
[ROW][C]15[/C][C]0.079109[/C][C]0.8666[/C][C]0.193946[/C][/ROW]
[ROW][C]16[/C][C]-0.101788[/C][C]-1.115[/C][C]0.133532[/C][/ROW]
[ROW][C]17[/C][C]0.062872[/C][C]0.6887[/C][C]0.246163[/C][/ROW]
[ROW][C]18[/C][C]0.038416[/C][C]0.4208[/C][C]0.337316[/C][/ROW]
[ROW][C]19[/C][C]-0.041005[/C][C]-0.4492[/C][C]0.327054[/C][/ROW]
[ROW][C]20[/C][C]0.02651[/C][C]0.2904[/C][C]0.386003[/C][/ROW]
[ROW][C]21[/C][C]-0.026507[/C][C]-0.2904[/C][C]0.386017[/C][/ROW]
[ROW][C]22[/C][C]0.084727[/C][C]0.9281[/C][C]0.177601[/C][/ROW]
[ROW][C]23[/C][C]-0.085814[/C][C]-0.94[/C][C]0.17454[/C][/ROW]
[ROW][C]24[/C][C]-0.059736[/C][C]-0.6544[/C][C]0.257061[/C][/ROW]
[ROW][C]25[/C][C]-0.132117[/C][C]-1.4473[/C][C]0.075215[/C][/ROW]
[ROW][C]26[/C][C]0.009564[/C][C]0.1048[/C][C]0.458367[/C][/ROW]
[ROW][C]27[/C][C]0.006386[/C][C]0.07[/C][C]0.472174[/C][/ROW]
[ROW][C]28[/C][C]-0.014108[/C][C]-0.1545[/C][C]0.438721[/C][/ROW]
[ROW][C]29[/C][C]-0.004643[/C][C]-0.0509[/C][C]0.47976[/C][/ROW]
[ROW][C]30[/C][C]0.005719[/C][C]0.0626[/C][C]0.475076[/C][/ROW]
[ROW][C]31[/C][C]-0.091586[/C][C]-1.0033[/C][C]0.158874[/C][/ROW]
[ROW][C]32[/C][C]0.033591[/C][C]0.368[/C][C]0.356771[/C][/ROW]
[ROW][C]33[/C][C]-0.043549[/C][C]-0.4771[/C][C]0.317095[/C][/ROW]
[ROW][C]34[/C][C]0.058511[/C][C]0.641[/C][C]0.261385[/C][/ROW]
[ROW][C]35[/C][C]-0.071713[/C][C]-0.7856[/C][C]0.216831[/C][/ROW]
[ROW][C]36[/C][C]-0.075129[/C][C]-0.823[/C][C]0.20607[/C][/ROW]
[ROW][C]37[/C][C]0.014527[/C][C]0.1591[/C][C]0.436916[/C][/ROW]
[ROW][C]38[/C][C]0.007309[/C][C]0.0801[/C][C]0.46816[/C][/ROW]
[ROW][C]39[/C][C]-0.021755[/C][C]-0.2383[/C][C]0.406022[/C][/ROW]
[ROW][C]40[/C][C]0.017297[/C][C]0.1895[/C][C]0.425017[/C][/ROW]
[ROW][C]41[/C][C]0.014218[/C][C]0.1557[/C][C]0.438247[/C][/ROW]
[ROW][C]42[/C][C]0.003879[/C][C]0.0425[/C][C]0.483088[/C][/ROW]
[ROW][C]43[/C][C]-0.02902[/C][C]-0.3179[/C][C]0.375557[/C][/ROW]
[ROW][C]44[/C][C]-0.021908[/C][C]-0.24[/C][C]0.405372[/C][/ROW]
[ROW][C]45[/C][C]0.016656[/C][C]0.1825[/C][C]0.427764[/C][/ROW]
[ROW][C]46[/C][C]-0.028062[/C][C]-0.3074[/C][C]0.379534[/C][/ROW]
[ROW][C]47[/C][C]-0.067435[/C][C]-0.7387[/C][C]0.230761[/C][/ROW]
[ROW][C]48[/C][C]-0.046562[/C][C]-0.5101[/C][C]0.305474[/C][/ROW]
[/TABLE]
Source: https://freestatistics.org/blog/index.php?pk=307364&T=2

Globally Unique Identifier (entire table): ba.freestatistics.org/blog/index.php?pk=307364&T=2

As an alternative you can also use a QR Code:  

The GUIDs for individual cells are displayed in the table below:

Partial Autocorrelation Function
Time lag kPACF(k)T-STATP-value
10.94790310.38380
20.0664850.72830.233921
3-0.082604-0.90490.18367
40.1617561.77190.039471
5-0.095006-1.04070.150044
60.0752330.82410.205747
70.1033481.13210.129921
80.0490890.53770.295874
9-0.040338-0.44190.329684
100.0882590.96680.167786
110.1024121.12190.132079
120.1708631.87170.031841
13-0.617564-6.76510
140.1401171.53490.06372
150.0791090.86660.193946
16-0.101788-1.1150.133532
170.0628720.68870.246163
180.0384160.42080.337316
19-0.041005-0.44920.327054
200.026510.29040.386003
21-0.026507-0.29040.386017
220.0847270.92810.177601
23-0.085814-0.940.17454
24-0.059736-0.65440.257061
25-0.132117-1.44730.075215
260.0095640.10480.458367
270.0063860.070.472174
28-0.014108-0.15450.438721
29-0.004643-0.05090.47976
300.0057190.06260.475076
31-0.091586-1.00330.158874
320.0335910.3680.356771
33-0.043549-0.47710.317095
340.0585110.6410.261385
35-0.071713-0.78560.216831
36-0.075129-0.8230.20607
370.0145270.15910.436916
380.0073090.08010.46816
39-0.021755-0.23830.406022
400.0172970.18950.425017
410.0142180.15570.438247
420.0038790.04250.483088
43-0.02902-0.31790.375557
44-0.021908-0.240.405372
450.0166560.18250.427764
46-0.028062-0.30740.379534
47-0.067435-0.73870.230761
48-0.046562-0.51010.305474


Parameters (Session):
par1 = 48 ; par2 = 1 ; par3 = 0 ; par4 = 0 ; par5 = 12 ; par6 = White Noise ; par7 = 0.95 ;
Parameters (R input):
par1 = 48 ; par2 = 1 ; par3 = 0 ; par4 = 0 ; par5 = 12 ; par6 = White Noise ; par7 = 0.95 ; par8 = ;
R code (references can be found in the software module):
par8 <- ''
par7 <- '0.95'
par6 <- 'White Noise'
par5 <- '12'
par4 <- '0'
par3 <- '0'
par2 <- '1'
par1 <- '48'
if (par1 == 'Default') {
par1 = 10*log10(length(x))
} else {
par1 <- as.numeric(par1)
}
par2 <- as.numeric(par2)
par3 <- as.numeric(par3)
par4 <- as.numeric(par4)
par5 <- as.numeric(par5)
if (par6 == 'White Noise') par6 <- 'white' else par6 <- 'ma'
par7 <- as.numeric(par7)
if (par8 != '') par8 <- as.numeric(par8)
x <- na.omit(x)
ox <- x
if (par8 == '') {
if (par2 == 0) {
x <- log(x)
} else {
x <- (x ^ par2 - 1) / par2
}
} else {
x <- log(x,base=par8)
}
if (par3 > 0) x <- diff(x,lag=1,difference=par3)
if (par4 > 0) x <- diff(x,lag=par5,difference=par4)
bitmap(file='picts.png')
op <- par(mfrow=c(2,1))
plot(ox,type='l',main='Original Time Series',xlab='time',ylab='value')
if (par8=='') {
mytitle <- paste('Working Time Series (lambda=',par2,', d=',par3,', D=',par4,')',sep='')
mysub <- paste('(lambda=',par2,', d=',par3,', D=',par4,', CI=', par7, ', CI type=',par6,')',sep='')
} else {
mytitle <- paste('Working Time Series (base=',par8,', d=',par3,', D=',par4,')',sep='')
mysub <- paste('(base=',par8,', d=',par3,', D=',par4,', CI=', par7, ', CI type=',par6,')',sep='')
}
plot(x,type='l', main=mytitle,xlab='time',ylab='value')
par(op)
dev.off()
bitmap(file='pic1.png')
racf <- acf(x, par1, main='Autocorrelation', xlab='time lag', ylab='ACF', ci.type=par6, ci=par7, sub=mysub)
dev.off()
bitmap(file='pic2.png')
rpacf <- pacf(x,par1,main='Partial Autocorrelation',xlab='lags',ylab='PACF',sub=mysub)
dev.off()
(myacf <- c(racf$acf))
(mypacf <- c(rpacf$acf))
lengthx <- length(x)
sqrtn <- sqrt(lengthx)
load(file='createtable')
a<-table.start()
a<-table.row.start(a)
a<-table.element(a,'Autocorrelation Function',4,TRUE)
a<-table.row.end(a)
a<-table.row.start(a)
a<-table.element(a,'Time lag k',header=TRUE)
a<-table.element(a,'ACF(k)',header=TRUE)
a<-table.element(a,'T-STAT',header=TRUE)
a<-table.element(a,'P-value',header=TRUE)
a<-table.row.end(a)
for (i in 2:(par1+1)) {
a<-table.row.start(a)
a<-table.element(a,i-1,header=TRUE)
a<-table.element(a,round(myacf[i],6))
mytstat <- myacf[i]*sqrtn
a<-table.element(a,round(mytstat,4))
a<-table.element(a,round(1-pt(abs(mytstat),lengthx),6))
a<-table.row.end(a)
}
a<-table.end(a)
table.save(a,file='mytable.tab')
a<-table.start()
a<-table.row.start(a)
a<-table.element(a,'Partial Autocorrelation Function',4,TRUE)
a<-table.row.end(a)
a<-table.row.start(a)
a<-table.element(a,'Time lag k',header=TRUE)
a<-table.element(a,'PACF(k)',header=TRUE)
a<-table.element(a,'T-STAT',header=TRUE)
a<-table.element(a,'P-value',header=TRUE)
a<-table.row.end(a)
for (i in 1:par1) {
a<-table.row.start(a)
a<-table.element(a,i,header=TRUE)
a<-table.element(a,round(mypacf[i],6))
mytstat <- mypacf[i]*sqrtn
a<-table.element(a,round(mytstat,4))
a<-table.element(a,round(1-pt(abs(mytstat),lengthx),6))
a<-table.row.end(a)
}
a<-table.end(a)
table.save(a,file='mytable1.tab')