Free Statistics

of Irreproducible Research!

Author's title

Author*Unverified author*
R Software Modulerwasp_smp.wasp
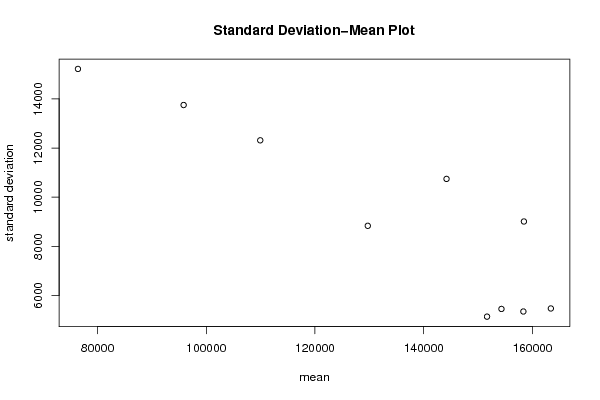
Title produced by softwareStandard Deviation-Mean Plot
Date of computationWed, 16 Aug 2017 13:50:08 +0200
Cite this page as followsStatistical Computations at FreeStatistics.org, Office for Research Development and Education, URL https://freestatistics.org/blog/index.php?v=date/2017/Aug/16/t15028842574jpjbo5zndypmob.htm/, Retrieved Sun, 12 May 2024 01:06:57 +0000
Statistical Computations at FreeStatistics.org, Office for Research Development and Education, URL https://freestatistics.org/blog/index.php?pk=307371, Retrieved Sun, 12 May 2024 01:06:57 +0000
QR Codes:

Original text written by user:
IsPrivate?No (this computation is public)
User-defined keywords
Estimated Impact103
Family? (F = Feedback message, R = changed R code, M = changed R Module, P = changed Parameters, D = changed Data)
-       [Standard Deviation-Mean Plot] [] [2017-08-16 11:50:08] [d41d8cd98f00b204e9800998ecf8427e] [Current]
Feedback Forum

Post a new message
Dataseries X:
152512
151944
151368
150176
161968
161344
152512
146640
147208
147208
147840
148976
150744
150744
149608
146640
161968
164304
160776
152512
156048
150744
153136
154280
155472
152512
153136
148976
161968
166072
162544
156048
163112
155472
162544
161968
163736
157240
164304
163736
174336
171944
162544
157808
164304
155472
161968
163112
165504
160208
163112
164880
171376
166072
159008
151368
158440
139000
148408
153704
159008
151368
151368
151368
155472
149608
141912
135472
140144
121904
133080
139576
140768
134272
134840
133080
139000
134840
126640
120712
130736
108968
123104
129544
129544
121904
114840
114272
120712
114840
103672
95976
104240
84808
102472
111872
114840
108344
100136
106008
108344
106576
88904
80704
86568
68904
87144
93640
98936
90104
81840
86568
88904
84232
66568
58872
65936
46504
67704
80704


Summary of computational transaction
Raw Input view raw input (R code)
Raw Outputview raw output of R engine
Computing time2 seconds
R ServerBig Analytics Cloud Computing Center

\begin{tabular}{lllllllll}
\hline
Summary of computational transaction \tabularnewline
Raw Input view raw input (R code)  \tabularnewline
Raw Outputview raw output of R engine  \tabularnewline
Computing time2 seconds \tabularnewline
R ServerBig Analytics Cloud Computing Center \tabularnewline
\hline
\end{tabular}
%Source: https://freestatistics.org/blog/index.php?pk=307371&T=0

[TABLE]
[ROW]
Summary of computational transaction[/C][/ROW] [ROW]Raw Input[/C] view raw input (R code) [/C][/ROW] [ROW]Raw Output[/C]view raw output of R engine [/C][/ROW] [ROW]Computing time[/C]2 seconds[/C][/ROW] [ROW]R Server[/C]Big Analytics Cloud Computing Center[/C][/ROW] [/TABLE] Source: https://freestatistics.org/blog/index.php?pk=307371&T=0

Globally Unique Identifier (entire table): ba.freestatistics.org/blog/index.php?pk=307371&T=0

As an alternative you can also use a QR Code:  

The GUIDs for individual cells are displayed in the table below:

Summary of computational transaction
Raw Input view raw input (R code)
Raw Outputview raw output of R engine
Computing time2 seconds
R ServerBig Analytics Cloud Computing Center


Standard Deviation-Mean Plot
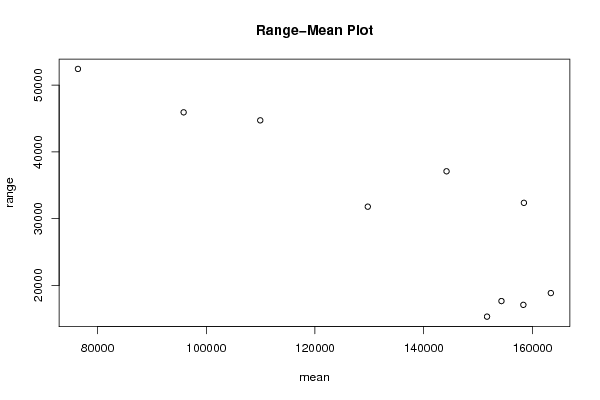
SectionMeanStandard DeviationRange
1151641.3333333335138.8695844573315328
21542925452.6862770898217664
3158318.6666666675348.3910466493417096
4163375.3333333335472.1153186501918864
5158423.3333333339011.262744056732376
614419010743.844918666937104
7129708.6666666678835.4910480745831800
8109929.33333333312314.688741006844736
995842.666666666713751.001850003145936
107640615218.566698728152432

\begin{tabular}{lllllllll}
\hline
Standard Deviation-Mean Plot \tabularnewline
Section & Mean & Standard Deviation & Range \tabularnewline
1 & 151641.333333333 & 5138.86958445733 & 15328 \tabularnewline
2 & 154292 & 5452.68627708982 & 17664 \tabularnewline
3 & 158318.666666667 & 5348.39104664934 & 17096 \tabularnewline
4 & 163375.333333333 & 5472.11531865019 & 18864 \tabularnewline
5 & 158423.333333333 & 9011.2627440567 & 32376 \tabularnewline
6 & 144190 & 10743.8449186669 & 37104 \tabularnewline
7 & 129708.666666667 & 8835.49104807458 & 31800 \tabularnewline
8 & 109929.333333333 & 12314.6887410068 & 44736 \tabularnewline
9 & 95842.6666666667 & 13751.0018500031 & 45936 \tabularnewline
10 & 76406 & 15218.5666987281 & 52432 \tabularnewline
\hline
\end{tabular}
%Source: https://freestatistics.org/blog/index.php?pk=307371&T=1

[TABLE]
[ROW][C]Standard Deviation-Mean Plot[/C][/ROW]
[ROW][C]Section[/C][C]Mean[/C][C]Standard Deviation[/C][C]Range[/C][/ROW]
[ROW][C]1[/C][C]151641.333333333[/C][C]5138.86958445733[/C][C]15328[/C][/ROW]
[ROW][C]2[/C][C]154292[/C][C]5452.68627708982[/C][C]17664[/C][/ROW]
[ROW][C]3[/C][C]158318.666666667[/C][C]5348.39104664934[/C][C]17096[/C][/ROW]
[ROW][C]4[/C][C]163375.333333333[/C][C]5472.11531865019[/C][C]18864[/C][/ROW]
[ROW][C]5[/C][C]158423.333333333[/C][C]9011.2627440567[/C][C]32376[/C][/ROW]
[ROW][C]6[/C][C]144190[/C][C]10743.8449186669[/C][C]37104[/C][/ROW]
[ROW][C]7[/C][C]129708.666666667[/C][C]8835.49104807458[/C][C]31800[/C][/ROW]
[ROW][C]8[/C][C]109929.333333333[/C][C]12314.6887410068[/C][C]44736[/C][/ROW]
[ROW][C]9[/C][C]95842.6666666667[/C][C]13751.0018500031[/C][C]45936[/C][/ROW]
[ROW][C]10[/C][C]76406[/C][C]15218.5666987281[/C][C]52432[/C][/ROW]
[/TABLE]
Source: https://freestatistics.org/blog/index.php?pk=307371&T=1

Globally Unique Identifier (entire table): ba.freestatistics.org/blog/index.php?pk=307371&T=1

As an alternative you can also use a QR Code:  

The GUIDs for individual cells are displayed in the table below:

Standard Deviation-Mean Plot
SectionMeanStandard DeviationRange
1151641.3333333335138.8695844573315328
21542925452.6862770898217664
3158318.6666666675348.3910466493417096
4163375.3333333335472.1153186501918864
5158423.3333333339011.262744056732376
614419010743.844918666937104
7129708.6666666678835.4910480745831800
8109929.33333333312314.688741006844736
995842.666666666713751.001850003145936
107640615218.566698728152432


Regression: S.E.(k) = alpha + beta * Mean(k)
alpha24315.1031380409
beta-0.113151792219188
S.D.0.0185894327362386
T-STAT-6.08688784777213
p-value0.000293686871073616

\begin{tabular}{lllllllll}
\hline
Regression: S.E.(k) = alpha + beta * Mean(k) \tabularnewline
alpha & 24315.1031380409 \tabularnewline
beta & -0.113151792219188 \tabularnewline
S.D. & 0.0185894327362386 \tabularnewline
T-STAT & -6.08688784777213 \tabularnewline
p-value & 0.000293686871073616 \tabularnewline
\hline
\end{tabular}
%Source: https://freestatistics.org/blog/index.php?pk=307371&T=2

[TABLE]
[ROW][C]Regression: S.E.(k) = alpha + beta * Mean(k)[/C][/ROW]
[ROW][C]alpha[/C][C]24315.1031380409[/C][/ROW]
[ROW][C]beta[/C][C]-0.113151792219188[/C][/ROW]
[ROW][C]S.D.[/C][C]0.0185894327362386[/C][/ROW]
[ROW][C]T-STAT[/C][C]-6.08688784777213[/C][/ROW]
[ROW][C]p-value[/C][C]0.000293686871073616[/C][/ROW]
[/TABLE]
Source: https://freestatistics.org/blog/index.php?pk=307371&T=2

Globally Unique Identifier (entire table): ba.freestatistics.org/blog/index.php?pk=307371&T=2

As an alternative you can also use a QR Code:  

The GUIDs for individual cells are displayed in the table below:

Regression: S.E.(k) = alpha + beta * Mean(k)
alpha24315.1031380409
beta-0.113151792219188
S.D.0.0185894327362386
T-STAT-6.08688784777213
p-value0.000293686871073616


Regression: ln S.E.(k) = alpha + beta * ln Mean(k)
alpha25.3649326127075
beta-1.38589065989076
S.D.0.316605261909545
T-STAT-4.37734563074543
p-value0.00235715681397507
Lambda2.38589065989076

\begin{tabular}{lllllllll}
\hline
Regression: ln S.E.(k) = alpha + beta * ln Mean(k) \tabularnewline
alpha & 25.3649326127075 \tabularnewline
beta & -1.38589065989076 \tabularnewline
S.D. & 0.316605261909545 \tabularnewline
T-STAT & -4.37734563074543 \tabularnewline
p-value & 0.00235715681397507 \tabularnewline
Lambda & 2.38589065989076 \tabularnewline
\hline
\end{tabular}
%Source: https://freestatistics.org/blog/index.php?pk=307371&T=3

[TABLE]
[ROW][C]Regression: ln S.E.(k) = alpha + beta * ln Mean(k)[/C][/ROW]
[ROW][C]alpha[/C][C]25.3649326127075[/C][/ROW]
[ROW][C]beta[/C][C]-1.38589065989076[/C][/ROW]
[ROW][C]S.D.[/C][C]0.316605261909545[/C][/ROW]
[ROW][C]T-STAT[/C][C]-4.37734563074543[/C][/ROW]
[ROW][C]p-value[/C][C]0.00235715681397507[/C][/ROW]
[ROW][C]Lambda[/C][C]2.38589065989076[/C][/ROW]
[/TABLE]
Source: https://freestatistics.org/blog/index.php?pk=307371&T=3

Globally Unique Identifier (entire table): ba.freestatistics.org/blog/index.php?pk=307371&T=3

As an alternative you can also use a QR Code:  

The GUIDs for individual cells are displayed in the table below:

Regression: ln S.E.(k) = alpha + beta * ln Mean(k)
alpha25.3649326127075
beta-1.38589065989076
S.D.0.316605261909545
T-STAT-4.37734563074543
p-value0.00235715681397507
Lambda2.38589065989076


Parameters (Session):
par1 = 48 ; par2 = 1 ; par3 = 0 ; par4 = 0 ; par5 = 12 ; par6 = White Noise ; par7 = 0.95 ;
Parameters (R input):
par1 = 12 ;
R code (references can be found in the software module):
par1 <- as.numeric(par1)
(n <- length(x))
(np <- floor(n / par1))
arr <- array(NA,dim=c(par1,np))
j <- 0
k <- 1
for (i in 1:(np*par1))
{
j = j + 1
arr[j,k] <- x[i]
if (j == par1) {
j = 0
k=k+1
}
}
arr
arr.mean <- array(NA,dim=np)
arr.sd <- array(NA,dim=np)
arr.range <- array(NA,dim=np)
for (j in 1:np)
{
arr.mean[j] <- mean(arr[,j],na.rm=TRUE)
arr.sd[j] <- sd(arr[,j],na.rm=TRUE)
arr.range[j] <- max(arr[,j],na.rm=TRUE) - min(arr[,j],na.rm=TRUE)
}
arr.mean
arr.sd
arr.range
(lm1 <- lm(arr.sd~arr.mean))
(lnlm1 <- lm(log(arr.sd)~log(arr.mean)))
(lm2 <- lm(arr.range~arr.mean))
bitmap(file='test1.png')
plot(arr.mean,arr.sd,main='Standard Deviation-Mean Plot',xlab='mean',ylab='standard deviation')
dev.off()
bitmap(file='test2.png')
plot(arr.mean,arr.range,main='Range-Mean Plot',xlab='mean',ylab='range')
dev.off()
load(file='createtable')
a<-table.start()
a<-table.row.start(a)
a<-table.element(a,'Standard Deviation-Mean Plot',4,TRUE)
a<-table.row.end(a)
a<-table.row.start(a)
a<-table.element(a,'Section',header=TRUE)
a<-table.element(a,'Mean',header=TRUE)
a<-table.element(a,'Standard Deviation',header=TRUE)
a<-table.element(a,'Range',header=TRUE)
a<-table.row.end(a)
for (j in 1:np) {
a<-table.row.start(a)
a<-table.element(a,j,header=TRUE)
a<-table.element(a,arr.mean[j])
a<-table.element(a,arr.sd[j] )
a<-table.element(a,arr.range[j] )
a<-table.row.end(a)
}
a<-table.end(a)
table.save(a,file='mytable.tab')
a<-table.start()
a<-table.row.start(a)
a<-table.element(a,'Regression: S.E.(k) = alpha + beta * Mean(k)',2,TRUE)
a<-table.row.end(a)
a<-table.row.start(a)
a<-table.element(a,'alpha',header=TRUE)
a<-table.element(a,lm1$coefficients[[1]])
a<-table.row.end(a)
a<-table.row.start(a)
a<-table.element(a,'beta',header=TRUE)
a<-table.element(a,lm1$coefficients[[2]])
a<-table.row.end(a)
a<-table.row.start(a)
a<-table.element(a,'S.D.',header=TRUE)
a<-table.element(a,summary(lm1)$coefficients[2,2])
a<-table.row.end(a)
a<-table.row.start(a)
a<-table.element(a,'T-STAT',header=TRUE)
a<-table.element(a,summary(lm1)$coefficients[2,3])
a<-table.row.end(a)
a<-table.row.start(a)
a<-table.element(a,'p-value',header=TRUE)
a<-table.element(a,summary(lm1)$coefficients[2,4])
a<-table.row.end(a)
a<-table.end(a)
table.save(a,file='mytable1.tab')
a<-table.start()
a<-table.row.start(a)
a<-table.element(a,'Regression: ln S.E.(k) = alpha + beta * ln Mean(k)',2,TRUE)
a<-table.row.end(a)
a<-table.row.start(a)
a<-table.element(a,'alpha',header=TRUE)
a<-table.element(a,lnlm1$coefficients[[1]])
a<-table.row.end(a)
a<-table.row.start(a)
a<-table.element(a,'beta',header=TRUE)
a<-table.element(a,lnlm1$coefficients[[2]])
a<-table.row.end(a)
a<-table.row.start(a)
a<-table.element(a,'S.D.',header=TRUE)
a<-table.element(a,summary(lnlm1)$coefficients[2,2])
a<-table.row.end(a)
a<-table.row.start(a)
a<-table.element(a,'T-STAT',header=TRUE)
a<-table.element(a,summary(lnlm1)$coefficients[2,3])
a<-table.row.end(a)
a<-table.row.start(a)
a<-table.element(a,'p-value',header=TRUE)
a<-table.element(a,summary(lnlm1)$coefficients[2,4])
a<-table.row.end(a)
a<-table.row.start(a)
a<-table.element(a,'Lambda',header=TRUE)
a<-table.element(a,1-lnlm1$coefficients[[2]])
a<-table.row.end(a)
a<-table.end(a)
table.save(a,file='mytable2.tab')