Free Statistics
of Irreproducible Research!
Description of Statistical Computation | ||||||||||||||||||||||||||||||||||||||||||||||||||||||
|---|---|---|---|---|---|---|---|---|---|---|---|---|---|---|---|---|---|---|---|---|---|---|---|---|---|---|---|---|---|---|---|---|---|---|---|---|---|---|---|---|---|---|---|---|---|---|---|---|---|---|---|---|---|---|
| Author's title | ||||||||||||||||||||||||||||||||||||||||||||||||||||||
| Author | *Unverified author* | |||||||||||||||||||||||||||||||||||||||||||||||||||||
| R Software Module | rwasp_univariatedataseries.wasp | |||||||||||||||||||||||||||||||||||||||||||||||||||||
| Title produced by software | Univariate Data Series | |||||||||||||||||||||||||||||||||||||||||||||||||||||
| Date of computation | Wed, 16 Aug 2017 17:36:28 +0200 | |||||||||||||||||||||||||||||||||||||||||||||||||||||
| Cite this page as follows | Statistical Computations at FreeStatistics.org, Office for Research Development and Education, URL https://freestatistics.org/blog/index.php?v=date/2017/Aug/16/t1502897832t8vj25hf1j847ve.htm/, Retrieved Sat, 11 May 2024 11:24:57 +0000 | |||||||||||||||||||||||||||||||||||||||||||||||||||||
| Statistical Computations at FreeStatistics.org, Office for Research Development and Education, URL https://freestatistics.org/blog/index.php?pk=307427, Retrieved Sat, 11 May 2024 11:24:57 +0000 | ||||||||||||||||||||||||||||||||||||||||||||||||||||||
| QR Codes: | ||||||||||||||||||||||||||||||||||||||||||||||||||||||
|
| ||||||||||||||||||||||||||||||||||||||||||||||||||||||
| Original text written by user: | ||||||||||||||||||||||||||||||||||||||||||||||||||||||
| IsPrivate? | No (this computation is public) | |||||||||||||||||||||||||||||||||||||||||||||||||||||
| User-defined keywords | ||||||||||||||||||||||||||||||||||||||||||||||||||||||
| Estimated Impact | 70 | |||||||||||||||||||||||||||||||||||||||||||||||||||||
Tree of Dependent Computations | ||||||||||||||||||||||||||||||||||||||||||||||||||||||
| Family? (F = Feedback message, R = changed R code, M = changed R Module, P = changed Parameters, D = changed Data) | ||||||||||||||||||||||||||||||||||||||||||||||||||||||
| - [Univariate Data Series] [Aantal verkochte ...] [2017-08-16 15:36:28] [de0d54ff4aa383cef5d270d23e3500df] [Current] | ||||||||||||||||||||||||||||||||||||||||||||||||||||||
| Feedback Forum | ||||||||||||||||||||||||||||||||||||||||||||||||||||||
Post a new message | ||||||||||||||||||||||||||||||||||||||||||||||||||||||
Dataset | ||||||||||||||||||||||||||||||||||||||||||||||||||||||
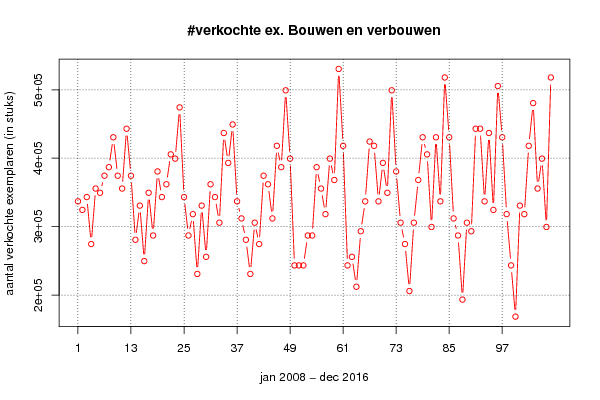
| Dataseries X: | ||||||||||||||||||||||||||||||||||||||||||||||||||||||
336960,00 324480,00 343200,00 274560,00 355680,00 349440,00 374400,00 386880,00 430560,00 374400,00 355680,00 443040,00 374400,00 280800,00 330720,00 249600,00 349440,00 287040,00 380640,00 343200,00 361920,00 405600,00 399360,00 474240,00 343200,00 287040,00 318240,00 230880,00 330720,00 255840,00 361920,00 343200,00 305760,00 436800,00 393120,00 449280,00 336960,00 312000,00 280800,00 230880,00 305760,00 274560,00 374400,00 361920,00 312000,00 418080,00 386880,00 499200,00 399360,00 243360,00 243360,00 243360,00 287040,00 287040,00 386880,00 355680,00 318240,00 399360,00 368160,00 530400,00 418080,00 243360,00 255840,00 212160,00 293280,00 336960,00 424320,00 418080,00 336960,00 393120,00 349440,00 499200,00 380640,00 305760,00 274560,00 205920,00 305760,00 368160,00 430560,00 405600,00 299520,00 430560,00 336960,00 517920,00 430560,00 312000,00 287040,00 193440,00 305760,00 293280,00 443040,00 443040,00 336960,00 436800,00 324480,00 505440,00 430560,00 318240,00 243360,00 168480,00 330720,00 318240,00 418080,00 480480,00 355680,00 399360,00 299520,00 517920,00 | ||||||||||||||||||||||||||||||||||||||||||||||||||||||
Tables (Output of Computation) | ||||||||||||||||||||||||||||||||||||||||||||||||||||||
| ||||||||||||||||||||||||||||||||||||||||||||||||||||||
Figures (Output of Computation) | ||||||||||||||||||||||||||||||||||||||||||||||||||||||
Input Parameters & R Code | ||||||||||||||||||||||||||||||||||||||||||||||||||||||
| Parameters (Session): | ||||||||||||||||||||||||||||||||||||||||||||||||||||||
| Parameters (R input): | ||||||||||||||||||||||||||||||||||||||||||||||||||||||
| par1 = Aantal verkochte exemplaren Bouwen en Verbouwen ; par2 = niet gekend ; par3 = Het aantal verkochte exemplaren van het tijdschrift ; par4 = 12 ; | ||||||||||||||||||||||||||||||||||||||||||||||||||||||
| R code (references can be found in the software module): | ||||||||||||||||||||||||||||||||||||||||||||||||||||||
par4 <- '12' | ||||||||||||||||||||||||||||||||||||||||||||||||||||||