Free Statistics

of Irreproducible Research!

Author's title

Author*Unverified author*
R Software Modulerwasp_univariatedataseries.wasp
Title produced by softwareUnivariate Data Series
Date of computationWed, 16 Aug 2017 18:30:32 +0200
Cite this page as followsStatistical Computations at FreeStatistics.org, Office for Research Development and Education, URL https://freestatistics.org/blog/index.php?v=date/2017/Aug/16/t15029010829br3j07parpiksr.htm/, Retrieved Sat, 11 May 2024 09:46:43 +0200
Statistical Computations at FreeStatistics.org, Office for Research Development and Education, URL https://freestatistics.org/blog/index.php?pk=, Retrieved Sat, 11 May 2024 09:46:43 +0200
QR Codes:

Original text written by user:
IsPrivate?No (this computation is public)
User-defined keywords
Estimated Impact0
Dataseries X:
1263600
1216800
1287000
1029600
1333800
1310400
1404000
1450800
1614600
1404000
1333800
1661400
1404000
1053000
1240200
936000
1310400
1076400
1427400
1287000
1357200
1521000
1497600
1778400
1287000
1076400
1193400
865800
1240200
959400
1357200
1287000
1146600
1638000
1474200
1684800
1263600
1170000
1053000
865800
1146600
1029600
1404000
1357200
1170000
1567800
1450800
1872000
1497600
912600
912600
912600
1076400
1076400
1450800
1333800
1193400
1497600
1380600
1989000
1567800
912600
959400
795600
1099800
1263600
1591200
1567800
1263600
1474200
1310400
1872000
1427400
1146600
1029600
772200
1146600
1380600
1614600
1521000
1123200
1614600
1263600
1942200
1614600
1170000
1076400
725400
1146600
1099800
1661400
1661400
1263600
1638000
1216800
1895400
1614600
1193400
912600
631800
1240200
1193400
1567800
1801800
1333800
1497600
1123200
1942200


Summary of computational transaction
Raw Input view raw input (R code)
Raw Outputview raw output of R engine
Computing time1 seconds
R ServerBig Analytics Cloud Computing Center

\begin{tabular}{lllllllll}
\hline
Summary of computational transaction \tabularnewline
Raw Input view raw input (R code)  \tabularnewline
Raw Outputview raw output of R engine  \tabularnewline
Computing time1 seconds \tabularnewline
R ServerBig Analytics Cloud Computing Center \tabularnewline
\hline
\end{tabular}
%Source: https://freestatistics.org/blog/index.php?pk=&T=0

[TABLE]
[ROW]
Summary of computational transaction[/C][/ROW] [ROW]Raw Input[/C] view raw input (R code) [/C][/ROW] [ROW]Raw Output[/C]view raw output of R engine [/C][/ROW] [ROW]Computing time[/C]1 seconds[/C][/ROW] [ROW]R Server[/C]Big Analytics Cloud Computing Center[/C][/ROW] [/TABLE] Source: https://freestatistics.org/blog/index.php?pk=&T=0

Globally Unique Identifier (entire table): ba.freestatistics.org/blog/index.php?pk=&T=0

As an alternative you can also use a QR Code:  

The GUIDs for individual cells are displayed in the table below:

Summary of computational transaction
Raw Input view raw input (R code)
Raw Outputview raw output of R engine
Computing time1 seconds
R ServerBig Analytics Cloud Computing Center


Univariate Dataseries
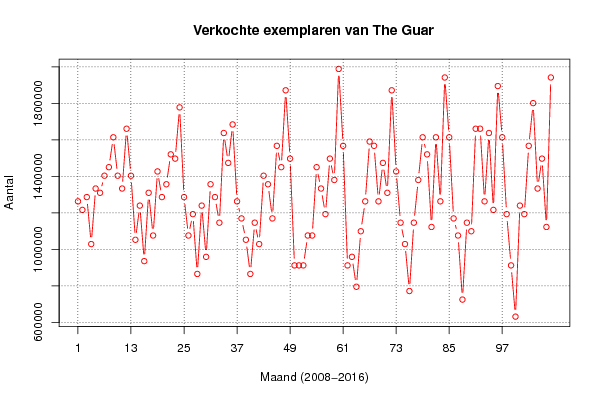
Name of dataseriesAantal verkochte exemplaren van The Guardian
Sourceonbekend
DescriptionMaandelijkse aantal verkochte exemplaren van The Guardian, van januari 2008 tot en met december 2016
Number of observations108

\begin{tabular}{lllllllll}
\hline
Univariate Dataseries \tabularnewline
Name of dataseries & Aantal verkochte exemplaren van The Guardian \tabularnewline
Source & onbekend \tabularnewline
Description & Maandelijkse aantal verkochte exemplaren van The Guardian, van januari 2008 tot en met december 2016 \tabularnewline
Number of observations & 108 \tabularnewline
\hline
\end{tabular}
%Source: https://freestatistics.org/blog/index.php?pk=&T=1

[TABLE]
[ROW][C]Univariate Dataseries[/C][/ROW]
[ROW][C]Name of dataseries[/C][C]Aantal verkochte exemplaren van The Guardian[/C][/ROW]
[ROW][C]Source[/C][C]onbekend[/C][/ROW]
[ROW][C]Description[/C][C]Maandelijkse aantal verkochte exemplaren van The Guardian, van januari 2008 tot en met december 2016[/C][/ROW]
[ROW][C]Number of observations[/C][C]108[/C][/ROW]
[/TABLE]
Source: https://freestatistics.org/blog/index.php?pk=&T=1

Globally Unique Identifier (entire table): ba.freestatistics.org/blog/index.php?pk=&T=1

As an alternative you can also use a QR Code:  

The GUIDs for individual cells are displayed in the table below:

Univariate Dataseries
Name of dataseriesAantal verkochte exemplaren van The Guardian
Sourceonbekend
DescriptionMaandelijkse aantal verkochte exemplaren van The Guardian, van januari 2008 tot en met december 2016
Number of observations108


Summary Statistics of dataseries x
> summary(x)
   Min. 1st Qu.  Median    Mean 3rd Qu.    Max. 
 631800 1123200 1287000 1313650 1497600 1989000 

\begin{tabular}{lllllllll}
\hline
Summary Statistics of dataseries x \tabularnewline
> summary(x)
   Min. 1st Qu.  Median    Mean 3rd Qu.    Max. 
 631800 1123200 1287000 1313650 1497600 1989000 
\tabularnewline \hline \end{tabular} %Source: https://freestatistics.org/blog/index.php?pk=&T=2

[TABLE]
[ROW][C]Summary Statistics of dataseries x[/C][/ROW]
[ROW][C]
> summary(x)
   Min. 1st Qu.  Median    Mean 3rd Qu.    Max. 
 631800 1123200 1287000 1313650 1497600 1989000 
[/C][/ROW] [/TABLE] Source: https://freestatistics.org/blog/index.php?pk=&T=2

Globally Unique Identifier (entire table): ba.freestatistics.org/blog/index.php?pk=&T=2

As an alternative you can also use a QR Code:  

The GUIDs for individual cells are displayed in the table below:

Summary Statistics of dataseries x
> summary(x)
   Min. 1st Qu.  Median    Mean 3rd Qu.    Max. 
 631800 1123200 1287000 1313650 1497600 1989000 


Parameters (Session):
par1 = Aantal verkochte exemplaren van The Guardian ; par2 = onbekend ; par3 = Maandelijkse aantal verkochte exemplaren van The Guardian, van januari 2008 tot en met december 2016 ; par4 = 12 ;
Parameters (R input):
par1 = Aantal verkochte exemplaren van The Guardian ; par2 = onbekend ; par3 = Maandelijkse aantal verkochte exemplaren van The Guardian, van januari 2008 tot en met december 2016 ; par4 = 12 ;
R code (references can be found in the software module):
if (par4 != 'No season') {
par4 <- as.numeric(par4)
if (par4 < 4) par4 <- 12
}
summary(x)
n <- length(x)
bitmap(file='test1.png')
if (par4=='No season') {
plot(x,col=2,type='b',main=main,xlab=xlab,ylab=ylab,xaxt='n')
axis(1,at=seq(1,n,10))
}
if (par4!='No season') {
plot(x,col=2,type='b',main=main,xlab=xlab,ylab=ylab,xaxt='n')
axis(1,at=seq(1,n,par4))
grid(nx=0,ny=NULL,col='black')
abline(v=seq(1,n,par4),col='black',lty='dotted')
}
dev.off()
load(file='createtable')
a<-table.start()
a<-table.row.start(a)
a<-table.element(a,'Univariate Dataseries',2,TRUE)
a<-table.row.end(a)
a<-table.row.start(a)
a<-table.element(a,'Name of dataseries',header=TRUE)
a<-table.element(a,par1)
a<-table.row.end(a)
a<-table.row.start(a)
a<-table.element(a,'Source',header=TRUE)
a<-table.element(a,par2)
a<-table.row.end(a)
a<-table.row.start(a)
a<-table.element(a,'Description',header=TRUE)
a<-table.element(a,par3)
a<-table.row.end(a)
a<-table.row.start(a)
a<-table.element(a,'Number of observations',header=TRUE)
a<-table.element(a,length(x))
a<-table.row.end(a)
a<-table.end(a)
table.save(a,file='mytable.tab')
a<-table.start()
a<-table.row.start(a)
a<-table.element(a,'Summary Statistics of dataseries x',1,TRUE)
a<-table.row.end(a)
a<-table.row.start(a)
a<-table.element(a,paste('
',RC.texteval('summary(x)'),'
',sep=''))
a<-table.row.end(a)
a<-table.end(a)
table.save(a,file='mytable1.tab')