Free Statistics

of Irreproducible Research!

Author's title

Author*Unverified author*
R Software Modulerwasp_smp.wasp
Title produced by softwareStandard Deviation-Mean Plot
Date of computationWed, 16 Aug 2017 18:38:41 +0200
Cite this page as followsStatistical Computations at FreeStatistics.org, Office for Research Development and Education, URL https://freestatistics.org/blog/index.php?v=date/2017/Aug/16/t15029015832dof6kil53ql5o5.htm/, Retrieved Sat, 11 May 2024 06:06:14 +0000
Statistical Computations at FreeStatistics.org, Office for Research Development and Education, URL https://freestatistics.org/blog/index.php?pk=307450, Retrieved Sat, 11 May 2024 06:06:14 +0000
QR Codes:

Original text written by user:
IsPrivate?No (this computation is public)
User-defined keywords
Estimated Impact80
Family? (F = Feedback message, R = changed R code, M = changed R Module, P = changed Parameters, D = changed Data)
-       [Standard Deviation-Mean Plot] [standard deviatio...] [2017-08-16 16:38:41] [7f8e680169e3605c7c9c65666ad372ce] [Current]
Feedback Forum

Post a new message
Dataseries X:
64800
62400
66000
52800
68400
67200
72000
74400
82800
72000
68400
85200
72000
54000
63600
48000
67200
55200
73200
66000
69600
78000
76800
91200
66000
55200
61200
44400
63600
49200
69600
66000
58800
84000
75600
86400
64800
60000
54000
44400
58800
52800
72000
69600
60000
80400
74400
96000
76800
46800
46800
46800
55200
55200
74400
68400
61200
76800
70800
102000
80400
46800
49200
40800
56400
64800
81600
80400
64800
75600
67200
96000
73200
58800
52800
39600
58800
70800
82800
78000
57600
82800
64800
99600
82800
60000
55200
37200
58800
56400
85200
85200
64800
84000
62400
97200
82800
61200
46800

32400
63600
61200
80400
92400
68400
76800
57600
99600


Summary of computational transaction
Raw Input view raw input (R code)
Raw Outputview raw output of R engine
Computing time1 seconds
R ServerBig Analytics Cloud Computing Center
R Framework error message
Warning: there are blank lines in the 'Data' field.
Please, use NA for missing data - blank lines are simply
 deleted and are NOT treated as missing values.

\begin{tabular}{lllllllll}
\hline
Summary of computational transaction \tabularnewline
Raw Input view raw input (R code)  \tabularnewline
Raw Outputview raw output of R engine  \tabularnewline
Computing time1 seconds \tabularnewline
R ServerBig Analytics Cloud Computing Center \tabularnewline
R Framework error message & 
Warning: there are blank lines in the 'Data' field.
Please, use NA for missing data - blank lines are simply
 deleted and are NOT treated as missing values.
\tabularnewline \hline \end{tabular} %Source: https://freestatistics.org/blog/index.php?pk=307450&T=0

[TABLE]
[ROW]
Summary of computational transaction[/C][/ROW] [ROW]Raw Input[/C] view raw input (R code) [/C][/ROW] [ROW]Raw Output[/C]view raw output of R engine [/C][/ROW] [ROW]Computing time[/C]1 seconds[/C][/ROW] [ROW]R Server[/C]Big Analytics Cloud Computing Center[/C][/ROW] [ROW]R Framework error message[/C][C]
Warning: there are blank lines in the 'Data' field.
Please, use NA for missing data - blank lines are simply
 deleted and are NOT treated as missing values.
[/C][/ROW] [/TABLE] Source: https://freestatistics.org/blog/index.php?pk=307450&T=0

Globally Unique Identifier (entire table): ba.freestatistics.org/blog/index.php?pk=307450&T=0

As an alternative you can also use a QR Code:  

The GUIDs for individual cells are displayed in the table below:

Summary of computational transaction
Raw Input view raw input (R code)
Raw Outputview raw output of R engine
Computing time1 seconds
R ServerBig Analytics Cloud Computing Center
R Framework error message
Warning: there are blank lines in the 'Data' field.
Please, use NA for missing data - blank lines are simply
 deleted and are NOT treated as missing values.


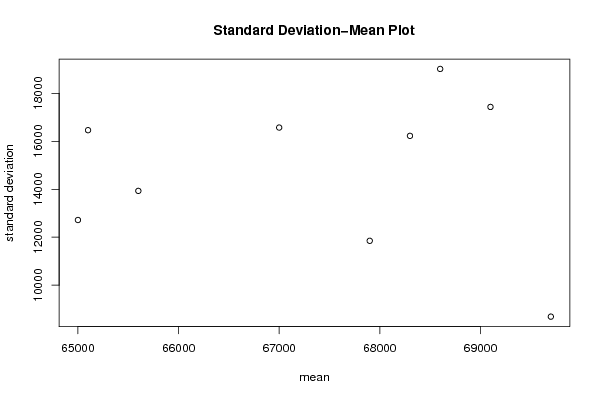
Standard Deviation-Mean Plot
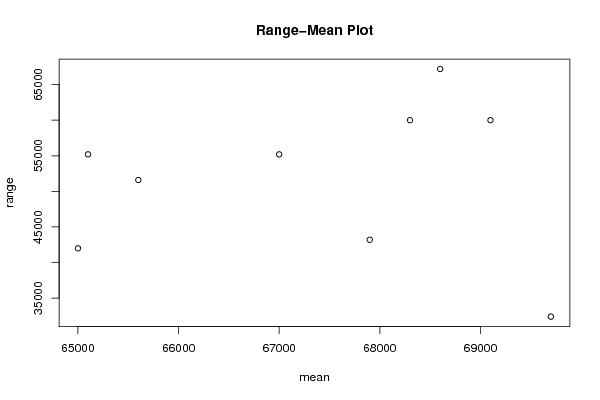
SectionMeanStandard DeviationRange
1697008690.4336119457432400
26790011851.352051751143200
36500012718.490476467742000
46560013931.781847794851600
56510016462.519413945955200
66700016571.168829133255200
76830016224.89669388660000
86910017430.693930796160000
96860019013.870535145567200

\begin{tabular}{lllllllll}
\hline
Standard Deviation-Mean Plot \tabularnewline
Section & Mean & Standard Deviation & Range \tabularnewline
1 & 69700 & 8690.43361194574 & 32400 \tabularnewline
2 & 67900 & 11851.3520517511 & 43200 \tabularnewline
3 & 65000 & 12718.4904764677 & 42000 \tabularnewline
4 & 65600 & 13931.7818477948 & 51600 \tabularnewline
5 & 65100 & 16462.5194139459 & 55200 \tabularnewline
6 & 67000 & 16571.1688291332 & 55200 \tabularnewline
7 & 68300 & 16224.896693886 & 60000 \tabularnewline
8 & 69100 & 17430.6939307961 & 60000 \tabularnewline
9 & 68600 & 19013.8705351455 & 67200 \tabularnewline
\hline
\end{tabular}
%Source: https://freestatistics.org/blog/index.php?pk=307450&T=1

[TABLE]
[ROW][C]Standard Deviation-Mean Plot[/C][/ROW]
[ROW][C]Section[/C][C]Mean[/C][C]Standard Deviation[/C][C]Range[/C][/ROW]
[ROW][C]1[/C][C]69700[/C][C]8690.43361194574[/C][C]32400[/C][/ROW]
[ROW][C]2[/C][C]67900[/C][C]11851.3520517511[/C][C]43200[/C][/ROW]
[ROW][C]3[/C][C]65000[/C][C]12718.4904764677[/C][C]42000[/C][/ROW]
[ROW][C]4[/C][C]65600[/C][C]13931.7818477948[/C][C]51600[/C][/ROW]
[ROW][C]5[/C][C]65100[/C][C]16462.5194139459[/C][C]55200[/C][/ROW]
[ROW][C]6[/C][C]67000[/C][C]16571.1688291332[/C][C]55200[/C][/ROW]
[ROW][C]7[/C][C]68300[/C][C]16224.896693886[/C][C]60000[/C][/ROW]
[ROW][C]8[/C][C]69100[/C][C]17430.6939307961[/C][C]60000[/C][/ROW]
[ROW][C]9[/C][C]68600[/C][C]19013.8705351455[/C][C]67200[/C][/ROW]
[/TABLE]
Source: https://freestatistics.org/blog/index.php?pk=307450&T=1

Globally Unique Identifier (entire table): ba.freestatistics.org/blog/index.php?pk=307450&T=1

As an alternative you can also use a QR Code:  

The GUIDs for individual cells are displayed in the table below:

Standard Deviation-Mean Plot
SectionMeanStandard DeviationRange
1697008690.4336119457432400
26790011851.352051751143200
36500012718.490476467742000
46560013931.781847794851600
56510016462.519413945955200
66700016571.168829133255200
76830016224.89669388660000
86910017430.693930796160000
96860019013.870535145567200


Regression: S.E.(k) = alpha + beta * Mean(k)
alpha22004.5691138069
beta-0.107448317059865
S.D.0.68875700161761
T-STAT-0.156003230177716
p-value0.88043412050898

\begin{tabular}{lllllllll}
\hline
Regression: S.E.(k) = alpha + beta * Mean(k) \tabularnewline
alpha & 22004.5691138069 \tabularnewline
beta & -0.107448317059865 \tabularnewline
S.D. & 0.68875700161761 \tabularnewline
T-STAT & -0.156003230177716 \tabularnewline
p-value & 0.88043412050898 \tabularnewline
\hline
\end{tabular}
%Source: https://freestatistics.org/blog/index.php?pk=307450&T=2

[TABLE]
[ROW][C]Regression: S.E.(k) = alpha + beta * Mean(k)[/C][/ROW]
[ROW][C]alpha[/C][C]22004.5691138069[/C][/ROW]
[ROW][C]beta[/C][C]-0.107448317059865[/C][/ROW]
[ROW][C]S.D.[/C][C]0.68875700161761[/C][/ROW]
[ROW][C]T-STAT[/C][C]-0.156003230177716[/C][/ROW]
[ROW][C]p-value[/C][C]0.88043412050898[/C][/ROW]
[/TABLE]
Source: https://freestatistics.org/blog/index.php?pk=307450&T=2

Globally Unique Identifier (entire table): ba.freestatistics.org/blog/index.php?pk=307450&T=2

As an alternative you can also use a QR Code:  

The GUIDs for individual cells are displayed in the table below:

Regression: S.E.(k) = alpha + beta * Mean(k)
alpha22004.5691138069
beta-0.107448317059865
S.D.0.68875700161761
T-STAT-0.156003230177716
p-value0.88043412050898


Regression: ln S.E.(k) = alpha + beta * ln Mean(k)
alpha23.9877344405556
beta-1.29633550728171
S.D.3.45582772786257
T-STAT-0.375115778147742
p-value0.718681736243493
Lambda2.29633550728171

\begin{tabular}{lllllllll}
\hline
Regression: ln S.E.(k) = alpha + beta * ln Mean(k) \tabularnewline
alpha & 23.9877344405556 \tabularnewline
beta & -1.29633550728171 \tabularnewline
S.D. & 3.45582772786257 \tabularnewline
T-STAT & -0.375115778147742 \tabularnewline
p-value & 0.718681736243493 \tabularnewline
Lambda & 2.29633550728171 \tabularnewline
\hline
\end{tabular}
%Source: https://freestatistics.org/blog/index.php?pk=307450&T=3

[TABLE]
[ROW][C]Regression: ln S.E.(k) = alpha + beta * ln Mean(k)[/C][/ROW]
[ROW][C]alpha[/C][C]23.9877344405556[/C][/ROW]
[ROW][C]beta[/C][C]-1.29633550728171[/C][/ROW]
[ROW][C]S.D.[/C][C]3.45582772786257[/C][/ROW]
[ROW][C]T-STAT[/C][C]-0.375115778147742[/C][/ROW]
[ROW][C]p-value[/C][C]0.718681736243493[/C][/ROW]
[ROW][C]Lambda[/C][C]2.29633550728171[/C][/ROW]
[/TABLE]
Source: https://freestatistics.org/blog/index.php?pk=307450&T=3

Globally Unique Identifier (entire table): ba.freestatistics.org/blog/index.php?pk=307450&T=3

As an alternative you can also use a QR Code:  

The GUIDs for individual cells are displayed in the table below:

Regression: ln S.E.(k) = alpha + beta * ln Mean(k)
alpha23.9877344405556
beta-1.29633550728171
S.D.3.45582772786257
T-STAT-0.375115778147742
p-value0.718681736243493
Lambda2.29633550728171


Parameters (Session):
par1 = 126012 ; par2 = 1 ; par3 = 0 ; par4 = 0 ; par5 = 12 ; par6 = White Noise ; par7 = 0.95 ;
Parameters (R input):
par1 = 12 ;
R code (references can be found in the software module):
par1 <- as.numeric(par1)
(n <- length(x))
(np <- floor(n / par1))
arr <- array(NA,dim=c(par1,np))
j <- 0
k <- 1
for (i in 1:(np*par1))
{
j = j + 1
arr[j,k] <- x[i]
if (j == par1) {
j = 0
k=k+1
}
}
arr
arr.mean <- array(NA,dim=np)
arr.sd <- array(NA,dim=np)
arr.range <- array(NA,dim=np)
for (j in 1:np)
{
arr.mean[j] <- mean(arr[,j],na.rm=TRUE)
arr.sd[j] <- sd(arr[,j],na.rm=TRUE)
arr.range[j] <- max(arr[,j],na.rm=TRUE) - min(arr[,j],na.rm=TRUE)
}
arr.mean
arr.sd
arr.range
(lm1 <- lm(arr.sd~arr.mean))
(lnlm1 <- lm(log(arr.sd)~log(arr.mean)))
(lm2 <- lm(arr.range~arr.mean))
bitmap(file='test1.png')
plot(arr.mean,arr.sd,main='Standard Deviation-Mean Plot',xlab='mean',ylab='standard deviation')
dev.off()
bitmap(file='test2.png')
plot(arr.mean,arr.range,main='Range-Mean Plot',xlab='mean',ylab='range')
dev.off()
load(file='createtable')
a<-table.start()
a<-table.row.start(a)
a<-table.element(a,'Standard Deviation-Mean Plot',4,TRUE)
a<-table.row.end(a)
a<-table.row.start(a)
a<-table.element(a,'Section',header=TRUE)
a<-table.element(a,'Mean',header=TRUE)
a<-table.element(a,'Standard Deviation',header=TRUE)
a<-table.element(a,'Range',header=TRUE)
a<-table.row.end(a)
for (j in 1:np) {
a<-table.row.start(a)
a<-table.element(a,j,header=TRUE)
a<-table.element(a,arr.mean[j])
a<-table.element(a,arr.sd[j] )
a<-table.element(a,arr.range[j] )
a<-table.row.end(a)
}
a<-table.end(a)
table.save(a,file='mytable.tab')
a<-table.start()
a<-table.row.start(a)
a<-table.element(a,'Regression: S.E.(k) = alpha + beta * Mean(k)',2,TRUE)
a<-table.row.end(a)
a<-table.row.start(a)
a<-table.element(a,'alpha',header=TRUE)
a<-table.element(a,lm1$coefficients[[1]])
a<-table.row.end(a)
a<-table.row.start(a)
a<-table.element(a,'beta',header=TRUE)
a<-table.element(a,lm1$coefficients[[2]])
a<-table.row.end(a)
a<-table.row.start(a)
a<-table.element(a,'S.D.',header=TRUE)
a<-table.element(a,summary(lm1)$coefficients[2,2])
a<-table.row.end(a)
a<-table.row.start(a)
a<-table.element(a,'T-STAT',header=TRUE)
a<-table.element(a,summary(lm1)$coefficients[2,3])
a<-table.row.end(a)
a<-table.row.start(a)
a<-table.element(a,'p-value',header=TRUE)
a<-table.element(a,summary(lm1)$coefficients[2,4])
a<-table.row.end(a)
a<-table.end(a)
table.save(a,file='mytable1.tab')
a<-table.start()
a<-table.row.start(a)
a<-table.element(a,'Regression: ln S.E.(k) = alpha + beta * ln Mean(k)',2,TRUE)
a<-table.row.end(a)
a<-table.row.start(a)
a<-table.element(a,'alpha',header=TRUE)
a<-table.element(a,lnlm1$coefficients[[1]])
a<-table.row.end(a)
a<-table.row.start(a)
a<-table.element(a,'beta',header=TRUE)
a<-table.element(a,lnlm1$coefficients[[2]])
a<-table.row.end(a)
a<-table.row.start(a)
a<-table.element(a,'S.D.',header=TRUE)
a<-table.element(a,summary(lnlm1)$coefficients[2,2])
a<-table.row.end(a)
a<-table.row.start(a)
a<-table.element(a,'T-STAT',header=TRUE)
a<-table.element(a,summary(lnlm1)$coefficients[2,3])
a<-table.row.end(a)
a<-table.row.start(a)
a<-table.element(a,'p-value',header=TRUE)
a<-table.element(a,summary(lnlm1)$coefficients[2,4])
a<-table.row.end(a)
a<-table.row.start(a)
a<-table.element(a,'Lambda',header=TRUE)
a<-table.element(a,1-lnlm1$coefficients[[2]])
a<-table.row.end(a)
a<-table.end(a)
table.save(a,file='mytable2.tab')