Free Statistics

of Irreproducible Research!

Author's title

Author*Unverified author*
R Software Modulerwasp_smp.wasp
Title produced by softwareStandard Deviation-Mean Plot
Date of computationWed, 16 Aug 2017 18:58:16 +0200
Cite this page as followsStatistical Computations at FreeStatistics.org, Office for Research Development and Education, URL https://freestatistics.org/blog/index.php?v=date/2017/Aug/16/t1502902991x5xhs53a5jc5i0e.htm/, Retrieved Sun, 12 May 2024 04:47:09 +0000
Statistical Computations at FreeStatistics.org, Office for Research Development and Education, URL https://freestatistics.org/blog/index.php?pk=307467, Retrieved Sun, 12 May 2024 04:47:09 +0000
QR Codes:

Original text written by user:
IsPrivate?No (this computation is public)
User-defined keywords
Estimated Impact117
Family? (F = Feedback message, R = changed R code, M = changed R Module, P = changed Parameters, D = changed Data)
-     [Univariate Data Series] [Omzet Mercedes A-...] [2017-08-09 17:08:27] [761e4adbe8124e6083bfb711aef3fb41]
- RMPD  [(Partial) Autocorrelation Function] [] [2017-08-10 00:37:55] [761e4adbe8124e6083bfb711aef3fb41]
- RMP     [Classical Decomposition] [] [2017-08-16 12:59:43] [761e4adbe8124e6083bfb711aef3fb41]
- RMPD      [Kernel Density Estimation] [] [2017-08-16 15:21:22] [761e4adbe8124e6083bfb711aef3fb41]
- RMP           [Standard Deviation-Mean Plot] [] [2017-08-16 16:58:16] [35d4184f59ec62fac19bf382c4afaa07] [Current]
Feedback Forum

Post a new message
Dataseries X:
982800
946400
1001000
800800
1037400
1019200
1092000
1128400
1255800
1092000
1037400
1292200
1092000
819000
964600
728000
1019200
837200
1110200
1001000
1055600
1183000
1164800
1383200
1001000
837200
928200
673400
964600
746200
1055600
1001000
891800
1274000
1146600
1310400
982800
910000
819000
673400
891800
800800
1092000
1055600
910000
1219400
1128400
1456000
1164800
709800
709800
709800
837200
837200
1128400
1037400
928200
1164800
1073800
1547000
1219400
709800
746200
618800
855400
982800
1237600
1219400
982800
1146600
1019200
1456000
1110200
891800
800800
600600
891800
1073800
1255800
1183000
873600
1255800
982800
1510600
1255800
910000
837200
564200
891800
855400
1292200
1292200
982800
1274000
946400
1474200
1255800
928200
709800
491400
964600
928200
1219400
1401400
1037400
1164800
873600
1510600


Summary of computational transaction
Raw Input view raw input (R code)
Raw Outputview raw output of R engine
Computing time1 seconds
R ServerBig Analytics Cloud Computing Center

\begin{tabular}{lllllllll}
\hline
Summary of computational transaction \tabularnewline
Raw Input view raw input (R code)  \tabularnewline
Raw Outputview raw output of R engine  \tabularnewline
Computing time1 seconds \tabularnewline
R ServerBig Analytics Cloud Computing Center \tabularnewline
\hline
\end{tabular}
%Source: https://freestatistics.org/blog/index.php?pk=307467&T=0

[TABLE]
[ROW]
Summary of computational transaction[/C][/ROW] [ROW]Raw Input[/C] view raw input (R code) [/C][/ROW] [ROW]Raw Output[/C]view raw output of R engine [/C][/ROW] [ROW]Computing time[/C]1 seconds[/C][/ROW] [ROW]R Server[/C]Big Analytics Cloud Computing Center[/C][/ROW] [/TABLE] Source: https://freestatistics.org/blog/index.php?pk=307467&T=0

Globally Unique Identifier (entire table): ba.freestatistics.org/blog/index.php?pk=307467&T=0

As an alternative you can also use a QR Code:  

The GUIDs for individual cells are displayed in the table below:

Summary of computational transaction
Raw Input view raw input (R code)
Raw Outputview raw output of R engine
Computing time1 seconds
R ServerBig Analytics Cloud Computing Center


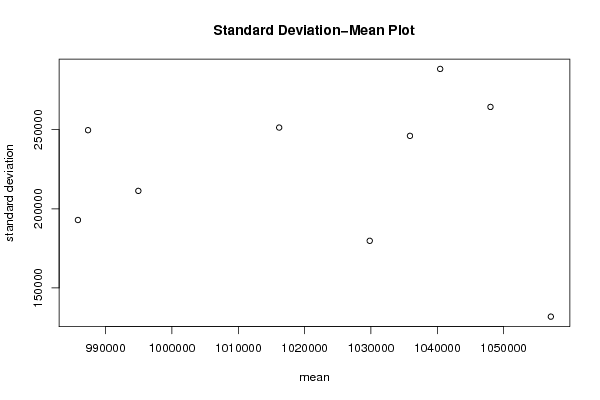
Standard Deviation-Mean Plot
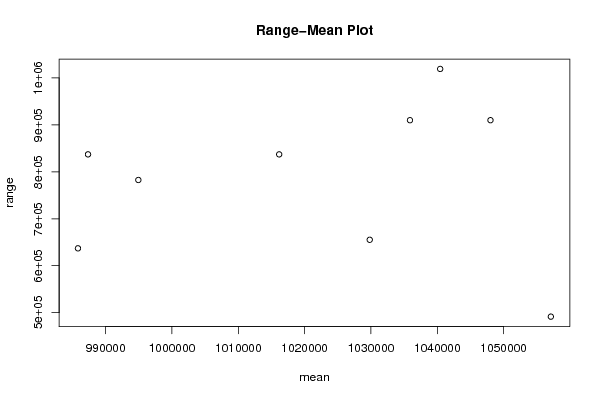
SectionMeanStandard DeviationRange
11057116.66666667131804.909781177491400
21029816.66666667179745.506118225655200
3985833.333333333192897.10555976637000
4994933.333333333211298.691358222782600
5987350249681.544444846837200
61016166.66666667251329.39390852837200
71035883.33333333246077.599857271910000
81048016.66666667264365.524617074910000
91040433.33333333288377.0364497061019200

\begin{tabular}{lllllllll}
\hline
Standard Deviation-Mean Plot \tabularnewline
Section & Mean & Standard Deviation & Range \tabularnewline
1 & 1057116.66666667 & 131804.909781177 & 491400 \tabularnewline
2 & 1029816.66666667 & 179745.506118225 & 655200 \tabularnewline
3 & 985833.333333333 & 192897.10555976 & 637000 \tabularnewline
4 & 994933.333333333 & 211298.691358222 & 782600 \tabularnewline
5 & 987350 & 249681.544444846 & 837200 \tabularnewline
6 & 1016166.66666667 & 251329.39390852 & 837200 \tabularnewline
7 & 1035883.33333333 & 246077.599857271 & 910000 \tabularnewline
8 & 1048016.66666667 & 264365.524617074 & 910000 \tabularnewline
9 & 1040433.33333333 & 288377.036449706 & 1019200 \tabularnewline
\hline
\end{tabular}
%Source: https://freestatistics.org/blog/index.php?pk=307467&T=1

[TABLE]
[ROW][C]Standard Deviation-Mean Plot[/C][/ROW]
[ROW][C]Section[/C][C]Mean[/C][C]Standard Deviation[/C][C]Range[/C][/ROW]
[ROW][C]1[/C][C]1057116.66666667[/C][C]131804.909781177[/C][C]491400[/C][/ROW]
[ROW][C]2[/C][C]1029816.66666667[/C][C]179745.506118225[/C][C]655200[/C][/ROW]
[ROW][C]3[/C][C]985833.333333333[/C][C]192897.10555976[/C][C]637000[/C][/ROW]
[ROW][C]4[/C][C]994933.333333333[/C][C]211298.691358222[/C][C]782600[/C][/ROW]
[ROW][C]5[/C][C]987350[/C][C]249681.544444846[/C][C]837200[/C][/ROW]
[ROW][C]6[/C][C]1016166.66666667[/C][C]251329.39390852[/C][C]837200[/C][/ROW]
[ROW][C]7[/C][C]1035883.33333333[/C][C]246077.599857271[/C][C]910000[/C][/ROW]
[ROW][C]8[/C][C]1048016.66666667[/C][C]264365.524617074[/C][C]910000[/C][/ROW]
[ROW][C]9[/C][C]1040433.33333333[/C][C]288377.036449706[/C][C]1019200[/C][/ROW]
[/TABLE]
Source: https://freestatistics.org/blog/index.php?pk=307467&T=1

Globally Unique Identifier (entire table): ba.freestatistics.org/blog/index.php?pk=307467&T=1

As an alternative you can also use a QR Code:  

The GUIDs for individual cells are displayed in the table below:

Standard Deviation-Mean Plot
SectionMeanStandard DeviationRange
11057116.66666667131804.909781177491400
21029816.66666667179745.506118225655200
3985833.333333333192897.10555976637000
4994933.333333333211298.691358222782600
5987350249681.544444846837200
61016166.66666667251329.39390852837200
71035883.33333333246077.599857271910000
81048016.66666667264365.524617074910000
91040433.33333333288377.0364497061019200


Regression: S.E.(k) = alpha + beta * Mean(k)
alpha333735.964892738
beta-0.107448317059865
S.D.0.68875700161761
T-STAT-0.156003230177715
p-value0.880434120508981

\begin{tabular}{lllllllll}
\hline
Regression: S.E.(k) = alpha + beta * Mean(k) \tabularnewline
alpha & 333735.964892738 \tabularnewline
beta & -0.107448317059865 \tabularnewline
S.D. & 0.68875700161761 \tabularnewline
T-STAT & -0.156003230177715 \tabularnewline
p-value & 0.880434120508981 \tabularnewline
\hline
\end{tabular}
%Source: https://freestatistics.org/blog/index.php?pk=307467&T=2

[TABLE]
[ROW][C]Regression: S.E.(k) = alpha + beta * Mean(k)[/C][/ROW]
[ROW][C]alpha[/C][C]333735.964892738[/C][/ROW]
[ROW][C]beta[/C][C]-0.107448317059865[/C][/ROW]
[ROW][C]S.D.[/C][C]0.68875700161761[/C][/ROW]
[ROW][C]T-STAT[/C][C]-0.156003230177715[/C][/ROW]
[ROW][C]p-value[/C][C]0.880434120508981[/C][/ROW]
[/TABLE]
Source: https://freestatistics.org/blog/index.php?pk=307467&T=2

Globally Unique Identifier (entire table): ba.freestatistics.org/blog/index.php?pk=307467&T=2

As an alternative you can also use a QR Code:  

The GUIDs for individual cells are displayed in the table below:

Regression: S.E.(k) = alpha + beta * Mean(k)
alpha333735.964892738
beta-0.107448317059865
S.D.0.68875700161761
T-STAT-0.156003230177715
p-value0.880434120508981


Regression: ln S.E.(k) = alpha + beta * ln Mean(k)
alpha30.231700404035
beta-1.29633550728187
S.D.3.4558277278626
T-STAT-0.375115778147784
p-value0.718681736243463
Lambda2.29633550728187

\begin{tabular}{lllllllll}
\hline
Regression: ln S.E.(k) = alpha + beta * ln Mean(k) \tabularnewline
alpha & 30.231700404035 \tabularnewline
beta & -1.29633550728187 \tabularnewline
S.D. & 3.4558277278626 \tabularnewline
T-STAT & -0.375115778147784 \tabularnewline
p-value & 0.718681736243463 \tabularnewline
Lambda & 2.29633550728187 \tabularnewline
\hline
\end{tabular}
%Source: https://freestatistics.org/blog/index.php?pk=307467&T=3

[TABLE]
[ROW][C]Regression: ln S.E.(k) = alpha + beta * ln Mean(k)[/C][/ROW]
[ROW][C]alpha[/C][C]30.231700404035[/C][/ROW]
[ROW][C]beta[/C][C]-1.29633550728187[/C][/ROW]
[ROW][C]S.D.[/C][C]3.4558277278626[/C][/ROW]
[ROW][C]T-STAT[/C][C]-0.375115778147784[/C][/ROW]
[ROW][C]p-value[/C][C]0.718681736243463[/C][/ROW]
[ROW][C]Lambda[/C][C]2.29633550728187[/C][/ROW]
[/TABLE]
Source: https://freestatistics.org/blog/index.php?pk=307467&T=3

Globally Unique Identifier (entire table): ba.freestatistics.org/blog/index.php?pk=307467&T=3

As an alternative you can also use a QR Code:  

The GUIDs for individual cells are displayed in the table below:

Regression: ln S.E.(k) = alpha + beta * ln Mean(k)
alpha30.231700404035
beta-1.29633550728187
S.D.3.4558277278626
T-STAT-0.375115778147784
p-value0.718681736243463
Lambda2.29633550728187


Parameters (Session):
par1 = 12 ;
Parameters (R input):
par1 = 12 ;
R code (references can be found in the software module):
par1 <- as.numeric(par1)
(n <- length(x))
(np <- floor(n / par1))
arr <- array(NA,dim=c(par1,np))
j <- 0
k <- 1
for (i in 1:(np*par1))
{
j = j + 1
arr[j,k] <- x[i]
if (j == par1) {
j = 0
k=k+1
}
}
arr
arr.mean <- array(NA,dim=np)
arr.sd <- array(NA,dim=np)
arr.range <- array(NA,dim=np)
for (j in 1:np)
{
arr.mean[j] <- mean(arr[,j],na.rm=TRUE)
arr.sd[j] <- sd(arr[,j],na.rm=TRUE)
arr.range[j] <- max(arr[,j],na.rm=TRUE) - min(arr[,j],na.rm=TRUE)
}
arr.mean
arr.sd
arr.range
(lm1 <- lm(arr.sd~arr.mean))
(lnlm1 <- lm(log(arr.sd)~log(arr.mean)))
(lm2 <- lm(arr.range~arr.mean))
bitmap(file='test1.png')
plot(arr.mean,arr.sd,main='Standard Deviation-Mean Plot',xlab='mean',ylab='standard deviation')
dev.off()
bitmap(file='test2.png')
plot(arr.mean,arr.range,main='Range-Mean Plot',xlab='mean',ylab='range')
dev.off()
load(file='createtable')
a<-table.start()
a<-table.row.start(a)
a<-table.element(a,'Standard Deviation-Mean Plot',4,TRUE)
a<-table.row.end(a)
a<-table.row.start(a)
a<-table.element(a,'Section',header=TRUE)
a<-table.element(a,'Mean',header=TRUE)
a<-table.element(a,'Standard Deviation',header=TRUE)
a<-table.element(a,'Range',header=TRUE)
a<-table.row.end(a)
for (j in 1:np) {
a<-table.row.start(a)
a<-table.element(a,j,header=TRUE)
a<-table.element(a,arr.mean[j])
a<-table.element(a,arr.sd[j] )
a<-table.element(a,arr.range[j] )
a<-table.row.end(a)
}
a<-table.end(a)
table.save(a,file='mytable.tab')
a<-table.start()
a<-table.row.start(a)
a<-table.element(a,'Regression: S.E.(k) = alpha + beta * Mean(k)',2,TRUE)
a<-table.row.end(a)
a<-table.row.start(a)
a<-table.element(a,'alpha',header=TRUE)
a<-table.element(a,lm1$coefficients[[1]])
a<-table.row.end(a)
a<-table.row.start(a)
a<-table.element(a,'beta',header=TRUE)
a<-table.element(a,lm1$coefficients[[2]])
a<-table.row.end(a)
a<-table.row.start(a)
a<-table.element(a,'S.D.',header=TRUE)
a<-table.element(a,summary(lm1)$coefficients[2,2])
a<-table.row.end(a)
a<-table.row.start(a)
a<-table.element(a,'T-STAT',header=TRUE)
a<-table.element(a,summary(lm1)$coefficients[2,3])
a<-table.row.end(a)
a<-table.row.start(a)
a<-table.element(a,'p-value',header=TRUE)
a<-table.element(a,summary(lm1)$coefficients[2,4])
a<-table.row.end(a)
a<-table.end(a)
table.save(a,file='mytable1.tab')
a<-table.start()
a<-table.row.start(a)
a<-table.element(a,'Regression: ln S.E.(k) = alpha + beta * ln Mean(k)',2,TRUE)
a<-table.row.end(a)
a<-table.row.start(a)
a<-table.element(a,'alpha',header=TRUE)
a<-table.element(a,lnlm1$coefficients[[1]])
a<-table.row.end(a)
a<-table.row.start(a)
a<-table.element(a,'beta',header=TRUE)
a<-table.element(a,lnlm1$coefficients[[2]])
a<-table.row.end(a)
a<-table.row.start(a)
a<-table.element(a,'S.D.',header=TRUE)
a<-table.element(a,summary(lnlm1)$coefficients[2,2])
a<-table.row.end(a)
a<-table.row.start(a)
a<-table.element(a,'T-STAT',header=TRUE)
a<-table.element(a,summary(lnlm1)$coefficients[2,3])
a<-table.row.end(a)
a<-table.row.start(a)
a<-table.element(a,'p-value',header=TRUE)
a<-table.element(a,summary(lnlm1)$coefficients[2,4])
a<-table.row.end(a)
a<-table.row.start(a)
a<-table.element(a,'Lambda',header=TRUE)
a<-table.element(a,1-lnlm1$coefficients[[2]])
a<-table.row.end(a)
a<-table.end(a)
table.save(a,file='mytable2.tab')