Free Statistics

of Irreproducible Research!

Author's title

Author*Unverified author*
R Software Modulerwasp_smp.wasp
Title produced by softwareStandard Deviation-Mean Plot
Date of computationWed, 16 Aug 2017 19:43:12 +0200
Cite this page as followsStatistical Computations at FreeStatistics.org, Office for Research Development and Education, URL https://freestatistics.org/blog/index.php?v=date/2017/Aug/16/t1502905445k3x67dz43cte9xv.htm/, Retrieved Sat, 11 May 2024 15:42:09 +0000
Statistical Computations at FreeStatistics.org, Office for Research Development and Education, URL https://freestatistics.org/blog/index.php?pk=307478, Retrieved Sat, 11 May 2024 15:42:09 +0000
QR Codes:

Original text written by user:
IsPrivate?No (this computation is public)
User-defined keywords
Estimated Impact71
Family? (F = Feedback message, R = changed R code, M = changed R Module, P = changed Parameters, D = changed Data)
-       [Standard Deviation-Mean Plot] [] [2017-08-16 17:43:12] [d41d8cd98f00b204e9800998ecf8427e] [Current]
Feedback Forum

Post a new message
Dataseries X:
43200
41600
44000
35200
45600
44800
48000
49600
55200
48000
45600
56800
48000
36000
42400
32000
44800
36800
48800
44000
46400
52000
51200
60800
44000
36800
40800
29600
42400
32800
46400
44000
39200
56000
50400
57600
43200
40000
36000
29600
39200
35200
48000
46400
40000
53600
49600
64000
51200
31200
31200
31200
36800
36800
49600
45600
40800
51200
47200
68000
53600
31200
32800
27200
37600
43200
54400
53600
43200
50400
44800
64000
48800
39200
35200
26400
39200
47200
55200
52000
38400
55200
43200
66400
55200
40000
36800
24800
39200
37600
56800
56800
43200
56000
41600
64800
55200
40800
31200
21600
42400
40800
53600
61600
45600
51200
38400
66400


Summary of computational transaction
Raw Input view raw input (R code)
Raw Outputview raw output of R engine
Computing time1 seconds
R ServerBig Analytics Cloud Computing Center

\begin{tabular}{lllllllll}
\hline
Summary of computational transaction \tabularnewline
Raw Input view raw input (R code)  \tabularnewline
Raw Outputview raw output of R engine  \tabularnewline
Computing time1 seconds \tabularnewline
R ServerBig Analytics Cloud Computing Center \tabularnewline
\hline
\end{tabular}
%Source: https://freestatistics.org/blog/index.php?pk=307478&T=0

[TABLE]
[ROW]
Summary of computational transaction[/C][/ROW] [ROW]Raw Input[/C] view raw input (R code) [/C][/ROW] [ROW]Raw Output[/C]view raw output of R engine [/C][/ROW] [ROW]Computing time[/C]1 seconds[/C][/ROW] [ROW]R Server[/C]Big Analytics Cloud Computing Center[/C][/ROW] [/TABLE] Source: https://freestatistics.org/blog/index.php?pk=307478&T=0

Globally Unique Identifier (entire table): ba.freestatistics.org/blog/index.php?pk=307478&T=0

As an alternative you can also use a QR Code:  

The GUIDs for individual cells are displayed in the table below:

Summary of computational transaction
Raw Input view raw input (R code)
Raw Outputview raw output of R engine
Computing time1 seconds
R ServerBig Analytics Cloud Computing Center


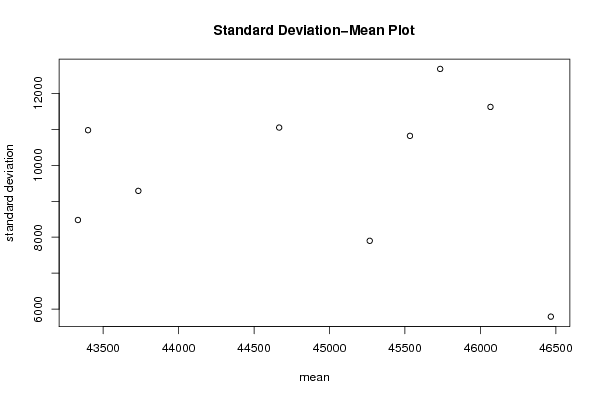
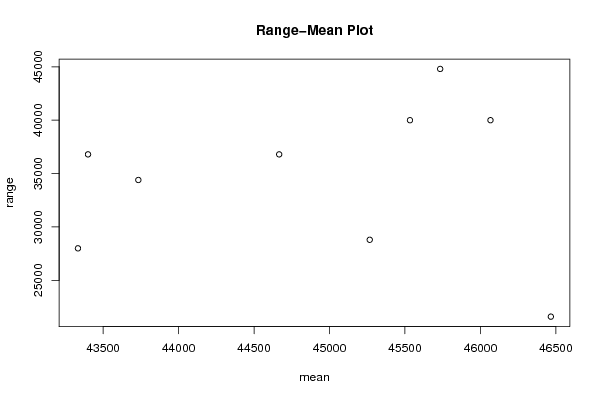
Standard Deviation-Mean Plot
SectionMeanStandard DeviationRange
146466.66666666675793.6224079638321600
245266.66666666677900.9013678340828800
343333.33333333338478.9936509784828000
443733.33333333339287.8545651965534400
54340010975.012942630636800
644666.666666666711047.445886088836800
745533.333333333310816.59779592440000
846066.666666666711620.462620530740000
945733.333333333312675.91369009744800

\begin{tabular}{lllllllll}
\hline
Standard Deviation-Mean Plot \tabularnewline
Section & Mean & Standard Deviation & Range \tabularnewline
1 & 46466.6666666667 & 5793.62240796383 & 21600 \tabularnewline
2 & 45266.6666666667 & 7900.90136783408 & 28800 \tabularnewline
3 & 43333.3333333333 & 8478.99365097848 & 28000 \tabularnewline
4 & 43733.3333333333 & 9287.85456519655 & 34400 \tabularnewline
5 & 43400 & 10975.0129426306 & 36800 \tabularnewline
6 & 44666.6666666667 & 11047.4458860888 & 36800 \tabularnewline
7 & 45533.3333333333 & 10816.597795924 & 40000 \tabularnewline
8 & 46066.6666666667 & 11620.4626205307 & 40000 \tabularnewline
9 & 45733.3333333333 & 12675.913690097 & 44800 \tabularnewline
\hline
\end{tabular}
%Source: https://freestatistics.org/blog/index.php?pk=307478&T=1

[TABLE]
[ROW][C]Standard Deviation-Mean Plot[/C][/ROW]
[ROW][C]Section[/C][C]Mean[/C][C]Standard Deviation[/C][C]Range[/C][/ROW]
[ROW][C]1[/C][C]46466.6666666667[/C][C]5793.62240796383[/C][C]21600[/C][/ROW]
[ROW][C]2[/C][C]45266.6666666667[/C][C]7900.90136783408[/C][C]28800[/C][/ROW]
[ROW][C]3[/C][C]43333.3333333333[/C][C]8478.99365097848[/C][C]28000[/C][/ROW]
[ROW][C]4[/C][C]43733.3333333333[/C][C]9287.85456519655[/C][C]34400[/C][/ROW]
[ROW][C]5[/C][C]43400[/C][C]10975.0129426306[/C][C]36800[/C][/ROW]
[ROW][C]6[/C][C]44666.6666666667[/C][C]11047.4458860888[/C][C]36800[/C][/ROW]
[ROW][C]7[/C][C]45533.3333333333[/C][C]10816.597795924[/C][C]40000[/C][/ROW]
[ROW][C]8[/C][C]46066.6666666667[/C][C]11620.4626205307[/C][C]40000[/C][/ROW]
[ROW][C]9[/C][C]45733.3333333333[/C][C]12675.913690097[/C][C]44800[/C][/ROW]
[/TABLE]
Source: https://freestatistics.org/blog/index.php?pk=307478&T=1

Globally Unique Identifier (entire table): ba.freestatistics.org/blog/index.php?pk=307478&T=1

As an alternative you can also use a QR Code:  

The GUIDs for individual cells are displayed in the table below:

Standard Deviation-Mean Plot
SectionMeanStandard DeviationRange
146466.66666666675793.6224079638321600
245266.66666666677900.9013678340828800
343333.33333333338478.9936509784828000
443733.33333333339287.8545651965534400
54340010975.012942630636800
644666.666666666711047.445886088836800
745533.333333333310816.59779592440000
846066.666666666711620.462620530740000
945733.333333333312675.91369009744800


Regression: S.E.(k) = alpha + beta * Mean(k)
alpha14669.7127425379
beta-0.107448317059865
S.D.0.68875700161761
T-STAT-0.156003230177715
p-value0.880434120508981

\begin{tabular}{lllllllll}
\hline
Regression: S.E.(k) = alpha + beta * Mean(k) \tabularnewline
alpha & 14669.7127425379 \tabularnewline
beta & -0.107448317059865 \tabularnewline
S.D. & 0.68875700161761 \tabularnewline
T-STAT & -0.156003230177715 \tabularnewline
p-value & 0.880434120508981 \tabularnewline
\hline
\end{tabular}
%Source: https://freestatistics.org/blog/index.php?pk=307478&T=2

[TABLE]
[ROW][C]Regression: S.E.(k) = alpha + beta * Mean(k)[/C][/ROW]
[ROW][C]alpha[/C][C]14669.7127425379[/C][/ROW]
[ROW][C]beta[/C][C]-0.107448317059865[/C][/ROW]
[ROW][C]S.D.[/C][C]0.68875700161761[/C][/ROW]
[ROW][C]T-STAT[/C][C]-0.156003230177715[/C][/ROW]
[ROW][C]p-value[/C][C]0.880434120508981[/C][/ROW]
[/TABLE]
Source: https://freestatistics.org/blog/index.php?pk=307478&T=2

Globally Unique Identifier (entire table): ba.freestatistics.org/blog/index.php?pk=307478&T=2

As an alternative you can also use a QR Code:  

The GUIDs for individual cells are displayed in the table below:

Regression: S.E.(k) = alpha + beta * Mean(k)
alpha14669.7127425379
beta-0.107448317059865
S.D.0.68875700161761
T-STAT-0.156003230177715
p-value0.880434120508981


Regression: ln S.E.(k) = alpha + beta * ln Mean(k)
alpha23.0566505158355
beta-1.29633550728102
S.D.3.45582772786278
T-STAT-0.375115778147519
p-value0.718681736243652
Lambda2.29633550728102

\begin{tabular}{lllllllll}
\hline
Regression: ln S.E.(k) = alpha + beta * ln Mean(k) \tabularnewline
alpha & 23.0566505158355 \tabularnewline
beta & -1.29633550728102 \tabularnewline
S.D. & 3.45582772786278 \tabularnewline
T-STAT & -0.375115778147519 \tabularnewline
p-value & 0.718681736243652 \tabularnewline
Lambda & 2.29633550728102 \tabularnewline
\hline
\end{tabular}
%Source: https://freestatistics.org/blog/index.php?pk=307478&T=3

[TABLE]
[ROW][C]Regression: ln S.E.(k) = alpha + beta * ln Mean(k)[/C][/ROW]
[ROW][C]alpha[/C][C]23.0566505158355[/C][/ROW]
[ROW][C]beta[/C][C]-1.29633550728102[/C][/ROW]
[ROW][C]S.D.[/C][C]3.45582772786278[/C][/ROW]
[ROW][C]T-STAT[/C][C]-0.375115778147519[/C][/ROW]
[ROW][C]p-value[/C][C]0.718681736243652[/C][/ROW]
[ROW][C]Lambda[/C][C]2.29633550728102[/C][/ROW]
[/TABLE]
Source: https://freestatistics.org/blog/index.php?pk=307478&T=3

Globally Unique Identifier (entire table): ba.freestatistics.org/blog/index.php?pk=307478&T=3

As an alternative you can also use a QR Code:  

The GUIDs for individual cells are displayed in the table below:

Regression: ln S.E.(k) = alpha + beta * ln Mean(k)
alpha23.0566505158355
beta-1.29633550728102
S.D.3.45582772786278
T-STAT-0.375115778147519
p-value0.718681736243652
Lambda2.29633550728102


Parameters (Session):
par1 = 12 ;
Parameters (R input):
par1 = 12 ;
R code (references can be found in the software module):
par1 <- as.numeric(par1)
(n <- length(x))
(np <- floor(n / par1))
arr <- array(NA,dim=c(par1,np))
j <- 0
k <- 1
for (i in 1:(np*par1))
{
j = j + 1
arr[j,k] <- x[i]
if (j == par1) {
j = 0
k=k+1
}
}
arr
arr.mean <- array(NA,dim=np)
arr.sd <- array(NA,dim=np)
arr.range <- array(NA,dim=np)
for (j in 1:np)
{
arr.mean[j] <- mean(arr[,j],na.rm=TRUE)
arr.sd[j] <- sd(arr[,j],na.rm=TRUE)
arr.range[j] <- max(arr[,j],na.rm=TRUE) - min(arr[,j],na.rm=TRUE)
}
arr.mean
arr.sd
arr.range
(lm1 <- lm(arr.sd~arr.mean))
(lnlm1 <- lm(log(arr.sd)~log(arr.mean)))
(lm2 <- lm(arr.range~arr.mean))
bitmap(file='test1.png')
plot(arr.mean,arr.sd,main='Standard Deviation-Mean Plot',xlab='mean',ylab='standard deviation')
dev.off()
bitmap(file='test2.png')
plot(arr.mean,arr.range,main='Range-Mean Plot',xlab='mean',ylab='range')
dev.off()
load(file='createtable')
a<-table.start()
a<-table.row.start(a)
a<-table.element(a,'Standard Deviation-Mean Plot',4,TRUE)
a<-table.row.end(a)
a<-table.row.start(a)
a<-table.element(a,'Section',header=TRUE)
a<-table.element(a,'Mean',header=TRUE)
a<-table.element(a,'Standard Deviation',header=TRUE)
a<-table.element(a,'Range',header=TRUE)
a<-table.row.end(a)
for (j in 1:np) {
a<-table.row.start(a)
a<-table.element(a,j,header=TRUE)
a<-table.element(a,arr.mean[j])
a<-table.element(a,arr.sd[j] )
a<-table.element(a,arr.range[j] )
a<-table.row.end(a)
}
a<-table.end(a)
table.save(a,file='mytable.tab')
a<-table.start()
a<-table.row.start(a)
a<-table.element(a,'Regression: S.E.(k) = alpha + beta * Mean(k)',2,TRUE)
a<-table.row.end(a)
a<-table.row.start(a)
a<-table.element(a,'alpha',header=TRUE)
a<-table.element(a,lm1$coefficients[[1]])
a<-table.row.end(a)
a<-table.row.start(a)
a<-table.element(a,'beta',header=TRUE)
a<-table.element(a,lm1$coefficients[[2]])
a<-table.row.end(a)
a<-table.row.start(a)
a<-table.element(a,'S.D.',header=TRUE)
a<-table.element(a,summary(lm1)$coefficients[2,2])
a<-table.row.end(a)
a<-table.row.start(a)
a<-table.element(a,'T-STAT',header=TRUE)
a<-table.element(a,summary(lm1)$coefficients[2,3])
a<-table.row.end(a)
a<-table.row.start(a)
a<-table.element(a,'p-value',header=TRUE)
a<-table.element(a,summary(lm1)$coefficients[2,4])
a<-table.row.end(a)
a<-table.end(a)
table.save(a,file='mytable1.tab')
a<-table.start()
a<-table.row.start(a)
a<-table.element(a,'Regression: ln S.E.(k) = alpha + beta * ln Mean(k)',2,TRUE)
a<-table.row.end(a)
a<-table.row.start(a)
a<-table.element(a,'alpha',header=TRUE)
a<-table.element(a,lnlm1$coefficients[[1]])
a<-table.row.end(a)
a<-table.row.start(a)
a<-table.element(a,'beta',header=TRUE)
a<-table.element(a,lnlm1$coefficients[[2]])
a<-table.row.end(a)
a<-table.row.start(a)
a<-table.element(a,'S.D.',header=TRUE)
a<-table.element(a,summary(lnlm1)$coefficients[2,2])
a<-table.row.end(a)
a<-table.row.start(a)
a<-table.element(a,'T-STAT',header=TRUE)
a<-table.element(a,summary(lnlm1)$coefficients[2,3])
a<-table.row.end(a)
a<-table.row.start(a)
a<-table.element(a,'p-value',header=TRUE)
a<-table.element(a,summary(lnlm1)$coefficients[2,4])
a<-table.row.end(a)
a<-table.row.start(a)
a<-table.element(a,'Lambda',header=TRUE)
a<-table.element(a,1-lnlm1$coefficients[[2]])
a<-table.row.end(a)
a<-table.end(a)
table.save(a,file='mytable2.tab')