Free Statistics

of Irreproducible Research!

Author's title

Author*Unverified author*
R Software Modulerwasp_autocorrelation.wasp
Title produced by software(Partial) Autocorrelation Function
Date of computationWed, 16 Aug 2017 23:59:05 +0200
Cite this page as followsStatistical Computations at FreeStatistics.org, Office for Research Development and Education, URL https://freestatistics.org/blog/index.php?v=date/2017/Aug/16/t1502920772jais4x41kaypsw7.htm/, Retrieved Sun, 12 May 2024 02:44:20 +0000
Statistical Computations at FreeStatistics.org, Office for Research Development and Education, URL https://freestatistics.org/blog/index.php?pk=307520, Retrieved Sun, 12 May 2024 02:44:20 +0000
QR Codes:

Original text written by user:
IsPrivate?No (this computation is public)
User-defined keywords
Estimated Impact86
Family? (F = Feedback message, R = changed R code, M = changed R Module, P = changed Parameters, D = changed Data)
-       [(Partial) Autocorrelation Function] [] [2017-08-16 21:59:05] [b4406e95441bfa154caa3f19e1e15192] [Current]
Feedback Forum

Post a new message
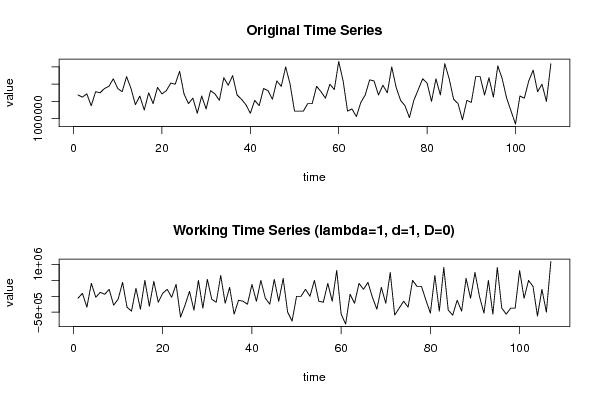
Dataseries X:
1684800
1622400
1716000
1372800
1778400
1747200
1872000
1934400
2152800
1872000
1778400
2215200
1872000
1404000
1653600
1248000
1747200
1435200
1903200
1716000
1809600
2028000
1996800
2371200
1716000
1435200
1591200
1154400
1653600
1279200
1809600
1716000
1528800
2184000
1965600
2246400
1684800
1560000
1404000
1154400
1528800
1372800
1872000
1809600
1560000
2090400
1934400
2496000
1996800
1216800
1216800
1216800
1435200
1435200
1934400
1778400
1591200
1996800
1840800
2652000
2090400
1216800
1279200
1060800
1466400
1684800
2121600
2090400
1684800
1965600
1747200
2496000
1903200
1528800
1372800
1029600
1528800
1840800
2152800
2028000
1497600
2152800
1684800
2589600
2152800
1560000
1435200
967200
1528800
1466400
2215200
2215200
1684800
2184000
1622400
2527200
2152800
1591200
1216800
842400
1653600
1591200
2090400
2402400
1778400
1996800
1497600
2589600


Summary of computational transaction
Raw Input view raw input (R code)
Raw Outputview raw output of R engine
Computing time2 seconds
R ServerBig Analytics Cloud Computing Center

\begin{tabular}{lllllllll}
\hline
Summary of computational transaction \tabularnewline
Raw Input view raw input (R code)  \tabularnewline
Raw Outputview raw output of R engine  \tabularnewline
Computing time2 seconds \tabularnewline
R ServerBig Analytics Cloud Computing Center \tabularnewline
\hline
\end{tabular}
%Source: https://freestatistics.org/blog/index.php?pk=307520&T=0

[TABLE]
[ROW]
Summary of computational transaction[/C][/ROW] [ROW]Raw Input[/C] view raw input (R code) [/C][/ROW] [ROW]Raw Output[/C]view raw output of R engine [/C][/ROW] [ROW]Computing time[/C]2 seconds[/C][/ROW] [ROW]R Server[/C]Big Analytics Cloud Computing Center[/C][/ROW] [/TABLE] Source: https://freestatistics.org/blog/index.php?pk=307520&T=0

Globally Unique Identifier (entire table): ba.freestatistics.org/blog/index.php?pk=307520&T=0

As an alternative you can also use a QR Code:  

The GUIDs for individual cells are displayed in the table below:

Summary of computational transaction
Raw Input view raw input (R code)
Raw Outputview raw output of R engine
Computing time2 seconds
R ServerBig Analytics Cloud Computing Center


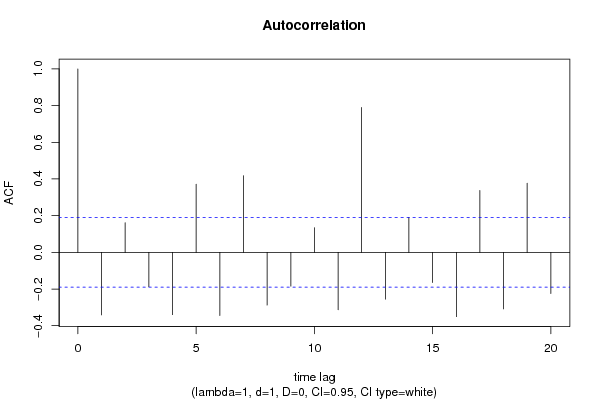
Autocorrelation Function
Time lag kACF(k)T-STATP-value
1-0.34099-3.52720.00031
20.1611711.66720.049203
3-0.187224-1.93670.027712
4-0.339596-3.51280.000325
50.3709553.83720.000105
6-0.34395-3.55780.000279
70.4181114.3251.7e-05
8-0.287596-2.97490.001811
9-0.184079-1.90410.02979
100.1344191.39040.083641
11-0.313093-3.23878e-04
120.7895528.16720
13-0.255181-2.63960.00477
140.1906571.97220.025585
15-0.164844-1.70520.045533
16-0.350569-3.62630.000221
170.3377353.49360.000347
18-0.308274-3.18880.000937
190.3765073.89468.6e-05
20-0.224228-2.31940.011135

\begin{tabular}{lllllllll}
\hline
Autocorrelation Function \tabularnewline
Time lag k & ACF(k) & T-STAT & P-value \tabularnewline
1 & -0.34099 & -3.5272 & 0.00031 \tabularnewline
2 & 0.161171 & 1.6672 & 0.049203 \tabularnewline
3 & -0.187224 & -1.9367 & 0.027712 \tabularnewline
4 & -0.339596 & -3.5128 & 0.000325 \tabularnewline
5 & 0.370955 & 3.8372 & 0.000105 \tabularnewline
6 & -0.34395 & -3.5578 & 0.000279 \tabularnewline
7 & 0.418111 & 4.325 & 1.7e-05 \tabularnewline
8 & -0.287596 & -2.9749 & 0.001811 \tabularnewline
9 & -0.184079 & -1.9041 & 0.02979 \tabularnewline
10 & 0.134419 & 1.3904 & 0.083641 \tabularnewline
11 & -0.313093 & -3.2387 & 8e-04 \tabularnewline
12 & 0.789552 & 8.1672 & 0 \tabularnewline
13 & -0.255181 & -2.6396 & 0.00477 \tabularnewline
14 & 0.190657 & 1.9722 & 0.025585 \tabularnewline
15 & -0.164844 & -1.7052 & 0.045533 \tabularnewline
16 & -0.350569 & -3.6263 & 0.000221 \tabularnewline
17 & 0.337735 & 3.4936 & 0.000347 \tabularnewline
18 & -0.308274 & -3.1888 & 0.000937 \tabularnewline
19 & 0.376507 & 3.8946 & 8.6e-05 \tabularnewline
20 & -0.224228 & -2.3194 & 0.011135 \tabularnewline
\hline
\end{tabular}
%Source: https://freestatistics.org/blog/index.php?pk=307520&T=1

[TABLE]
[ROW][C]Autocorrelation Function[/C][/ROW]
[ROW][C]Time lag k[/C][C]ACF(k)[/C][C]T-STAT[/C][C]P-value[/C][/ROW]
[ROW][C]1[/C][C]-0.34099[/C][C]-3.5272[/C][C]0.00031[/C][/ROW]
[ROW][C]2[/C][C]0.161171[/C][C]1.6672[/C][C]0.049203[/C][/ROW]
[ROW][C]3[/C][C]-0.187224[/C][C]-1.9367[/C][C]0.027712[/C][/ROW]
[ROW][C]4[/C][C]-0.339596[/C][C]-3.5128[/C][C]0.000325[/C][/ROW]
[ROW][C]5[/C][C]0.370955[/C][C]3.8372[/C][C]0.000105[/C][/ROW]
[ROW][C]6[/C][C]-0.34395[/C][C]-3.5578[/C][C]0.000279[/C][/ROW]
[ROW][C]7[/C][C]0.418111[/C][C]4.325[/C][C]1.7e-05[/C][/ROW]
[ROW][C]8[/C][C]-0.287596[/C][C]-2.9749[/C][C]0.001811[/C][/ROW]
[ROW][C]9[/C][C]-0.184079[/C][C]-1.9041[/C][C]0.02979[/C][/ROW]
[ROW][C]10[/C][C]0.134419[/C][C]1.3904[/C][C]0.083641[/C][/ROW]
[ROW][C]11[/C][C]-0.313093[/C][C]-3.2387[/C][C]8e-04[/C][/ROW]
[ROW][C]12[/C][C]0.789552[/C][C]8.1672[/C][C]0[/C][/ROW]
[ROW][C]13[/C][C]-0.255181[/C][C]-2.6396[/C][C]0.00477[/C][/ROW]
[ROW][C]14[/C][C]0.190657[/C][C]1.9722[/C][C]0.025585[/C][/ROW]
[ROW][C]15[/C][C]-0.164844[/C][C]-1.7052[/C][C]0.045533[/C][/ROW]
[ROW][C]16[/C][C]-0.350569[/C][C]-3.6263[/C][C]0.000221[/C][/ROW]
[ROW][C]17[/C][C]0.337735[/C][C]3.4936[/C][C]0.000347[/C][/ROW]
[ROW][C]18[/C][C]-0.308274[/C][C]-3.1888[/C][C]0.000937[/C][/ROW]
[ROW][C]19[/C][C]0.376507[/C][C]3.8946[/C][C]8.6e-05[/C][/ROW]
[ROW][C]20[/C][C]-0.224228[/C][C]-2.3194[/C][C]0.011135[/C][/ROW]
[/TABLE]
Source: https://freestatistics.org/blog/index.php?pk=307520&T=1

Globally Unique Identifier (entire table): ba.freestatistics.org/blog/index.php?pk=307520&T=1

As an alternative you can also use a QR Code:  

The GUIDs for individual cells are displayed in the table below:

Autocorrelation Function
Time lag kACF(k)T-STATP-value
1-0.34099-3.52720.00031
20.1611711.66720.049203
3-0.187224-1.93670.027712
4-0.339596-3.51280.000325
50.3709553.83720.000105
6-0.34395-3.55780.000279
70.4181114.3251.7e-05
8-0.287596-2.97490.001811
9-0.184079-1.90410.02979
100.1344191.39040.083641
11-0.313093-3.23878e-04
120.7895528.16720
13-0.255181-2.63960.00477
140.1906571.97220.025585
15-0.164844-1.70520.045533
16-0.350569-3.62630.000221
170.3377353.49360.000347
18-0.308274-3.18880.000937
190.3765073.89468.6e-05
20-0.224228-2.31940.011135


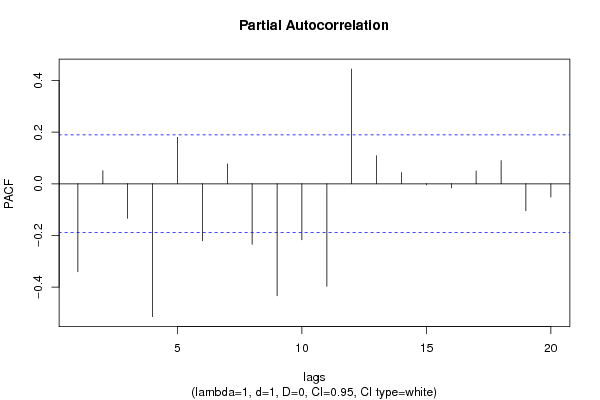
Partial Autocorrelation Function
Time lag kPACF(k)T-STATP-value
1-0.34099-3.52720.00031
20.0508040.52550.300154
3-0.13357-1.38170.084977
4-0.514821-5.32530
50.1798151.860.032814
6-0.220958-2.28560.012124
70.0767560.7940.214484
8-0.234549-2.42620.008465
9-0.434093-4.49039e-06
10-0.217-2.24470.013423
11-0.396937-4.10593.9e-05
120.4450364.60356e-06
130.1086521.12390.131784
140.0436250.45130.326357
15-0.004306-0.04450.48228
16-0.015357-0.15890.43704
170.0497710.51480.303866
180.0897240.92810.17772
19-0.104654-1.08250.140722
20-0.051051-0.52810.299269

\begin{tabular}{lllllllll}
\hline
Partial Autocorrelation Function \tabularnewline
Time lag k & PACF(k) & T-STAT & P-value \tabularnewline
1 & -0.34099 & -3.5272 & 0.00031 \tabularnewline
2 & 0.050804 & 0.5255 & 0.300154 \tabularnewline
3 & -0.13357 & -1.3817 & 0.084977 \tabularnewline
4 & -0.514821 & -5.3253 & 0 \tabularnewline
5 & 0.179815 & 1.86 & 0.032814 \tabularnewline
6 & -0.220958 & -2.2856 & 0.012124 \tabularnewline
7 & 0.076756 & 0.794 & 0.214484 \tabularnewline
8 & -0.234549 & -2.4262 & 0.008465 \tabularnewline
9 & -0.434093 & -4.4903 & 9e-06 \tabularnewline
10 & -0.217 & -2.2447 & 0.013423 \tabularnewline
11 & -0.396937 & -4.1059 & 3.9e-05 \tabularnewline
12 & 0.445036 & 4.6035 & 6e-06 \tabularnewline
13 & 0.108652 & 1.1239 & 0.131784 \tabularnewline
14 & 0.043625 & 0.4513 & 0.326357 \tabularnewline
15 & -0.004306 & -0.0445 & 0.48228 \tabularnewline
16 & -0.015357 & -0.1589 & 0.43704 \tabularnewline
17 & 0.049771 & 0.5148 & 0.303866 \tabularnewline
18 & 0.089724 & 0.9281 & 0.17772 \tabularnewline
19 & -0.104654 & -1.0825 & 0.140722 \tabularnewline
20 & -0.051051 & -0.5281 & 0.299269 \tabularnewline
\hline
\end{tabular}
%Source: https://freestatistics.org/blog/index.php?pk=307520&T=2

[TABLE]
[ROW][C]Partial Autocorrelation Function[/C][/ROW]
[ROW][C]Time lag k[/C][C]PACF(k)[/C][C]T-STAT[/C][C]P-value[/C][/ROW]
[ROW][C]1[/C][C]-0.34099[/C][C]-3.5272[/C][C]0.00031[/C][/ROW]
[ROW][C]2[/C][C]0.050804[/C][C]0.5255[/C][C]0.300154[/C][/ROW]
[ROW][C]3[/C][C]-0.13357[/C][C]-1.3817[/C][C]0.084977[/C][/ROW]
[ROW][C]4[/C][C]-0.514821[/C][C]-5.3253[/C][C]0[/C][/ROW]
[ROW][C]5[/C][C]0.179815[/C][C]1.86[/C][C]0.032814[/C][/ROW]
[ROW][C]6[/C][C]-0.220958[/C][C]-2.2856[/C][C]0.012124[/C][/ROW]
[ROW][C]7[/C][C]0.076756[/C][C]0.794[/C][C]0.214484[/C][/ROW]
[ROW][C]8[/C][C]-0.234549[/C][C]-2.4262[/C][C]0.008465[/C][/ROW]
[ROW][C]9[/C][C]-0.434093[/C][C]-4.4903[/C][C]9e-06[/C][/ROW]
[ROW][C]10[/C][C]-0.217[/C][C]-2.2447[/C][C]0.013423[/C][/ROW]
[ROW][C]11[/C][C]-0.396937[/C][C]-4.1059[/C][C]3.9e-05[/C][/ROW]
[ROW][C]12[/C][C]0.445036[/C][C]4.6035[/C][C]6e-06[/C][/ROW]
[ROW][C]13[/C][C]0.108652[/C][C]1.1239[/C][C]0.131784[/C][/ROW]
[ROW][C]14[/C][C]0.043625[/C][C]0.4513[/C][C]0.326357[/C][/ROW]
[ROW][C]15[/C][C]-0.004306[/C][C]-0.0445[/C][C]0.48228[/C][/ROW]
[ROW][C]16[/C][C]-0.015357[/C][C]-0.1589[/C][C]0.43704[/C][/ROW]
[ROW][C]17[/C][C]0.049771[/C][C]0.5148[/C][C]0.303866[/C][/ROW]
[ROW][C]18[/C][C]0.089724[/C][C]0.9281[/C][C]0.17772[/C][/ROW]
[ROW][C]19[/C][C]-0.104654[/C][C]-1.0825[/C][C]0.140722[/C][/ROW]
[ROW][C]20[/C][C]-0.051051[/C][C]-0.5281[/C][C]0.299269[/C][/ROW]
[/TABLE]
Source: https://freestatistics.org/blog/index.php?pk=307520&T=2

Globally Unique Identifier (entire table): ba.freestatistics.org/blog/index.php?pk=307520&T=2

As an alternative you can also use a QR Code:  

The GUIDs for individual cells are displayed in the table below:

Partial Autocorrelation Function
Time lag kPACF(k)T-STATP-value
1-0.34099-3.52720.00031
20.0508040.52550.300154
3-0.13357-1.38170.084977
4-0.514821-5.32530
50.1798151.860.032814
6-0.220958-2.28560.012124
70.0767560.7940.214484
8-0.234549-2.42620.008465
9-0.434093-4.49039e-06
10-0.217-2.24470.013423
11-0.396937-4.10593.9e-05
120.4450364.60356e-06
130.1086521.12390.131784
140.0436250.45130.326357
15-0.004306-0.04450.48228
16-0.015357-0.15890.43704
170.0497710.51480.303866
180.0897240.92810.17772
19-0.104654-1.08250.140722
20-0.051051-0.52810.299269


Parameters (Session):
Parameters (R input):
par1 = Default ; par2 = 1 ; par3 = 1 ; par4 = 0 ; par5 = 12 ; par6 = White Noise ; par7 = 0.95 ; par8 = ;
R code (references can be found in the software module):
if (par1 == 'Default') {
par1 = 10*log10(length(x))
} else {
par1 <- as.numeric(par1)
}
par2 <- as.numeric(par2)
par3 <- as.numeric(par3)
par4 <- as.numeric(par4)
par5 <- as.numeric(par5)
if (par6 == 'White Noise') par6 <- 'white' else par6 <- 'ma'
par7 <- as.numeric(par7)
if (par8 != '') par8 <- as.numeric(par8)
x <- na.omit(x)
ox <- x
if (par8 == '') {
if (par2 == 0) {
x <- log(x)
} else {
x <- (x ^ par2 - 1) / par2
}
} else {
x <- log(x,base=par8)
}
if (par3 > 0) x <- diff(x,lag=1,difference=par3)
if (par4 > 0) x <- diff(x,lag=par5,difference=par4)
bitmap(file='picts.png')
op <- par(mfrow=c(2,1))
plot(ox,type='l',main='Original Time Series',xlab='time',ylab='value')
if (par8=='') {
mytitle <- paste('Working Time Series (lambda=',par2,', d=',par3,', D=',par4,')',sep='')
mysub <- paste('(lambda=',par2,', d=',par3,', D=',par4,', CI=', par7, ', CI type=',par6,')',sep='')
} else {
mytitle <- paste('Working Time Series (base=',par8,', d=',par3,', D=',par4,')',sep='')
mysub <- paste('(base=',par8,', d=',par3,', D=',par4,', CI=', par7, ', CI type=',par6,')',sep='')
}
plot(x,type='l', main=mytitle,xlab='time',ylab='value')
par(op)
dev.off()
bitmap(file='pic1.png')
racf <- acf(x, par1, main='Autocorrelation', xlab='time lag', ylab='ACF', ci.type=par6, ci=par7, sub=mysub)
dev.off()
bitmap(file='pic2.png')
rpacf <- pacf(x,par1,main='Partial Autocorrelation',xlab='lags',ylab='PACF',sub=mysub)
dev.off()
(myacf <- c(racf$acf))
(mypacf <- c(rpacf$acf))
lengthx <- length(x)
sqrtn <- sqrt(lengthx)
load(file='createtable')
a<-table.start()
a<-table.row.start(a)
a<-table.element(a,'Autocorrelation Function',4,TRUE)
a<-table.row.end(a)
a<-table.row.start(a)
a<-table.element(a,'Time lag k',header=TRUE)
a<-table.element(a,'ACF(k)',header=TRUE)
a<-table.element(a,'T-STAT',header=TRUE)
a<-table.element(a,'P-value',header=TRUE)
a<-table.row.end(a)
for (i in 2:(par1+1)) {
a<-table.row.start(a)
a<-table.element(a,i-1,header=TRUE)
a<-table.element(a,round(myacf[i],6))
mytstat <- myacf[i]*sqrtn
a<-table.element(a,round(mytstat,4))
a<-table.element(a,round(1-pt(abs(mytstat),lengthx),6))
a<-table.row.end(a)
}
a<-table.end(a)
table.save(a,file='mytable.tab')
a<-table.start()
a<-table.row.start(a)
a<-table.element(a,'Partial Autocorrelation Function',4,TRUE)
a<-table.row.end(a)
a<-table.row.start(a)
a<-table.element(a,'Time lag k',header=TRUE)
a<-table.element(a,'PACF(k)',header=TRUE)
a<-table.element(a,'T-STAT',header=TRUE)
a<-table.element(a,'P-value',header=TRUE)
a<-table.row.end(a)
for (i in 1:par1) {
a<-table.row.start(a)
a<-table.element(a,i,header=TRUE)
a<-table.element(a,round(mypacf[i],6))
mytstat <- mypacf[i]*sqrtn
a<-table.element(a,round(mytstat,4))
a<-table.element(a,round(1-pt(abs(mytstat),lengthx),6))
a<-table.row.end(a)
}
a<-table.end(a)
table.save(a,file='mytable1.tab')