Free Statistics
of Irreproducible Research!
Description of Statistical Computation | |||||||||||||||||||||||||||||||||||||
|---|---|---|---|---|---|---|---|---|---|---|---|---|---|---|---|---|---|---|---|---|---|---|---|---|---|---|---|---|---|---|---|---|---|---|---|---|---|
| Author's title | |||||||||||||||||||||||||||||||||||||
| Author | *Unverified author* | ||||||||||||||||||||||||||||||||||||
| R Software Module | rwasp_spearman.wasp | ||||||||||||||||||||||||||||||||||||
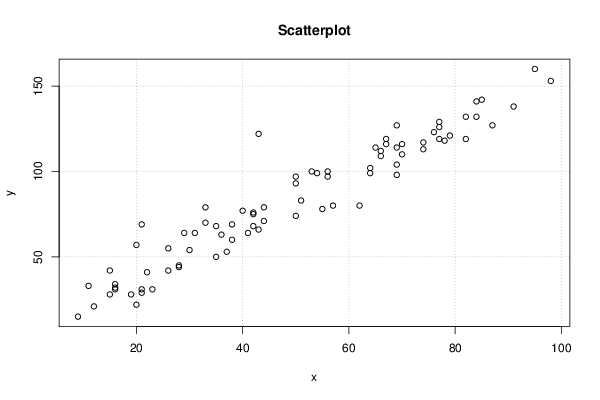
| Title produced by software | Spearman Rank Correlation | ||||||||||||||||||||||||||||||||||||
| Date of computation | Sun, 26 Feb 2017 08:28:55 +0000 | ||||||||||||||||||||||||||||||||||||
| Cite this page as follows | Statistical Computations at FreeStatistics.org, Office for Research Development and Education, URL https://freestatistics.org/blog/index.php?v=date/2017/Feb/26/t14880978329ylh7wp925hkmnc.htm/, Retrieved Tue, 14 May 2024 23:36:37 +0200 | ||||||||||||||||||||||||||||||||||||
| Statistical Computations at FreeStatistics.org, Office for Research Development and Education, URL https://freestatistics.org/blog/index.php?pk=, Retrieved Tue, 14 May 2024 23:36:37 +0200 | |||||||||||||||||||||||||||||||||||||
| QR Codes: | |||||||||||||||||||||||||||||||||||||
|
| |||||||||||||||||||||||||||||||||||||
| Original text written by user: | |||||||||||||||||||||||||||||||||||||
| IsPrivate? | No (this computation is public) | ||||||||||||||||||||||||||||||||||||
| User-defined keywords | |||||||||||||||||||||||||||||||||||||
| Estimated Impact | 0 | ||||||||||||||||||||||||||||||||||||
Tree of Dependent Computations | |||||||||||||||||||||||||||||||||||||
Dataset | |||||||||||||||||||||||||||||||||||||
| Dataseries X: | |||||||||||||||||||||||||||||||||||||
50 64 15 42 82 31 70 21 77 69 12 21 66 41 30 70 56 11 37 38 78 55 74 38 87 20 26 43 33 98 50 82 36 85 69 42 74 51 67 56 43 15 35 40 16 50 29 20 64 91 84 9 33 69 44 44 26 77 84 69 62 53 66 28 95 16 23 65 67 42 19 21 22 54 79 57 28 76 35 16 77 | |||||||||||||||||||||||||||||||||||||
| Dataseries Y: | |||||||||||||||||||||||||||||||||||||
97 102 28 76 132 64 110 29 126 114 21 69 112 64 54 116 97 33 53 69 118 78 117 60 127 57 42 122 79 153 74 119 63 142 98 75 113 83 119 100 66 42 68 77 32 93 64 22 99 138 141 15 70 127 71 79 55 129 132 104 80 100 109 45 160 31 31 114 116 68 28 31 41 99 121 80 44 123 50 34 119 | |||||||||||||||||||||||||||||||||||||
Tables (Output of Computation) | |||||||||||||||||||||||||||||||||||||
| |||||||||||||||||||||||||||||||||||||
Figures (Output of Computation) | |||||||||||||||||||||||||||||||||||||
Input Parameters & R Code | |||||||||||||||||||||||||||||||||||||
| Parameters (Session): | |||||||||||||||||||||||||||||||||||||
| Parameters (R input): | |||||||||||||||||||||||||||||||||||||
| R code (references can be found in the software module): | |||||||||||||||||||||||||||||||||||||
k <- cor.test(x,y,method='spearman') | |||||||||||||||||||||||||||||||||||||