Free Statistics

of Irreproducible Research!

Author's title

Author*Unverified author*
R Software Modulerwasp_multipleregression.wasp
Title produced by softwareMultiple Regression
Date of computationFri, 21 Dec 2007 09:11:04 -0700
Cite this page as followsStatistical Computations at FreeStatistics.org, Office for Research Development and Education, URL https://freestatistics.org/blog/index.php?v=date/2007/Dec/21/t1198252956yid7nlx1zctguhc.htm/, Retrieved Thu, 31 Oct 2024 23:02:55 +0000
Statistical Computations at FreeStatistics.org, Office for Research Development and Education, URL https://freestatistics.org/blog/index.php?pk=4810, Retrieved Thu, 31 Oct 2024 23:02:55 +0000
QR Codes:

Original text written by user:
IsPrivate?No (this computation is public)
User-defined keywords
Estimated Impact306
Family? (F = Feedback message, R = changed R code, M = changed R Module, P = changed Parameters, D = changed Data)
-     [Multiple Regression] [Regressiemodel 1 ...] [2007-12-20 21:16:13] [629e877506848c5518b68ec0e590da74]
-   PD    [Multiple Regression] [Regressiemodel 0] [2007-12-21 16:11:04] [d41d8cd98f00b204e9800998ecf8427e] [Current]
- R  D      [Multiple Regression] [] [2008-12-16 08:21:50] [1d635fe1113b56bab3f378c464a289bc]
Feedback Forum

Post a new message
Dataseries X:
115,4	126,6	117
106,9	93,9	103,8
107,1	89,8	100,8
99,3	93,4	110,6
99,2	101,5	104
108,3	110,4	112,6
105,6	105,9	107,3
99,5	108,4	98,9
107,4	113,9	109,8
93,1	86,1	104,9
88,1	69,4	102,2
110,7	101,2	123,9
113,1	100,5	124,9
99,6	98	112,7
93,6	106,6	121,9
98,6	90,1	100,6
99,6	96,9	104,3
114,3	125,9	120,4
107,8	112	107,5
101,2	100	102,9
112,5	123,9	125,6
100,5	79,8	107,5
93,9	83,4	108,8
116,2	113,6	128,4
112	112,9	121,1
106,4	104	119,5
95,7	109,9	128,7
96	99	108,7
95,8	106,3	105,5
103	128,9	119,8
102,2	111,1	111,3
98,4	102,9	110,6
111,4	130	120,1
86,6	87	97,5
91,3	87,5	107,7
107,9	117,6	127,3
101,8	103,4	117,2
104,4	110,8	119,8
93,4	112,6	116,2
100,1	102,5	111
98,5	112,4	112,4
112,9	135,6	130,6
101,4	105,1	109,1
107,1	127,7	118,8
110,8	137	123,9
90,3	91	101,6
95,5	90,5	112,8
111,4	122,4	128
113	123,3	129,6
107,5	124,3	125,8
95,9	120	119,5
106,3	118,1	115,7
105,2	119	113,6
117,2	142,7	129,7
106,9	123,6	112
108,2	129,6	116,8
113	151,6	127
96,1	108,7	112,9
100,2	99,3	113,3
108,1	126,4	121,7


Summary of compuational transaction
Raw Inputview raw input (R code)
Raw Outputview raw output of R engine
Computing time3 seconds
R Server'Gwilym Jenkins' @ 72.249.127.135

\begin{tabular}{lllllllll}
\hline
Summary of compuational transaction \tabularnewline
Raw Input & view raw input (R code)  \tabularnewline
Raw Output & view raw output of R engine  \tabularnewline
Computing time & 3 seconds \tabularnewline
R Server & 'Gwilym Jenkins' @ 72.249.127.135 \tabularnewline
\hline
\end{tabular}
%Source: https://freestatistics.org/blog/index.php?pk=4810&T=0

[TABLE]
[ROW][C]Summary of compuational transaction[/C][/ROW]
[ROW][C]Raw Input[/C][C]view raw input (R code) [/C][/ROW]
[ROW][C]Raw Output[/C][C]view raw output of R engine [/C][/ROW]
[ROW][C]Computing time[/C][C]3 seconds[/C][/ROW]
[ROW][C]R Server[/C][C]'Gwilym Jenkins' @ 72.249.127.135[/C][/ROW]
[/TABLE]
Source: https://freestatistics.org/blog/index.php?pk=4810&T=0

Globally Unique Identifier (entire table): ba.freestatistics.org/blog/index.php?pk=4810&T=0

As an alternative you can also use a QR Code:  

The GUIDs for individual cells are displayed in the table below:

Summary of compuational transaction
Raw Inputview raw input (R code)
Raw Outputview raw output of R engine
Computing time3 seconds
R Server'Gwilym Jenkins' @ 72.249.127.135


Multiple Linear Regression - Estimated Regression Equation
Cons[t] = + 48.8917446449142 + 0.338889029387975Int[t] + 0.280590797362096Inv[t] + e[t]

\begin{tabular}{lllllllll}
\hline
Multiple Linear Regression - Estimated Regression Equation \tabularnewline
Cons[t] =  +  48.8917446449142 +  0.338889029387975Int[t] +  0.280590797362096Inv[t]  + e[t] \tabularnewline
\hline
\end{tabular}
%Source: https://freestatistics.org/blog/index.php?pk=4810&T=1

[TABLE]
[ROW][C]Multiple Linear Regression - Estimated Regression Equation[/C][/ROW]
[ROW][C]Cons[t] =  +  48.8917446449142 +  0.338889029387975Int[t] +  0.280590797362096Inv[t]  + e[t][/C][/ROW]
[/TABLE]
Source: https://freestatistics.org/blog/index.php?pk=4810&T=1

Globally Unique Identifier (entire table): ba.freestatistics.org/blog/index.php?pk=4810&T=1

As an alternative you can also use a QR Code:  

The GUIDs for individual cells are displayed in the table below:

Multiple Linear Regression - Estimated Regression Equation
Cons[t] = + 48.8917446449142 + 0.338889029387975Int[t] + 0.280590797362096Inv[t] + e[t]


Multiple Linear Regression - Ordinary Least Squares
VariableParameterS.D.T-STATH0: parameter = 02-tail p-value1-tail p-value
(Intercept)48.891744644914211.5175014.2458.1e-054.1e-05
Int0.3388890293879750.1495192.26650.0272320.013616
Inv0.2805907973620960.068994.06710.0001487.4e-05

\begin{tabular}{lllllllll}
\hline
Multiple Linear Regression - Ordinary Least Squares \tabularnewline
Variable & Parameter & S.D. & T-STATH0: parameter = 0 & 2-tail p-value & 1-tail p-value \tabularnewline
(Intercept) & 48.8917446449142 & 11.517501 & 4.245 & 8.1e-05 & 4.1e-05 \tabularnewline
Int & 0.338889029387975 & 0.149519 & 2.2665 & 0.027232 & 0.013616 \tabularnewline
Inv & 0.280590797362096 & 0.06899 & 4.0671 & 0.000148 & 7.4e-05 \tabularnewline
\hline
\end{tabular}
%Source: https://freestatistics.org/blog/index.php?pk=4810&T=2

[TABLE]
[ROW][C]Multiple Linear Regression - Ordinary Least Squares[/C][/ROW]
[ROW][C]Variable[/C][C]Parameter[/C][C]S.D.[/C][C]T-STATH0: parameter = 0[/C][C]2-tail p-value[/C][C]1-tail p-value[/C][/ROW]
[ROW][C](Intercept)[/C][C]48.8917446449142[/C][C]11.517501[/C][C]4.245[/C][C]8.1e-05[/C][C]4.1e-05[/C][/ROW]
[ROW][C]Int[/C][C]0.338889029387975[/C][C]0.149519[/C][C]2.2665[/C][C]0.027232[/C][C]0.013616[/C][/ROW]
[ROW][C]Inv[/C][C]0.280590797362096[/C][C]0.06899[/C][C]4.0671[/C][C]0.000148[/C][C]7.4e-05[/C][/ROW]
[/TABLE]
Source: https://freestatistics.org/blog/index.php?pk=4810&T=2

Globally Unique Identifier (entire table): ba.freestatistics.org/blog/index.php?pk=4810&T=2

As an alternative you can also use a QR Code:  

The GUIDs for individual cells are displayed in the table below:

Multiple Linear Regression - Ordinary Least Squares
VariableParameterS.D.T-STATH0: parameter = 02-tail p-value1-tail p-value
(Intercept)48.891744644914211.5175014.2458.1e-054.1e-05
Int0.3388890293879750.1495192.26650.0272320.013616
Inv0.2805907973620960.068994.06710.0001487.4e-05


Multiple Linear Regression - Regression Statistics
Multiple R0.738425103738406
R-squared0.545271633831076
Adjusted R-squared0.52931625256199
F-TEST (value)34.1747793196009
F-TEST (DF numerator)2
F-TEST (DF denominator)57
p-value1.76170633636730e-10
Multiple Linear Regression - Residual Statistics
Residual Standard Deviation6.17091580655336
Sum Squared Residuals2170.57150781949

\begin{tabular}{lllllllll}
\hline
Multiple Linear Regression - Regression Statistics \tabularnewline
Multiple R & 0.738425103738406 \tabularnewline
R-squared & 0.545271633831076 \tabularnewline
Adjusted R-squared & 0.52931625256199 \tabularnewline
F-TEST (value) & 34.1747793196009 \tabularnewline
F-TEST (DF numerator) & 2 \tabularnewline
F-TEST (DF denominator) & 57 \tabularnewline
p-value & 1.76170633636730e-10 \tabularnewline
Multiple Linear Regression - Residual Statistics \tabularnewline
Residual Standard Deviation & 6.17091580655336 \tabularnewline
Sum Squared Residuals & 2170.57150781949 \tabularnewline
\hline
\end{tabular}
%Source: https://freestatistics.org/blog/index.php?pk=4810&T=3

[TABLE]
[ROW][C]Multiple Linear Regression - Regression Statistics[/C][/ROW]
[ROW][C]Multiple R[/C][C]0.738425103738406[/C][/ROW]
[ROW][C]R-squared[/C][C]0.545271633831076[/C][/ROW]
[ROW][C]Adjusted R-squared[/C][C]0.52931625256199[/C][/ROW]
[ROW][C]F-TEST (value)[/C][C]34.1747793196009[/C][/ROW]
[ROW][C]F-TEST (DF numerator)[/C][C]2[/C][/ROW]
[ROW][C]F-TEST (DF denominator)[/C][C]57[/C][/ROW]
[ROW][C]p-value[/C][C]1.76170633636730e-10[/C][/ROW]
[ROW][C]Multiple Linear Regression - Residual Statistics[/C][/ROW]
[ROW][C]Residual Standard Deviation[/C][C]6.17091580655336[/C][/ROW]
[ROW][C]Sum Squared Residuals[/C][C]2170.57150781949[/C][/ROW]
[/TABLE]
Source: https://freestatistics.org/blog/index.php?pk=4810&T=3

Globally Unique Identifier (entire table): ba.freestatistics.org/blog/index.php?pk=4810&T=3

As an alternative you can also use a QR Code:  

The GUIDs for individual cells are displayed in the table below:

Multiple Linear Regression - Regression Statistics
Multiple R0.738425103738406
R-squared0.545271633831076
Adjusted R-squared0.52931625256199
F-TEST (value)34.1747793196009
F-TEST (DF numerator)2
F-TEST (DF denominator)57
p-value1.76170633636730e-10
Multiple Linear Regression - Residual Statistics
Residual Standard Deviation6.17091580655336
Sum Squared Residuals2170.57150781949


Multiple Linear Regression - Actuals, Interpolation, and Residuals
Time or IndexActualsInterpolationForecastResidualsPrediction Error
1117123.522333582328-6.52233358232794
2103.8111.466457758790-7.6664577587895
3100.8110.383813295482-9.5838132954825
4110.6108.7506057367601.84939426324015
5104110.989502292454-6.98950229245403
6112.6116.570650556407-3.97065055640725
7107.3114.392991588930-7.09299158893029
898.9113.027245503069-14.1272455030689
9109.8117.247718220725-7.44771822072541
10104.9104.6011809338110.298819066188907
11102.298.22086947092423.97913052907578
12123.9114.8025488912079.0974511087929
13124.9115.4194690035859.48053099641523
14112.7110.1429901134422.55700988655813
15121.9110.52273679442811.3772632055720
16100.6107.587433784893-6.98743378489335
17104.3109.834340236344-5.53434023634358
18120.4122.953142091848-2.55314209184758
19107.5116.850151317493-9.35015131749261
20102.9111.246394155187-8.34639415518683
21125.6121.7819602442253.81803975577496
22107.5105.3412377279012.15876227209909
23108.8104.1146970044444.68530299555617
24128.4120.1457644401318.25423555986905
25121.1118.5260169585482.573983041452
26119.5114.1309802974535.36901970254732
27128.7112.16035338743816.5396466125623
28108.7109.203580405007-0.503580405007264
29105.5111.184115419873-5.68411541987297
30119.8119.965468451850-0.165468451849764
31111.3114.699841035294-3.39984103529407
32110.6111.111218185251-0.511218185250589
33120.1123.120786175807-3.02078617580706
3497.5102.650933960415-5.15093396041515
35107.7104.3840077972203.31599220278032
36127.3118.4553486856598.84465131434085
37117.2112.4037362838514.79626371614926
38119.8115.3612196607394.43878033926101
39116.2112.1385037727234.06149622727696
40111111.575093216265-0.575093216265297
41112.4113.810719663129-1.41071966312929
42130.6125.2004281851175.39957181488324
43109.1112.745185027611-3.64518502761112
44118.8121.018204515506-2.21820451550594
45123.9124.881588339709-0.981588339708932
46101.6105.027186558599-3.42718655859905
47112.8106.6491141127356.15088588726453
48128120.9882961158557.01170388414487
49129.6121.7830502805027.81694971949823
50125.8120.199751416235.60024858377
51119.5115.0620982466724.43790175332751
52115.7118.053421637319-2.35342163731943
53113.6117.933175422619-4.33317542261856
54129.7128.6498456727561.05015432724407
55112119.800004440444-7.80000444044375
56116.8121.924104962821-5.1241049628207
57127129.723769845849-2.72376984584908
58112.9111.9592000423580.940799957641612
59113.3110.7110915676452.58890843235461
60121.7120.9923255083230.707674491676814

\begin{tabular}{lllllllll}
\hline
Multiple Linear Regression - Actuals, Interpolation, and Residuals \tabularnewline
Time or Index & Actuals & InterpolationForecast & ResidualsPrediction Error \tabularnewline
1 & 117 & 123.522333582328 & -6.52233358232794 \tabularnewline
2 & 103.8 & 111.466457758790 & -7.6664577587895 \tabularnewline
3 & 100.8 & 110.383813295482 & -9.5838132954825 \tabularnewline
4 & 110.6 & 108.750605736760 & 1.84939426324015 \tabularnewline
5 & 104 & 110.989502292454 & -6.98950229245403 \tabularnewline
6 & 112.6 & 116.570650556407 & -3.97065055640725 \tabularnewline
7 & 107.3 & 114.392991588930 & -7.09299158893029 \tabularnewline
8 & 98.9 & 113.027245503069 & -14.1272455030689 \tabularnewline
9 & 109.8 & 117.247718220725 & -7.44771822072541 \tabularnewline
10 & 104.9 & 104.601180933811 & 0.298819066188907 \tabularnewline
11 & 102.2 & 98.2208694709242 & 3.97913052907578 \tabularnewline
12 & 123.9 & 114.802548891207 & 9.0974511087929 \tabularnewline
13 & 124.9 & 115.419469003585 & 9.48053099641523 \tabularnewline
14 & 112.7 & 110.142990113442 & 2.55700988655813 \tabularnewline
15 & 121.9 & 110.522736794428 & 11.3772632055720 \tabularnewline
16 & 100.6 & 107.587433784893 & -6.98743378489335 \tabularnewline
17 & 104.3 & 109.834340236344 & -5.53434023634358 \tabularnewline
18 & 120.4 & 122.953142091848 & -2.55314209184758 \tabularnewline
19 & 107.5 & 116.850151317493 & -9.35015131749261 \tabularnewline
20 & 102.9 & 111.246394155187 & -8.34639415518683 \tabularnewline
21 & 125.6 & 121.781960244225 & 3.81803975577496 \tabularnewline
22 & 107.5 & 105.341237727901 & 2.15876227209909 \tabularnewline
23 & 108.8 & 104.114697004444 & 4.68530299555617 \tabularnewline
24 & 128.4 & 120.145764440131 & 8.25423555986905 \tabularnewline
25 & 121.1 & 118.526016958548 & 2.573983041452 \tabularnewline
26 & 119.5 & 114.130980297453 & 5.36901970254732 \tabularnewline
27 & 128.7 & 112.160353387438 & 16.5396466125623 \tabularnewline
28 & 108.7 & 109.203580405007 & -0.503580405007264 \tabularnewline
29 & 105.5 & 111.184115419873 & -5.68411541987297 \tabularnewline
30 & 119.8 & 119.965468451850 & -0.165468451849764 \tabularnewline
31 & 111.3 & 114.699841035294 & -3.39984103529407 \tabularnewline
32 & 110.6 & 111.111218185251 & -0.511218185250589 \tabularnewline
33 & 120.1 & 123.120786175807 & -3.02078617580706 \tabularnewline
34 & 97.5 & 102.650933960415 & -5.15093396041515 \tabularnewline
35 & 107.7 & 104.384007797220 & 3.31599220278032 \tabularnewline
36 & 127.3 & 118.455348685659 & 8.84465131434085 \tabularnewline
37 & 117.2 & 112.403736283851 & 4.79626371614926 \tabularnewline
38 & 119.8 & 115.361219660739 & 4.43878033926101 \tabularnewline
39 & 116.2 & 112.138503772723 & 4.06149622727696 \tabularnewline
40 & 111 & 111.575093216265 & -0.575093216265297 \tabularnewline
41 & 112.4 & 113.810719663129 & -1.41071966312929 \tabularnewline
42 & 130.6 & 125.200428185117 & 5.39957181488324 \tabularnewline
43 & 109.1 & 112.745185027611 & -3.64518502761112 \tabularnewline
44 & 118.8 & 121.018204515506 & -2.21820451550594 \tabularnewline
45 & 123.9 & 124.881588339709 & -0.981588339708932 \tabularnewline
46 & 101.6 & 105.027186558599 & -3.42718655859905 \tabularnewline
47 & 112.8 & 106.649114112735 & 6.15088588726453 \tabularnewline
48 & 128 & 120.988296115855 & 7.01170388414487 \tabularnewline
49 & 129.6 & 121.783050280502 & 7.81694971949823 \tabularnewline
50 & 125.8 & 120.19975141623 & 5.60024858377 \tabularnewline
51 & 119.5 & 115.062098246672 & 4.43790175332751 \tabularnewline
52 & 115.7 & 118.053421637319 & -2.35342163731943 \tabularnewline
53 & 113.6 & 117.933175422619 & -4.33317542261856 \tabularnewline
54 & 129.7 & 128.649845672756 & 1.05015432724407 \tabularnewline
55 & 112 & 119.800004440444 & -7.80000444044375 \tabularnewline
56 & 116.8 & 121.924104962821 & -5.1241049628207 \tabularnewline
57 & 127 & 129.723769845849 & -2.72376984584908 \tabularnewline
58 & 112.9 & 111.959200042358 & 0.940799957641612 \tabularnewline
59 & 113.3 & 110.711091567645 & 2.58890843235461 \tabularnewline
60 & 121.7 & 120.992325508323 & 0.707674491676814 \tabularnewline
\hline
\end{tabular}
%Source: https://freestatistics.org/blog/index.php?pk=4810&T=4

[TABLE]
[ROW][C]Multiple Linear Regression - Actuals, Interpolation, and Residuals[/C][/ROW]
[ROW][C]Time or Index[/C][C]Actuals[/C][C]InterpolationForecast[/C][C]ResidualsPrediction Error[/C][/ROW]
[ROW][C]1[/C][C]117[/C][C]123.522333582328[/C][C]-6.52233358232794[/C][/ROW]
[ROW][C]2[/C][C]103.8[/C][C]111.466457758790[/C][C]-7.6664577587895[/C][/ROW]
[ROW][C]3[/C][C]100.8[/C][C]110.383813295482[/C][C]-9.5838132954825[/C][/ROW]
[ROW][C]4[/C][C]110.6[/C][C]108.750605736760[/C][C]1.84939426324015[/C][/ROW]
[ROW][C]5[/C][C]104[/C][C]110.989502292454[/C][C]-6.98950229245403[/C][/ROW]
[ROW][C]6[/C][C]112.6[/C][C]116.570650556407[/C][C]-3.97065055640725[/C][/ROW]
[ROW][C]7[/C][C]107.3[/C][C]114.392991588930[/C][C]-7.09299158893029[/C][/ROW]
[ROW][C]8[/C][C]98.9[/C][C]113.027245503069[/C][C]-14.1272455030689[/C][/ROW]
[ROW][C]9[/C][C]109.8[/C][C]117.247718220725[/C][C]-7.44771822072541[/C][/ROW]
[ROW][C]10[/C][C]104.9[/C][C]104.601180933811[/C][C]0.298819066188907[/C][/ROW]
[ROW][C]11[/C][C]102.2[/C][C]98.2208694709242[/C][C]3.97913052907578[/C][/ROW]
[ROW][C]12[/C][C]123.9[/C][C]114.802548891207[/C][C]9.0974511087929[/C][/ROW]
[ROW][C]13[/C][C]124.9[/C][C]115.419469003585[/C][C]9.48053099641523[/C][/ROW]
[ROW][C]14[/C][C]112.7[/C][C]110.142990113442[/C][C]2.55700988655813[/C][/ROW]
[ROW][C]15[/C][C]121.9[/C][C]110.522736794428[/C][C]11.3772632055720[/C][/ROW]
[ROW][C]16[/C][C]100.6[/C][C]107.587433784893[/C][C]-6.98743378489335[/C][/ROW]
[ROW][C]17[/C][C]104.3[/C][C]109.834340236344[/C][C]-5.53434023634358[/C][/ROW]
[ROW][C]18[/C][C]120.4[/C][C]122.953142091848[/C][C]-2.55314209184758[/C][/ROW]
[ROW][C]19[/C][C]107.5[/C][C]116.850151317493[/C][C]-9.35015131749261[/C][/ROW]
[ROW][C]20[/C][C]102.9[/C][C]111.246394155187[/C][C]-8.34639415518683[/C][/ROW]
[ROW][C]21[/C][C]125.6[/C][C]121.781960244225[/C][C]3.81803975577496[/C][/ROW]
[ROW][C]22[/C][C]107.5[/C][C]105.341237727901[/C][C]2.15876227209909[/C][/ROW]
[ROW][C]23[/C][C]108.8[/C][C]104.114697004444[/C][C]4.68530299555617[/C][/ROW]
[ROW][C]24[/C][C]128.4[/C][C]120.145764440131[/C][C]8.25423555986905[/C][/ROW]
[ROW][C]25[/C][C]121.1[/C][C]118.526016958548[/C][C]2.573983041452[/C][/ROW]
[ROW][C]26[/C][C]119.5[/C][C]114.130980297453[/C][C]5.36901970254732[/C][/ROW]
[ROW][C]27[/C][C]128.7[/C][C]112.160353387438[/C][C]16.5396466125623[/C][/ROW]
[ROW][C]28[/C][C]108.7[/C][C]109.203580405007[/C][C]-0.503580405007264[/C][/ROW]
[ROW][C]29[/C][C]105.5[/C][C]111.184115419873[/C][C]-5.68411541987297[/C][/ROW]
[ROW][C]30[/C][C]119.8[/C][C]119.965468451850[/C][C]-0.165468451849764[/C][/ROW]
[ROW][C]31[/C][C]111.3[/C][C]114.699841035294[/C][C]-3.39984103529407[/C][/ROW]
[ROW][C]32[/C][C]110.6[/C][C]111.111218185251[/C][C]-0.511218185250589[/C][/ROW]
[ROW][C]33[/C][C]120.1[/C][C]123.120786175807[/C][C]-3.02078617580706[/C][/ROW]
[ROW][C]34[/C][C]97.5[/C][C]102.650933960415[/C][C]-5.15093396041515[/C][/ROW]
[ROW][C]35[/C][C]107.7[/C][C]104.384007797220[/C][C]3.31599220278032[/C][/ROW]
[ROW][C]36[/C][C]127.3[/C][C]118.455348685659[/C][C]8.84465131434085[/C][/ROW]
[ROW][C]37[/C][C]117.2[/C][C]112.403736283851[/C][C]4.79626371614926[/C][/ROW]
[ROW][C]38[/C][C]119.8[/C][C]115.361219660739[/C][C]4.43878033926101[/C][/ROW]
[ROW][C]39[/C][C]116.2[/C][C]112.138503772723[/C][C]4.06149622727696[/C][/ROW]
[ROW][C]40[/C][C]111[/C][C]111.575093216265[/C][C]-0.575093216265297[/C][/ROW]
[ROW][C]41[/C][C]112.4[/C][C]113.810719663129[/C][C]-1.41071966312929[/C][/ROW]
[ROW][C]42[/C][C]130.6[/C][C]125.200428185117[/C][C]5.39957181488324[/C][/ROW]
[ROW][C]43[/C][C]109.1[/C][C]112.745185027611[/C][C]-3.64518502761112[/C][/ROW]
[ROW][C]44[/C][C]118.8[/C][C]121.018204515506[/C][C]-2.21820451550594[/C][/ROW]
[ROW][C]45[/C][C]123.9[/C][C]124.881588339709[/C][C]-0.981588339708932[/C][/ROW]
[ROW][C]46[/C][C]101.6[/C][C]105.027186558599[/C][C]-3.42718655859905[/C][/ROW]
[ROW][C]47[/C][C]112.8[/C][C]106.649114112735[/C][C]6.15088588726453[/C][/ROW]
[ROW][C]48[/C][C]128[/C][C]120.988296115855[/C][C]7.01170388414487[/C][/ROW]
[ROW][C]49[/C][C]129.6[/C][C]121.783050280502[/C][C]7.81694971949823[/C][/ROW]
[ROW][C]50[/C][C]125.8[/C][C]120.19975141623[/C][C]5.60024858377[/C][/ROW]
[ROW][C]51[/C][C]119.5[/C][C]115.062098246672[/C][C]4.43790175332751[/C][/ROW]
[ROW][C]52[/C][C]115.7[/C][C]118.053421637319[/C][C]-2.35342163731943[/C][/ROW]
[ROW][C]53[/C][C]113.6[/C][C]117.933175422619[/C][C]-4.33317542261856[/C][/ROW]
[ROW][C]54[/C][C]129.7[/C][C]128.649845672756[/C][C]1.05015432724407[/C][/ROW]
[ROW][C]55[/C][C]112[/C][C]119.800004440444[/C][C]-7.80000444044375[/C][/ROW]
[ROW][C]56[/C][C]116.8[/C][C]121.924104962821[/C][C]-5.1241049628207[/C][/ROW]
[ROW][C]57[/C][C]127[/C][C]129.723769845849[/C][C]-2.72376984584908[/C][/ROW]
[ROW][C]58[/C][C]112.9[/C][C]111.959200042358[/C][C]0.940799957641612[/C][/ROW]
[ROW][C]59[/C][C]113.3[/C][C]110.711091567645[/C][C]2.58890843235461[/C][/ROW]
[ROW][C]60[/C][C]121.7[/C][C]120.992325508323[/C][C]0.707674491676814[/C][/ROW]
[/TABLE]
Source: https://freestatistics.org/blog/index.php?pk=4810&T=4

Globally Unique Identifier (entire table): ba.freestatistics.org/blog/index.php?pk=4810&T=4

As an alternative you can also use a QR Code:  

The GUIDs for individual cells are displayed in the table below:

Multiple Linear Regression - Actuals, Interpolation, and Residuals
Time or IndexActualsInterpolationForecastResidualsPrediction Error
1117123.522333582328-6.52233358232794
2103.8111.466457758790-7.6664577587895
3100.8110.383813295482-9.5838132954825
4110.6108.7506057367601.84939426324015
5104110.989502292454-6.98950229245403
6112.6116.570650556407-3.97065055640725
7107.3114.392991588930-7.09299158893029
898.9113.027245503069-14.1272455030689
9109.8117.247718220725-7.44771822072541
10104.9104.6011809338110.298819066188907
11102.298.22086947092423.97913052907578
12123.9114.8025488912079.0974511087929
13124.9115.4194690035859.48053099641523
14112.7110.1429901134422.55700988655813
15121.9110.52273679442811.3772632055720
16100.6107.587433784893-6.98743378489335
17104.3109.834340236344-5.53434023634358
18120.4122.953142091848-2.55314209184758
19107.5116.850151317493-9.35015131749261
20102.9111.246394155187-8.34639415518683
21125.6121.7819602442253.81803975577496
22107.5105.3412377279012.15876227209909
23108.8104.1146970044444.68530299555617
24128.4120.1457644401318.25423555986905
25121.1118.5260169585482.573983041452
26119.5114.1309802974535.36901970254732
27128.7112.16035338743816.5396466125623
28108.7109.203580405007-0.503580405007264
29105.5111.184115419873-5.68411541987297
30119.8119.965468451850-0.165468451849764
31111.3114.699841035294-3.39984103529407
32110.6111.111218185251-0.511218185250589
33120.1123.120786175807-3.02078617580706
3497.5102.650933960415-5.15093396041515
35107.7104.3840077972203.31599220278032
36127.3118.4553486856598.84465131434085
37117.2112.4037362838514.79626371614926
38119.8115.3612196607394.43878033926101
39116.2112.1385037727234.06149622727696
40111111.575093216265-0.575093216265297
41112.4113.810719663129-1.41071966312929
42130.6125.2004281851175.39957181488324
43109.1112.745185027611-3.64518502761112
44118.8121.018204515506-2.21820451550594
45123.9124.881588339709-0.981588339708932
46101.6105.027186558599-3.42718655859905
47112.8106.6491141127356.15088588726453
48128120.9882961158557.01170388414487
49129.6121.7830502805027.81694971949823
50125.8120.199751416235.60024858377
51119.5115.0620982466724.43790175332751
52115.7118.053421637319-2.35342163731943
53113.6117.933175422619-4.33317542261856
54129.7128.6498456727561.05015432724407
55112119.800004440444-7.80000444044375
56116.8121.924104962821-5.1241049628207
57127129.723769845849-2.72376984584908
58112.9111.9592000423580.940799957641612
59113.3110.7110915676452.58890843235461
60121.7120.9923255083230.707674491676814


Parameters (Session):
par1 = 3 ; par2 = Do not include Seasonal Dummies ; par3 = No Linear Trend ;
Parameters (R input):
par1 = 3 ; par2 = Do not include Seasonal Dummies ; par3 = No Linear Trend ;
R code (references can be found in the software module):
library(lattice)
par1 <- as.numeric(par1)
x <- t(y)
k <- length(x[1,])
n <- length(x[,1])
x1 <- cbind(x[,par1], x[,1:k!=par1])
mycolnames <- c(colnames(x)[par1], colnames(x)[1:k!=par1])
colnames(x1) <- mycolnames #colnames(x)[par1]
x <- x1
if (par3 == 'First Differences'){
x2 <- array(0, dim=c(n-1,k), dimnames=list(1:(n-1), paste('(1-B)',colnames(x),sep='')))
for (i in 1:n-1) {
for (j in 1:k) {
x2[i,j] <- x[i+1,j] - x[i,j]
}
}
x <- x2
}
if (par2 == 'Include Monthly Dummies'){
x2 <- array(0, dim=c(n,11), dimnames=list(1:n, paste('M', seq(1:11), sep ='')))
for (i in 1:11){
x2[seq(i,n,12),i] <- 1
}
x <- cbind(x, x2)
}
if (par2 == 'Include Quarterly Dummies'){
x2 <- array(0, dim=c(n,3), dimnames=list(1:n, paste('Q', seq(1:3), sep ='')))
for (i in 1:3){
x2[seq(i,n,4),i] <- 1
}
x <- cbind(x, x2)
}
k <- length(x[1,])
if (par3 == 'Linear Trend'){
x <- cbind(x, c(1:n))
colnames(x)[k+1] <- 't'
}
x
k <- length(x[1,])
df <- as.data.frame(x)
(mylm <- lm(df))
(mysum <- summary(mylm))
bitmap(file='test0.png')
plot(x[,1], type='l', main='Actuals and Interpolation', ylab='value of Actuals and Interpolation (dots)', xlab='time or index')
points(x[,1]-mysum$resid)
grid()
dev.off()
bitmap(file='test1.png')
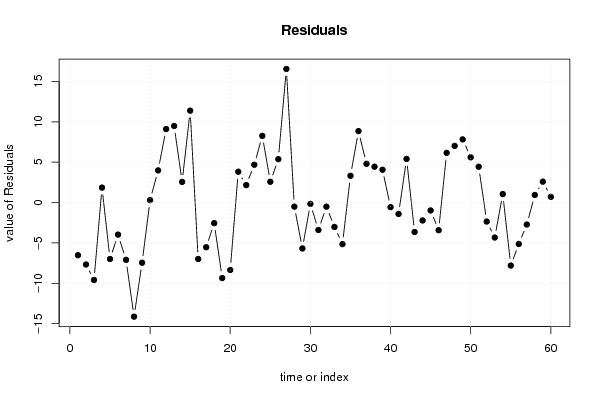
plot(mysum$resid, type='b', pch=19, main='Residuals', ylab='value of Residuals', xlab='time or index')
grid()
dev.off()
bitmap(file='test2.png')
hist(mysum$resid, main='Residual Histogram', xlab='values of Residuals')
grid()
dev.off()
bitmap(file='test3.png')
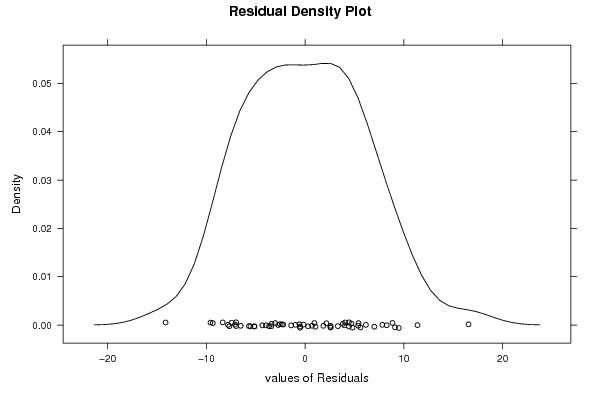
densityplot(~mysum$resid,col='black',main='Residual Density Plot', xlab='values of Residuals')
dev.off()
bitmap(file='test4.png')
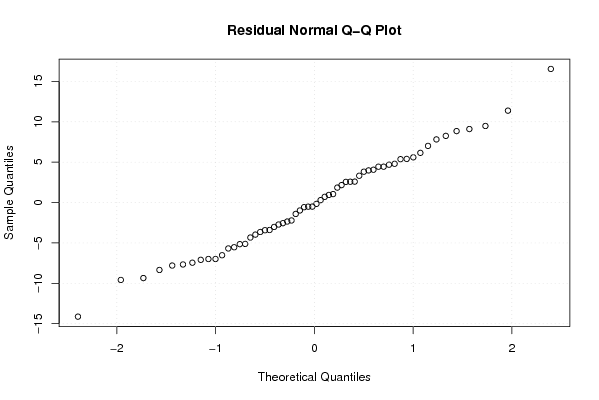
qqnorm(mysum$resid, main='Residual Normal Q-Q Plot')
grid()
dev.off()
(myerror <- as.ts(mysum$resid))
bitmap(file='test5.png')
dum <- cbind(lag(myerror,k=1),myerror)
dum
dum1 <- dum[2:length(myerror),]
dum1
z <- as.data.frame(dum1)
z
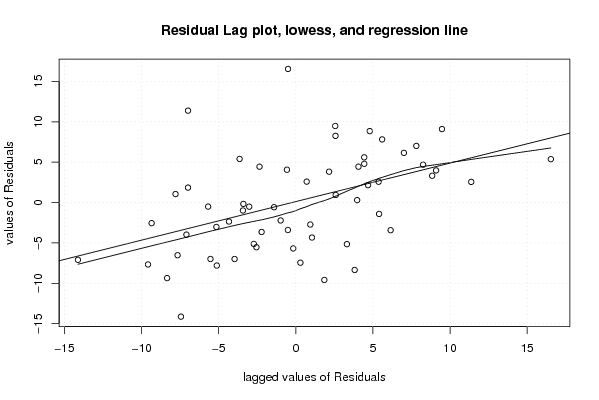
plot(z,main=paste('Residual Lag plot, lowess, and regression line'), ylab='values of Residuals', xlab='lagged values of Residuals')
lines(lowess(z))
abline(lm(z))
grid()
dev.off()
bitmap(file='test6.png')
acf(mysum$resid, lag.max=length(mysum$resid)/2, main='Residual Autocorrelation Function')
grid()
dev.off()
bitmap(file='test7.png')
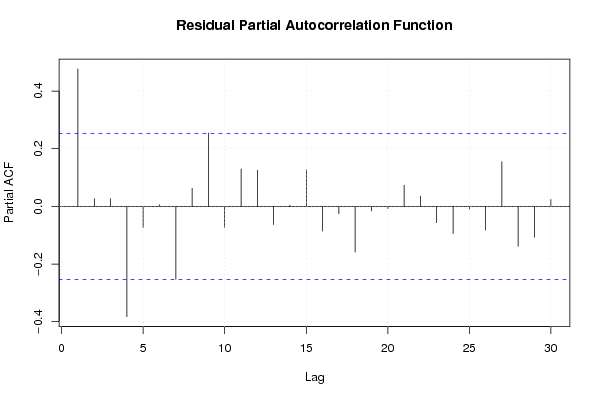
pacf(mysum$resid, lag.max=length(mysum$resid)/2, main='Residual Partial Autocorrelation Function')
grid()
dev.off()
bitmap(file='test8.png')
opar <- par(mfrow = c(2,2), oma = c(0, 0, 1.1, 0))
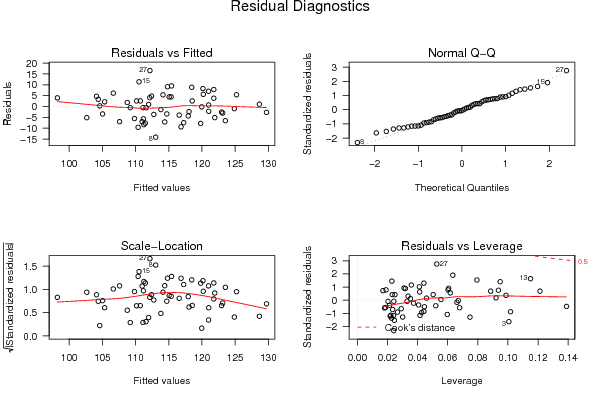
plot(mylm, las = 1, sub='Residual Diagnostics')
par(opar)
dev.off()
load(file='createtable')
a<-table.start()
a<-table.row.start(a)
a<-table.element(a, 'Multiple Linear Regression - Estimated Regression Equation', 1, TRUE)
a<-table.row.end(a)
myeq <- colnames(x)[1]
myeq <- paste(myeq, '[t] = ', sep='')
for (i in 1:k){
if (mysum$coefficients[i,1] > 0) myeq <- paste(myeq, '+', '')
myeq <- paste(myeq, mysum$coefficients[i,1], sep=' ')
if (rownames(mysum$coefficients)[i] != '(Intercept)') {
myeq <- paste(myeq, rownames(mysum$coefficients)[i], sep='')
if (rownames(mysum$coefficients)[i] != 't') myeq <- paste(myeq, '[t]', sep='')
}
}
myeq <- paste(myeq, ' + e[t]')
a<-table.row.start(a)
a<-table.element(a, myeq)
a<-table.row.end(a)
a<-table.end(a)
table.save(a,file='mytable1.tab')
a<-table.start()
a<-table.row.start(a)
a<-table.element(a,hyperlink('ols1.htm','Multiple Linear Regression - Ordinary Least Squares',''), 6, TRUE)
a<-table.row.end(a)
a<-table.row.start(a)
a<-table.element(a,'Variable',header=TRUE)
a<-table.element(a,'Parameter',header=TRUE)
a<-table.element(a,'S.D.',header=TRUE)
a<-table.element(a,'T-STAT
H0: parameter = 0',header=TRUE)
a<-table.element(a,'2-tail p-value',header=TRUE)
a<-table.element(a,'1-tail p-value',header=TRUE)
a<-table.row.end(a)
for (i in 1:k){
a<-table.row.start(a)
a<-table.element(a,rownames(mysum$coefficients)[i],header=TRUE)
a<-table.element(a,mysum$coefficients[i,1])
a<-table.element(a, round(mysum$coefficients[i,2],6))
a<-table.element(a, round(mysum$coefficients[i,3],4))
a<-table.element(a, round(mysum$coefficients[i,4],6))
a<-table.element(a, round(mysum$coefficients[i,4]/2,6))
a<-table.row.end(a)
}
a<-table.end(a)
table.save(a,file='mytable2.tab')
a<-table.start()
a<-table.row.start(a)
a<-table.element(a, 'Multiple Linear Regression - Regression Statistics', 2, TRUE)
a<-table.row.end(a)
a<-table.row.start(a)
a<-table.element(a, 'Multiple R',1,TRUE)
a<-table.element(a, sqrt(mysum$r.squared))
a<-table.row.end(a)
a<-table.row.start(a)
a<-table.element(a, 'R-squared',1,TRUE)
a<-table.element(a, mysum$r.squared)
a<-table.row.end(a)
a<-table.row.start(a)
a<-table.element(a, 'Adjusted R-squared',1,TRUE)
a<-table.element(a, mysum$adj.r.squared)
a<-table.row.end(a)
a<-table.row.start(a)
a<-table.element(a, 'F-TEST (value)',1,TRUE)
a<-table.element(a, mysum$fstatistic[1])
a<-table.row.end(a)
a<-table.row.start(a)
a<-table.element(a, 'F-TEST (DF numerator)',1,TRUE)
a<-table.element(a, mysum$fstatistic[2])
a<-table.row.end(a)
a<-table.row.start(a)
a<-table.element(a, 'F-TEST (DF denominator)',1,TRUE)
a<-table.element(a, mysum$fstatistic[3])
a<-table.row.end(a)
a<-table.row.start(a)
a<-table.element(a, 'p-value',1,TRUE)
a<-table.element(a, 1-pf(mysum$fstatistic[1],mysum$fstatistic[2],mysum$fstatistic[3]))
a<-table.row.end(a)
a<-table.row.start(a)
a<-table.element(a, 'Multiple Linear Regression - Residual Statistics', 2, TRUE)
a<-table.row.end(a)
a<-table.row.start(a)
a<-table.element(a, 'Residual Standard Deviation',1,TRUE)
a<-table.element(a, mysum$sigma)
a<-table.row.end(a)
a<-table.row.start(a)
a<-table.element(a, 'Sum Squared Residuals',1,TRUE)
a<-table.element(a, sum(myerror*myerror))
a<-table.row.end(a)
a<-table.end(a)
table.save(a,file='mytable3.tab')
a<-table.start()
a<-table.row.start(a)
a<-table.element(a, 'Multiple Linear Regression - Actuals, Interpolation, and Residuals', 4, TRUE)
a<-table.row.end(a)
a<-table.row.start(a)
a<-table.element(a, 'Time or Index', 1, TRUE)
a<-table.element(a, 'Actuals', 1, TRUE)
a<-table.element(a, 'Interpolation
Forecast', 1, TRUE)
a<-table.element(a, 'Residuals
Prediction Error', 1, TRUE)
a<-table.row.end(a)
for (i in 1:n) {
a<-table.row.start(a)
a<-table.element(a,i, 1, TRUE)
a<-table.element(a,x[i])
a<-table.element(a,x[i]-mysum$resid[i])
a<-table.element(a,mysum$resid[i])
a<-table.row.end(a)
}
a<-table.end(a)
table.save(a,file='mytable4.tab')