Free Statistics

of Irreproducible Research!

Author's title

Author*Unverified author*
R Software Modulerwasp_autocorrelation.wasp
Title produced by software(Partial) Autocorrelation Function
Date of computationTue, 27 Nov 2007 03:15:48 -0700
Cite this page as followsStatistical Computations at FreeStatistics.org, Office for Research Development and Education, URL https://freestatistics.org/blog/index.php?v=date/2007/Nov/27/t1196158057leswkie9fb3dhj3.htm/, Retrieved Sat, 27 Apr 2024 21:07:54 +0000
Statistical Computations at FreeStatistics.org, Office for Research Development and Education, URL https://freestatistics.org/blog/index.php?pk=6811, Retrieved Sat, 27 Apr 2024 21:07:54 +0000
QR Codes:

Original text written by user:
IsPrivate?No (this computation is public)
User-defined keywordsYannick Leroy, NIck Vandewalle, Jeroen Goetschalckx, Nick Van Hove, Jef Jacobs, Michiel Van den Broeck
Estimated Impact228
Family? (F = Feedback message, R = changed R code, M = changed R Module, P = changed Parameters, D = changed Data)
-       [(Partial) Autocorrelation Function] [Autocorrelation d...] [2007-11-27 10:15:48] [9ec4fcc2bfe8b6d942eac6074e595603] [Current]
- RMPD    [(Partial) Autocorrelation Function] [PAPER] [2009-12-02 23:12:16] [37daf76adc256428993ec4063536c760]
Feedback Forum

Post a new message
Dataseries X:
3.926
3.517
4.142
4.353
5.029
4.755
3.862
4.406
4.567
4.863
4.121
3.626
3.804
3.491
4.151
4.254
4.717
4.866
4.001
3.758
4.78
5.016
4.296
4.467
3.891
3.872
3.867
3.973
4.64
4.538
3.836
3.77
4.374
4.497
3.945
3.862
3.608
3.301
3.882
3.605
4.305
4.216
3.971
3.988
4.317
4.484
4.247
3.52
3.687
3.405
3.99
4.047
4.549
4.559
3.926
4.206
4.517
4.387
3.219
3.129


Summary of compuational transaction
Raw Inputview raw input (R code)
Raw Outputview raw output of R engine
Computing time1 seconds
R Server'Gwilym Jenkins' @ 72.249.127.135

\begin{tabular}{lllllllll}
\hline
Summary of compuational transaction \tabularnewline
Raw Input & view raw input (R code)  \tabularnewline
Raw Output & view raw output of R engine  \tabularnewline
Computing time & 1 seconds \tabularnewline
R Server & 'Gwilym Jenkins' @ 72.249.127.135 \tabularnewline
\hline
\end{tabular}
%Source: https://freestatistics.org/blog/index.php?pk=6811&T=0

[TABLE]
[ROW][C]Summary of compuational transaction[/C][/ROW]
[ROW][C]Raw Input[/C][C]view raw input (R code) [/C][/ROW]
[ROW][C]Raw Output[/C][C]view raw output of R engine [/C][/ROW]
[ROW][C]Computing time[/C][C]1 seconds[/C][/ROW]
[ROW][C]R Server[/C][C]'Gwilym Jenkins' @ 72.249.127.135[/C][/ROW]
[/TABLE]
Source: https://freestatistics.org/blog/index.php?pk=6811&T=0

Globally Unique Identifier (entire table): ba.freestatistics.org/blog/index.php?pk=6811&T=0

As an alternative you can also use a QR Code:  

The GUIDs for individual cells are displayed in the table below:

Summary of compuational transaction
Raw Inputview raw input (R code)
Raw Outputview raw output of R engine
Computing time1 seconds
R Server'Gwilym Jenkins' @ 72.249.127.135


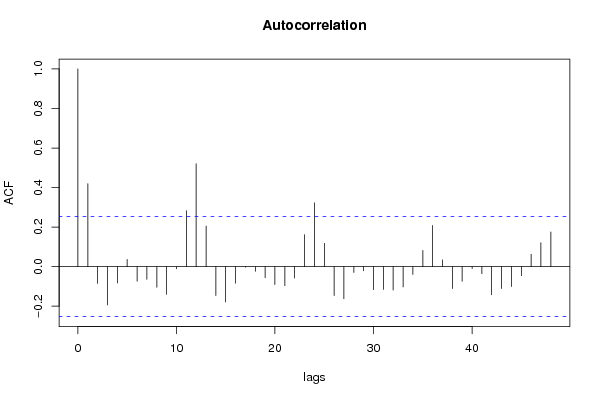
Autocorrelation Function
Time lag kACF(k)T-STATP-value
017.7460
10.4195863.25010.000947
2-0.085145-0.65950.74396
3-0.193771-1.50090.930693
4-0.082252-0.63710.736764
50.0361330.27990.390266
6-0.073646-0.57050.714752
7-0.064461-0.49930.690308
8-0.104665-0.81070.789638
9-0.140177-1.08580.859046
10-0.010922-0.08460.53357
110.2833092.19450.016041
120.5206584.0337.9e-05
130.2055411.59210.058307
14-0.146059-1.13140.868799
15-0.178368-1.38160.913896
16-0.083547-0.64710.739998
17-0.003097-0.0240.509529
18-0.0237-0.18360.57252
19-0.056616-0.43850.668717
20-0.0907-0.70260.757477
21-0.096567-0.7480.77131
22-0.057687-0.44680.671702
230.1618081.25340.107469
240.3225892.49880.007609
250.1179920.9140.182198
26-0.146513-1.13490.869532
27-0.162111-1.25570.892955
28-0.029676-0.22990.590514
29-0.021421-0.16590.565612
30-0.116871-0.90530.815532
31-0.115071-0.89130.811845
32-0.11875-0.91980.819327
33-0.102617-0.79490.785088
34-0.039559-0.30640.619827
350.0818290.63380.264295
360.2085281.61530.055751
370.0342050.2650.395977
38-0.111158-0.8610.803674
39-0.074445-0.57660.716832
40-0.009502-0.07360.529215
41-0.035469-0.27470.60777
42-0.142541-1.10410.863025
43-0.110764-0.8580.80284
44-0.101065-0.78280.781601
45-0.045841-0.35510.638115
460.0631930.48950.31314
470.1214010.94040.175399

\begin{tabular}{lllllllll}
\hline
Autocorrelation Function \tabularnewline
Time lag k & ACF(k) & T-STAT & P-value \tabularnewline
0 & 1 & 7.746 & 0 \tabularnewline
1 & 0.419586 & 3.2501 & 0.000947 \tabularnewline
2 & -0.085145 & -0.6595 & 0.74396 \tabularnewline
3 & -0.193771 & -1.5009 & 0.930693 \tabularnewline
4 & -0.082252 & -0.6371 & 0.736764 \tabularnewline
5 & 0.036133 & 0.2799 & 0.390266 \tabularnewline
6 & -0.073646 & -0.5705 & 0.714752 \tabularnewline
7 & -0.064461 & -0.4993 & 0.690308 \tabularnewline
8 & -0.104665 & -0.8107 & 0.789638 \tabularnewline
9 & -0.140177 & -1.0858 & 0.859046 \tabularnewline
10 & -0.010922 & -0.0846 & 0.53357 \tabularnewline
11 & 0.283309 & 2.1945 & 0.016041 \tabularnewline
12 & 0.520658 & 4.033 & 7.9e-05 \tabularnewline
13 & 0.205541 & 1.5921 & 0.058307 \tabularnewline
14 & -0.146059 & -1.1314 & 0.868799 \tabularnewline
15 & -0.178368 & -1.3816 & 0.913896 \tabularnewline
16 & -0.083547 & -0.6471 & 0.739998 \tabularnewline
17 & -0.003097 & -0.024 & 0.509529 \tabularnewline
18 & -0.0237 & -0.1836 & 0.57252 \tabularnewline
19 & -0.056616 & -0.4385 & 0.668717 \tabularnewline
20 & -0.0907 & -0.7026 & 0.757477 \tabularnewline
21 & -0.096567 & -0.748 & 0.77131 \tabularnewline
22 & -0.057687 & -0.4468 & 0.671702 \tabularnewline
23 & 0.161808 & 1.2534 & 0.107469 \tabularnewline
24 & 0.322589 & 2.4988 & 0.007609 \tabularnewline
25 & 0.117992 & 0.914 & 0.182198 \tabularnewline
26 & -0.146513 & -1.1349 & 0.869532 \tabularnewline
27 & -0.162111 & -1.2557 & 0.892955 \tabularnewline
28 & -0.029676 & -0.2299 & 0.590514 \tabularnewline
29 & -0.021421 & -0.1659 & 0.565612 \tabularnewline
30 & -0.116871 & -0.9053 & 0.815532 \tabularnewline
31 & -0.115071 & -0.8913 & 0.811845 \tabularnewline
32 & -0.11875 & -0.9198 & 0.819327 \tabularnewline
33 & -0.102617 & -0.7949 & 0.785088 \tabularnewline
34 & -0.039559 & -0.3064 & 0.619827 \tabularnewline
35 & 0.081829 & 0.6338 & 0.264295 \tabularnewline
36 & 0.208528 & 1.6153 & 0.055751 \tabularnewline
37 & 0.034205 & 0.265 & 0.395977 \tabularnewline
38 & -0.111158 & -0.861 & 0.803674 \tabularnewline
39 & -0.074445 & -0.5766 & 0.716832 \tabularnewline
40 & -0.009502 & -0.0736 & 0.529215 \tabularnewline
41 & -0.035469 & -0.2747 & 0.60777 \tabularnewline
42 & -0.142541 & -1.1041 & 0.863025 \tabularnewline
43 & -0.110764 & -0.858 & 0.80284 \tabularnewline
44 & -0.101065 & -0.7828 & 0.781601 \tabularnewline
45 & -0.045841 & -0.3551 & 0.638115 \tabularnewline
46 & 0.063193 & 0.4895 & 0.31314 \tabularnewline
47 & 0.121401 & 0.9404 & 0.175399 \tabularnewline
\hline
\end{tabular}
%Source: https://freestatistics.org/blog/index.php?pk=6811&T=1

[TABLE]
[ROW][C]Autocorrelation Function[/C][/ROW]
[ROW][C]Time lag k[/C][C]ACF(k)[/C][C]T-STAT[/C][C]P-value[/C][/ROW]
[ROW][C]0[/C][C]1[/C][C]7.746[/C][C]0[/C][/ROW]
[ROW][C]1[/C][C]0.419586[/C][C]3.2501[/C][C]0.000947[/C][/ROW]
[ROW][C]2[/C][C]-0.085145[/C][C]-0.6595[/C][C]0.74396[/C][/ROW]
[ROW][C]3[/C][C]-0.193771[/C][C]-1.5009[/C][C]0.930693[/C][/ROW]
[ROW][C]4[/C][C]-0.082252[/C][C]-0.6371[/C][C]0.736764[/C][/ROW]
[ROW][C]5[/C][C]0.036133[/C][C]0.2799[/C][C]0.390266[/C][/ROW]
[ROW][C]6[/C][C]-0.073646[/C][C]-0.5705[/C][C]0.714752[/C][/ROW]
[ROW][C]7[/C][C]-0.064461[/C][C]-0.4993[/C][C]0.690308[/C][/ROW]
[ROW][C]8[/C][C]-0.104665[/C][C]-0.8107[/C][C]0.789638[/C][/ROW]
[ROW][C]9[/C][C]-0.140177[/C][C]-1.0858[/C][C]0.859046[/C][/ROW]
[ROW][C]10[/C][C]-0.010922[/C][C]-0.0846[/C][C]0.53357[/C][/ROW]
[ROW][C]11[/C][C]0.283309[/C][C]2.1945[/C][C]0.016041[/C][/ROW]
[ROW][C]12[/C][C]0.520658[/C][C]4.033[/C][C]7.9e-05[/C][/ROW]
[ROW][C]13[/C][C]0.205541[/C][C]1.5921[/C][C]0.058307[/C][/ROW]
[ROW][C]14[/C][C]-0.146059[/C][C]-1.1314[/C][C]0.868799[/C][/ROW]
[ROW][C]15[/C][C]-0.178368[/C][C]-1.3816[/C][C]0.913896[/C][/ROW]
[ROW][C]16[/C][C]-0.083547[/C][C]-0.6471[/C][C]0.739998[/C][/ROW]
[ROW][C]17[/C][C]-0.003097[/C][C]-0.024[/C][C]0.509529[/C][/ROW]
[ROW][C]18[/C][C]-0.0237[/C][C]-0.1836[/C][C]0.57252[/C][/ROW]
[ROW][C]19[/C][C]-0.056616[/C][C]-0.4385[/C][C]0.668717[/C][/ROW]
[ROW][C]20[/C][C]-0.0907[/C][C]-0.7026[/C][C]0.757477[/C][/ROW]
[ROW][C]21[/C][C]-0.096567[/C][C]-0.748[/C][C]0.77131[/C][/ROW]
[ROW][C]22[/C][C]-0.057687[/C][C]-0.4468[/C][C]0.671702[/C][/ROW]
[ROW][C]23[/C][C]0.161808[/C][C]1.2534[/C][C]0.107469[/C][/ROW]
[ROW][C]24[/C][C]0.322589[/C][C]2.4988[/C][C]0.007609[/C][/ROW]
[ROW][C]25[/C][C]0.117992[/C][C]0.914[/C][C]0.182198[/C][/ROW]
[ROW][C]26[/C][C]-0.146513[/C][C]-1.1349[/C][C]0.869532[/C][/ROW]
[ROW][C]27[/C][C]-0.162111[/C][C]-1.2557[/C][C]0.892955[/C][/ROW]
[ROW][C]28[/C][C]-0.029676[/C][C]-0.2299[/C][C]0.590514[/C][/ROW]
[ROW][C]29[/C][C]-0.021421[/C][C]-0.1659[/C][C]0.565612[/C][/ROW]
[ROW][C]30[/C][C]-0.116871[/C][C]-0.9053[/C][C]0.815532[/C][/ROW]
[ROW][C]31[/C][C]-0.115071[/C][C]-0.8913[/C][C]0.811845[/C][/ROW]
[ROW][C]32[/C][C]-0.11875[/C][C]-0.9198[/C][C]0.819327[/C][/ROW]
[ROW][C]33[/C][C]-0.102617[/C][C]-0.7949[/C][C]0.785088[/C][/ROW]
[ROW][C]34[/C][C]-0.039559[/C][C]-0.3064[/C][C]0.619827[/C][/ROW]
[ROW][C]35[/C][C]0.081829[/C][C]0.6338[/C][C]0.264295[/C][/ROW]
[ROW][C]36[/C][C]0.208528[/C][C]1.6153[/C][C]0.055751[/C][/ROW]
[ROW][C]37[/C][C]0.034205[/C][C]0.265[/C][C]0.395977[/C][/ROW]
[ROW][C]38[/C][C]-0.111158[/C][C]-0.861[/C][C]0.803674[/C][/ROW]
[ROW][C]39[/C][C]-0.074445[/C][C]-0.5766[/C][C]0.716832[/C][/ROW]
[ROW][C]40[/C][C]-0.009502[/C][C]-0.0736[/C][C]0.529215[/C][/ROW]
[ROW][C]41[/C][C]-0.035469[/C][C]-0.2747[/C][C]0.60777[/C][/ROW]
[ROW][C]42[/C][C]-0.142541[/C][C]-1.1041[/C][C]0.863025[/C][/ROW]
[ROW][C]43[/C][C]-0.110764[/C][C]-0.858[/C][C]0.80284[/C][/ROW]
[ROW][C]44[/C][C]-0.101065[/C][C]-0.7828[/C][C]0.781601[/C][/ROW]
[ROW][C]45[/C][C]-0.045841[/C][C]-0.3551[/C][C]0.638115[/C][/ROW]
[ROW][C]46[/C][C]0.063193[/C][C]0.4895[/C][C]0.31314[/C][/ROW]
[ROW][C]47[/C][C]0.121401[/C][C]0.9404[/C][C]0.175399[/C][/ROW]
[/TABLE]
Source: https://freestatistics.org/blog/index.php?pk=6811&T=1

Globally Unique Identifier (entire table): ba.freestatistics.org/blog/index.php?pk=6811&T=1

As an alternative you can also use a QR Code:  

The GUIDs for individual cells are displayed in the table below:

Autocorrelation Function
Time lag kACF(k)T-STATP-value
017.7460
10.4195863.25010.000947
2-0.085145-0.65950.74396
3-0.193771-1.50090.930693
4-0.082252-0.63710.736764
50.0361330.27990.390266
6-0.073646-0.57050.714752
7-0.064461-0.49930.690308
8-0.104665-0.81070.789638
9-0.140177-1.08580.859046
10-0.010922-0.08460.53357
110.2833092.19450.016041
120.5206584.0337.9e-05
130.2055411.59210.058307
14-0.146059-1.13140.868799
15-0.178368-1.38160.913896
16-0.083547-0.64710.739998
17-0.003097-0.0240.509529
18-0.0237-0.18360.57252
19-0.056616-0.43850.668717
20-0.0907-0.70260.757477
21-0.096567-0.7480.77131
22-0.057687-0.44680.671702
230.1618081.25340.107469
240.3225892.49880.007609
250.1179920.9140.182198
26-0.146513-1.13490.869532
27-0.162111-1.25570.892955
28-0.029676-0.22990.590514
29-0.021421-0.16590.565612
30-0.116871-0.90530.815532
31-0.115071-0.89130.811845
32-0.11875-0.91980.819327
33-0.102617-0.79490.785088
34-0.039559-0.30640.619827
350.0818290.63380.264295
360.2085281.61530.055751
370.0342050.2650.395977
38-0.111158-0.8610.803674
39-0.074445-0.57660.716832
40-0.009502-0.07360.529215
41-0.035469-0.27470.60777
42-0.142541-1.10410.863025
43-0.110764-0.8580.80284
44-0.101065-0.78280.781601
45-0.045841-0.35510.638115
460.0631930.48950.31314
470.1214010.94040.175399


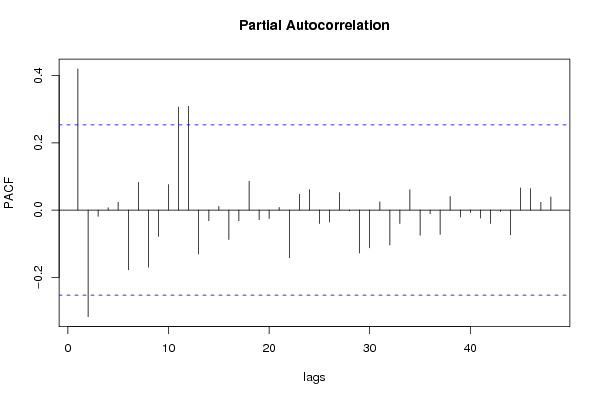
Partial Autocorrelation Function
Time lag kPACF(k)T-STATP-value
00.4195863.25010.000947
1-0.317007-2.45550.991509
2-0.018497-0.14330.556723
30.0071930.05570.477875
40.0231710.17950.429081
5-0.177697-1.37640.913098
60.0821530.63640.263484
7-0.169871-1.31580.903379
8-0.078541-0.60840.727383
90.0756680.58610.279995
100.3061152.37120.01048
110.3083252.38830.010046
12-0.130595-1.01160.842101
13-0.032024-0.24810.59753
140.0105930.08210.467438
15-0.087941-0.68120.750812
16-0.031559-0.24450.596143
170.0858330.66490.254344
18-0.028687-0.22220.587548
19-0.025293-0.19590.577331
200.0078410.06070.475886
21-0.142057-1.10040.862217
220.0472630.36610.357789
230.0606430.46970.320123
24-0.040288-0.31210.621966
25-0.035708-0.27660.608477
260.0519430.40230.344429
27-0.002264-0.01750.506967
28-0.127992-0.99140.83727
29-0.112167-0.86880.805803
300.024670.19110.424549
31-0.104078-0.80620.788341
32-0.040213-0.31150.621744
330.0605670.46910.320332
34-0.074628-0.57810.71731
35-0.010696-0.08290.532878
36-0.072283-0.55990.711183
370.0399790.30970.37894
38-0.02099-0.16260.564307
39-0.007556-0.05850.523238
40-0.023662-0.18330.572405
41-0.039744-0.30790.620371
42-0.004578-0.03550.514085
43-0.073655-0.57050.714775
440.0657240.50910.306277
450.063480.49170.312357
460.0228570.17710.430032
470.0390250.30230.38174

\begin{tabular}{lllllllll}
\hline
Partial Autocorrelation Function \tabularnewline
Time lag k & PACF(k) & T-STAT & P-value \tabularnewline
0 & 0.419586 & 3.2501 & 0.000947 \tabularnewline
1 & -0.317007 & -2.4555 & 0.991509 \tabularnewline
2 & -0.018497 & -0.1433 & 0.556723 \tabularnewline
3 & 0.007193 & 0.0557 & 0.477875 \tabularnewline
4 & 0.023171 & 0.1795 & 0.429081 \tabularnewline
5 & -0.177697 & -1.3764 & 0.913098 \tabularnewline
6 & 0.082153 & 0.6364 & 0.263484 \tabularnewline
7 & -0.169871 & -1.3158 & 0.903379 \tabularnewline
8 & -0.078541 & -0.6084 & 0.727383 \tabularnewline
9 & 0.075668 & 0.5861 & 0.279995 \tabularnewline
10 & 0.306115 & 2.3712 & 0.01048 \tabularnewline
11 & 0.308325 & 2.3883 & 0.010046 \tabularnewline
12 & -0.130595 & -1.0116 & 0.842101 \tabularnewline
13 & -0.032024 & -0.2481 & 0.59753 \tabularnewline
14 & 0.010593 & 0.0821 & 0.467438 \tabularnewline
15 & -0.087941 & -0.6812 & 0.750812 \tabularnewline
16 & -0.031559 & -0.2445 & 0.596143 \tabularnewline
17 & 0.085833 & 0.6649 & 0.254344 \tabularnewline
18 & -0.028687 & -0.2222 & 0.587548 \tabularnewline
19 & -0.025293 & -0.1959 & 0.577331 \tabularnewline
20 & 0.007841 & 0.0607 & 0.475886 \tabularnewline
21 & -0.142057 & -1.1004 & 0.862217 \tabularnewline
22 & 0.047263 & 0.3661 & 0.357789 \tabularnewline
23 & 0.060643 & 0.4697 & 0.320123 \tabularnewline
24 & -0.040288 & -0.3121 & 0.621966 \tabularnewline
25 & -0.035708 & -0.2766 & 0.608477 \tabularnewline
26 & 0.051943 & 0.4023 & 0.344429 \tabularnewline
27 & -0.002264 & -0.0175 & 0.506967 \tabularnewline
28 & -0.127992 & -0.9914 & 0.83727 \tabularnewline
29 & -0.112167 & -0.8688 & 0.805803 \tabularnewline
30 & 0.02467 & 0.1911 & 0.424549 \tabularnewline
31 & -0.104078 & -0.8062 & 0.788341 \tabularnewline
32 & -0.040213 & -0.3115 & 0.621744 \tabularnewline
33 & 0.060567 & 0.4691 & 0.320332 \tabularnewline
34 & -0.074628 & -0.5781 & 0.71731 \tabularnewline
35 & -0.010696 & -0.0829 & 0.532878 \tabularnewline
36 & -0.072283 & -0.5599 & 0.711183 \tabularnewline
37 & 0.039979 & 0.3097 & 0.37894 \tabularnewline
38 & -0.02099 & -0.1626 & 0.564307 \tabularnewline
39 & -0.007556 & -0.0585 & 0.523238 \tabularnewline
40 & -0.023662 & -0.1833 & 0.572405 \tabularnewline
41 & -0.039744 & -0.3079 & 0.620371 \tabularnewline
42 & -0.004578 & -0.0355 & 0.514085 \tabularnewline
43 & -0.073655 & -0.5705 & 0.714775 \tabularnewline
44 & 0.065724 & 0.5091 & 0.306277 \tabularnewline
45 & 0.06348 & 0.4917 & 0.312357 \tabularnewline
46 & 0.022857 & 0.1771 & 0.430032 \tabularnewline
47 & 0.039025 & 0.3023 & 0.38174 \tabularnewline
\hline
\end{tabular}
%Source: https://freestatistics.org/blog/index.php?pk=6811&T=2

[TABLE]
[ROW][C]Partial Autocorrelation Function[/C][/ROW]
[ROW][C]Time lag k[/C][C]PACF(k)[/C][C]T-STAT[/C][C]P-value[/C][/ROW]
[ROW][C]0[/C][C]0.419586[/C][C]3.2501[/C][C]0.000947[/C][/ROW]
[ROW][C]1[/C][C]-0.317007[/C][C]-2.4555[/C][C]0.991509[/C][/ROW]
[ROW][C]2[/C][C]-0.018497[/C][C]-0.1433[/C][C]0.556723[/C][/ROW]
[ROW][C]3[/C][C]0.007193[/C][C]0.0557[/C][C]0.477875[/C][/ROW]
[ROW][C]4[/C][C]0.023171[/C][C]0.1795[/C][C]0.429081[/C][/ROW]
[ROW][C]5[/C][C]-0.177697[/C][C]-1.3764[/C][C]0.913098[/C][/ROW]
[ROW][C]6[/C][C]0.082153[/C][C]0.6364[/C][C]0.263484[/C][/ROW]
[ROW][C]7[/C][C]-0.169871[/C][C]-1.3158[/C][C]0.903379[/C][/ROW]
[ROW][C]8[/C][C]-0.078541[/C][C]-0.6084[/C][C]0.727383[/C][/ROW]
[ROW][C]9[/C][C]0.075668[/C][C]0.5861[/C][C]0.279995[/C][/ROW]
[ROW][C]10[/C][C]0.306115[/C][C]2.3712[/C][C]0.01048[/C][/ROW]
[ROW][C]11[/C][C]0.308325[/C][C]2.3883[/C][C]0.010046[/C][/ROW]
[ROW][C]12[/C][C]-0.130595[/C][C]-1.0116[/C][C]0.842101[/C][/ROW]
[ROW][C]13[/C][C]-0.032024[/C][C]-0.2481[/C][C]0.59753[/C][/ROW]
[ROW][C]14[/C][C]0.010593[/C][C]0.0821[/C][C]0.467438[/C][/ROW]
[ROW][C]15[/C][C]-0.087941[/C][C]-0.6812[/C][C]0.750812[/C][/ROW]
[ROW][C]16[/C][C]-0.031559[/C][C]-0.2445[/C][C]0.596143[/C][/ROW]
[ROW][C]17[/C][C]0.085833[/C][C]0.6649[/C][C]0.254344[/C][/ROW]
[ROW][C]18[/C][C]-0.028687[/C][C]-0.2222[/C][C]0.587548[/C][/ROW]
[ROW][C]19[/C][C]-0.025293[/C][C]-0.1959[/C][C]0.577331[/C][/ROW]
[ROW][C]20[/C][C]0.007841[/C][C]0.0607[/C][C]0.475886[/C][/ROW]
[ROW][C]21[/C][C]-0.142057[/C][C]-1.1004[/C][C]0.862217[/C][/ROW]
[ROW][C]22[/C][C]0.047263[/C][C]0.3661[/C][C]0.357789[/C][/ROW]
[ROW][C]23[/C][C]0.060643[/C][C]0.4697[/C][C]0.320123[/C][/ROW]
[ROW][C]24[/C][C]-0.040288[/C][C]-0.3121[/C][C]0.621966[/C][/ROW]
[ROW][C]25[/C][C]-0.035708[/C][C]-0.2766[/C][C]0.608477[/C][/ROW]
[ROW][C]26[/C][C]0.051943[/C][C]0.4023[/C][C]0.344429[/C][/ROW]
[ROW][C]27[/C][C]-0.002264[/C][C]-0.0175[/C][C]0.506967[/C][/ROW]
[ROW][C]28[/C][C]-0.127992[/C][C]-0.9914[/C][C]0.83727[/C][/ROW]
[ROW][C]29[/C][C]-0.112167[/C][C]-0.8688[/C][C]0.805803[/C][/ROW]
[ROW][C]30[/C][C]0.02467[/C][C]0.1911[/C][C]0.424549[/C][/ROW]
[ROW][C]31[/C][C]-0.104078[/C][C]-0.8062[/C][C]0.788341[/C][/ROW]
[ROW][C]32[/C][C]-0.040213[/C][C]-0.3115[/C][C]0.621744[/C][/ROW]
[ROW][C]33[/C][C]0.060567[/C][C]0.4691[/C][C]0.320332[/C][/ROW]
[ROW][C]34[/C][C]-0.074628[/C][C]-0.5781[/C][C]0.71731[/C][/ROW]
[ROW][C]35[/C][C]-0.010696[/C][C]-0.0829[/C][C]0.532878[/C][/ROW]
[ROW][C]36[/C][C]-0.072283[/C][C]-0.5599[/C][C]0.711183[/C][/ROW]
[ROW][C]37[/C][C]0.039979[/C][C]0.3097[/C][C]0.37894[/C][/ROW]
[ROW][C]38[/C][C]-0.02099[/C][C]-0.1626[/C][C]0.564307[/C][/ROW]
[ROW][C]39[/C][C]-0.007556[/C][C]-0.0585[/C][C]0.523238[/C][/ROW]
[ROW][C]40[/C][C]-0.023662[/C][C]-0.1833[/C][C]0.572405[/C][/ROW]
[ROW][C]41[/C][C]-0.039744[/C][C]-0.3079[/C][C]0.620371[/C][/ROW]
[ROW][C]42[/C][C]-0.004578[/C][C]-0.0355[/C][C]0.514085[/C][/ROW]
[ROW][C]43[/C][C]-0.073655[/C][C]-0.5705[/C][C]0.714775[/C][/ROW]
[ROW][C]44[/C][C]0.065724[/C][C]0.5091[/C][C]0.306277[/C][/ROW]
[ROW][C]45[/C][C]0.06348[/C][C]0.4917[/C][C]0.312357[/C][/ROW]
[ROW][C]46[/C][C]0.022857[/C][C]0.1771[/C][C]0.430032[/C][/ROW]
[ROW][C]47[/C][C]0.039025[/C][C]0.3023[/C][C]0.38174[/C][/ROW]
[/TABLE]
Source: https://freestatistics.org/blog/index.php?pk=6811&T=2

Globally Unique Identifier (entire table): ba.freestatistics.org/blog/index.php?pk=6811&T=2

As an alternative you can also use a QR Code:  

The GUIDs for individual cells are displayed in the table below:

Partial Autocorrelation Function
Time lag kPACF(k)T-STATP-value
00.4195863.25010.000947
1-0.317007-2.45550.991509
2-0.018497-0.14330.556723
30.0071930.05570.477875
40.0231710.17950.429081
5-0.177697-1.37640.913098
60.0821530.63640.263484
7-0.169871-1.31580.903379
8-0.078541-0.60840.727383
90.0756680.58610.279995
100.3061152.37120.01048
110.3083252.38830.010046
12-0.130595-1.01160.842101
13-0.032024-0.24810.59753
140.0105930.08210.467438
15-0.087941-0.68120.750812
16-0.031559-0.24450.596143
170.0858330.66490.254344
18-0.028687-0.22220.587548
19-0.025293-0.19590.577331
200.0078410.06070.475886
21-0.142057-1.10040.862217
220.0472630.36610.357789
230.0606430.46970.320123
24-0.040288-0.31210.621966
25-0.035708-0.27660.608477
260.0519430.40230.344429
27-0.002264-0.01750.506967
28-0.127992-0.99140.83727
29-0.112167-0.86880.805803
300.024670.19110.424549
31-0.104078-0.80620.788341
32-0.040213-0.31150.621744
330.0605670.46910.320332
34-0.074628-0.57810.71731
35-0.010696-0.08290.532878
36-0.072283-0.55990.711183
370.0399790.30970.37894
38-0.02099-0.16260.564307
39-0.007556-0.05850.523238
40-0.023662-0.18330.572405
41-0.039744-0.30790.620371
42-0.004578-0.03550.514085
43-0.073655-0.57050.714775
440.0657240.50910.306277
450.063480.49170.312357
460.0228570.17710.430032
470.0390250.30230.38174


Parameters (Session):
par1 = 48 ; par2 = 1 ; par3 = 0 ; par4 = 0 ; par5 = 12 ;
Parameters (R input):
par1 = 48 ; par2 = 1 ; par3 = 0 ; par4 = 0 ; par5 = 12 ;
R code (references can be found in the software module):
if (par1 == 'Default') {
par1 = 10*log10(length(x))
} else {
par1 <- as.numeric(par1)
}
par2 <- as.numeric(par2)
par3 <- as.numeric(par3)
par4 <- as.numeric(par4)
par5 <- as.numeric(par5)
if (par2 == 0) {
x <- log(x)
} else {
x <- (x ^ par2 - 1) / par2
}
if (par3 > 0) x <- diff(x,lag=1,difference=par3)
if (par4 > 0) x <- diff(x,lag=par5,difference=par4)
bitmap(file='pic1.png')
racf <- acf(x,par1,main='Autocorrelation',xlab='lags',ylab='ACF')
dev.off()
bitmap(file='pic2.png')
rpacf <- pacf(x,par1,main='Partial Autocorrelation',xlab='lags',ylab='PACF')
dev.off()
(myacf <- c(racf$acf))
(mypacf <- c(rpacf$acf))
lengthx <- length(x)
sqrtn <- sqrt(lengthx)
load(file='createtable')
a<-table.start()
a<-table.row.start(a)
a<-table.element(a,'Autocorrelation Function',4,TRUE)
a<-table.row.end(a)
a<-table.row.start(a)
a<-table.element(a,'Time lag k',header=TRUE)
a<-table.element(a,hyperlink('basics.htm','ACF(k)','click here for more information about the Autocorrelation Function'),header=TRUE)
a<-table.element(a,'T-STAT',header=TRUE)
a<-table.element(a,'P-value',header=TRUE)
a<-table.row.end(a)
for (i in 1:par1) {
a<-table.row.start(a)
a<-table.element(a,i-1,header=TRUE)
a<-table.element(a,round(myacf[i],6))
mytstat <- myacf[i]*sqrtn
a<-table.element(a,round(mytstat,4))
a<-table.element(a,round(1-pt(mytstat,lengthx),6))
a<-table.row.end(a)
}
a<-table.end(a)
table.save(a,file='mytable.tab')
a<-table.start()
a<-table.row.start(a)
a<-table.element(a,'Partial Autocorrelation Function',4,TRUE)
a<-table.row.end(a)
a<-table.row.start(a)
a<-table.element(a,'Time lag k',header=TRUE)
a<-table.element(a,hyperlink('basics.htm','PACF(k)','click here for more information about the Partial Autocorrelation Function'),header=TRUE)
a<-table.element(a,'T-STAT',header=TRUE)
a<-table.element(a,'P-value',header=TRUE)
a<-table.row.end(a)
for (i in 1:par1) {
a<-table.row.start(a)
a<-table.element(a,i-1,header=TRUE)
a<-table.element(a,round(mypacf[i],6))
mytstat <- mypacf[i]*sqrtn
a<-table.element(a,round(mytstat,4))
a<-table.element(a,round(1-pt(mytstat,lengthx),6))
a<-table.row.end(a)
}
a<-table.end(a)
table.save(a,file='mytable1.tab')