Free Statistics

of Irreproducible Research!

Author's title

Author*The author of this computation has been verified*
R Software Modulerwasp_centraltendency.wasp
Title produced by softwareCentral Tendency
Date of computationSat, 06 Dec 2008 07:27:03 -0700
Cite this page as followsStatistical Computations at FreeStatistics.org, Office for Research Development and Education, URL https://freestatistics.org/blog/index.php?v=date/2008/Dec/06/t1228573655zi066ytlve66o8j.htm/, Retrieved Thu, 31 Oct 2024 23:29:07 +0000
Statistical Computations at FreeStatistics.org, Office for Research Development and Education, URL https://freestatistics.org/blog/index.php?pk=29642, Retrieved Thu, 31 Oct 2024 23:29:07 +0000
QR Codes:

Original text written by user:
IsPrivate?No (this computation is public)
User-defined keywords
Estimated Impact194
Family? (F = Feedback message, R = changed R code, M = changed R Module, P = changed Parameters, D = changed Data)
-     [Histogram] [] [2008-12-06 14:20:54] [4c8dfb519edec2da3492d7e6be9a5685]
- RMP     [Central Tendency] [] [2008-12-06 14:27:03] [6d40a467de0f28bd2350f82ac9522c51] [Current]
- RM        [Variability] [] [2008-12-06 14:31:58] [4c8dfb519edec2da3492d7e6be9a5685]
- RMP         [Harrell-Davis Quantiles] [] [2008-12-06 14:34:30] [4c8dfb519edec2da3492d7e6be9a5685]
Feedback Forum

Post a new message
Dataseries X:
15107
15024
12083
15761
16943
15070
13660
14769
14725
15998
15371
14957
15470
15102
11704
16284
16727
14969
14861
14583
15306
17904
16379
15420
17871
15913
13867
17823
17872
17422
16705
15991
16584
19124
17839
17209
18587
16258
15142
19202
17747
19090
18040
17516
17752
21073
17170
19440
19795
17575
16165
19465
19932
19961
17343
18924
18574
21351
18595
19823
20844
19640
17735
19814
22239
20682
17819
21872
22117
21866


Summary of computational transaction
Raw Inputview raw input (R code)
Raw Outputview raw output of R engine
Computing time3 seconds
R Server'Sir Ronald Aylmer Fisher' @ 193.190.124.24

\begin{tabular}{lllllllll}
\hline
Summary of computational transaction \tabularnewline
Raw Input & view raw input (R code)  \tabularnewline
Raw Output & view raw output of R engine  \tabularnewline
Computing time & 3 seconds \tabularnewline
R Server & 'Sir Ronald Aylmer Fisher' @ 193.190.124.24 \tabularnewline
\hline
\end{tabular}
%Source: https://freestatistics.org/blog/index.php?pk=29642&T=0

[TABLE]
[ROW][C]Summary of computational transaction[/C][/ROW]
[ROW][C]Raw Input[/C][C]view raw input (R code) [/C][/ROW]
[ROW][C]Raw Output[/C][C]view raw output of R engine [/C][/ROW]
[ROW][C]Computing time[/C][C]3 seconds[/C][/ROW]
[ROW][C]R Server[/C][C]'Sir Ronald Aylmer Fisher' @ 193.190.124.24[/C][/ROW]
[/TABLE]
Source: https://freestatistics.org/blog/index.php?pk=29642&T=0

Globally Unique Identifier (entire table): ba.freestatistics.org/blog/index.php?pk=29642&T=0

As an alternative you can also use a QR Code:  

The GUIDs for individual cells are displayed in the table below:

Summary of computational transaction
Raw Inputview raw input (R code)
Raw Outputview raw output of R engine
Computing time3 seconds
R Server'Sir Ronald Aylmer Fisher' @ 193.190.124.24


Central Tendency - Ungrouped Data
MeasureValueS.E.Value/S.E.
Arithmetic Mean17393.5282.36952262680361.5983617431274
Geometric Mean17233.2180062236
Harmonic Mean17070.2782054226
Quadratic Mean17550.936955453
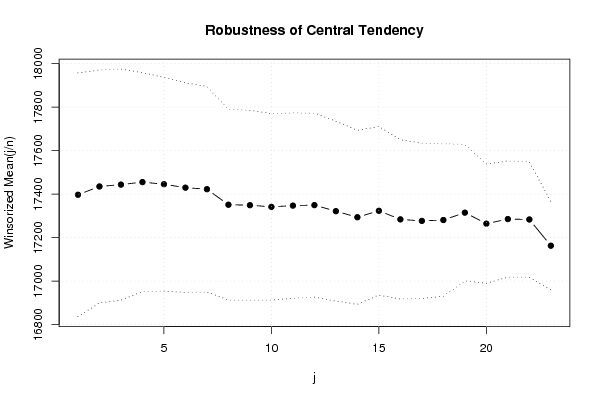
Winsorized Mean ( 1 / 23 )17397.1714285714280.40596196913862.0428014668467
Winsorized Mean ( 2 / 23 )17435.2285714286267.8864984548965.0843871266044
Winsorized Mean ( 3 / 23 )17443.8428571429266.05430852976765.5649703759306
Winsorized Mean ( 4 / 23 )17455.3285714286251.81983168114669.3167351232705
Winsorized Mean ( 5 / 23 )17445.6142857143245.81711905782170.9698915705327
Winsorized Mean ( 6 / 23 )17429.7571428571241.09909256807472.2929188874316
Winsorized Mean ( 7 / 23 )17422.7571428571236.35908870606373.713083081498
Winsorized Mean ( 8 / 23 )17351.3285714286219.24619939899179.1408408400827
Winsorized Mean ( 9 / 23 )17349.1428571429218.36104856479479.4516374196419
Winsorized Mean ( 10 / 23 )17341.4285714286214.48478551632280.8515556461644
Winsorized Mean ( 11 / 23 )17347.2428571429213.12191656217981.3958655072518
Winsorized Mean ( 12 / 23 )17349.4714285714211.72939849469981.9417216122012
Winsorized Mean ( 13 / 23 )17321.6142857143206.83776090094583.744932309578
Winsorized Mean ( 14 / 23 )17293.6142857143200.1536617702186.4016882467457
Winsorized Mean ( 15 / 23 )17323.4193.92065718650089.3324117777692
Winsorized Mean ( 16 / 23 )17283.8571428571183.24284454488394.3221394853628
Winsorized Mean ( 17 / 23 )17276.8142857143178.58918504678896.7405404822694
Winsorized Mean ( 18 / 23 )17280.9285714286175.34933523413098.5514347593891
Winsorized Mean ( 19 / 23 )17314.8571428571157.046328153928110.253180360168
Winsorized Mean ( 20 / 23 )17264.2857142857137.222559008991125.81229966098
Winsorized Mean ( 21 / 23 )17285.2857142857133.571232603570129.408746010357
Winsorized Mean ( 22 / 23 )17283.4132.685809245583130.258089378728
Winsorized Mean ( 23 / 23 )17162.8142857143101.377786560017169.295610686407
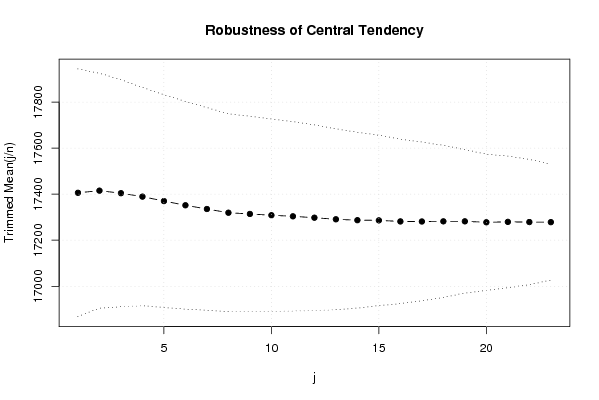
Trimmed Mean ( 1 / 23 )17405.9117647059268.82522018187964.7480610373147
Trimmed Mean ( 2 / 23 )17415.1818181818254.88926880423568.3244998892337
Trimmed Mean ( 3 / 23 )17404.21875246.37386244004570.6414981590644
Trimmed Mean ( 4 / 23 )17389.3064516129236.93214123419473.393615408323
Trimmed Mean ( 5 / 23 )17370.05230.88928232399775.2310796983004
Trimmed Mean ( 6 / 23 )17351.8103448276225.41853451502576.975969975845
Trimmed Mean ( 7 / 23 )17335.5714285714220.02687093446078.7884286812187
Trimmed Mean ( 8 / 23 )17319.4259259259214.57403662155880.7153847623793
Trimmed Mean ( 9 / 23 )17314.0576923077212.01804971232381.6631306428876
Trimmed Mean ( 10 / 23 )17308.6208.84265925938382.8786611958561
Trimmed Mean ( 11 / 23 )17303.8125205.54661741147684.1843700368961
Trimmed Mean ( 12 / 23 )17297.8043478261201.47050375585585.857751012465
Trimmed Mean ( 13 / 23 )17290.9545454545196.3763240018688.0500978584911
Trimmed Mean ( 14 / 23 )17287.0238095238190.77768129305190.6134496045657
Trimmed Mean ( 15 / 23 )17286.2184.89323045116293.4928767149534
Trimmed Mean ( 16 / 23 )17281.6315789474178.44067520507396.8480508106485
Trimmed Mean ( 17 / 23 )17281.3611111111172.355806551529100.265615977054
Trimmed Mean ( 18 / 23 )17281.9117647059165.064203830449104.698119662925
Trimmed Mean ( 19 / 23 )17282.03125155.601133254584111.066229972273
Trimmed Mean ( 20 / 23 )17278147.811366274722116.892228489974
Trimmed Mean ( 21 / 23 )17279.7142857143142.771776081099121.030323779812
Trimmed Mean ( 22 / 23 )17279136.101455370052126.956761432267
Trimmed Mean ( 23 / 23 )17278.4166666667125.703454183725137.453793763002
Median17469
Midrange16971.5
Midmean - Weighted Average at Xnp17228.7142857143
Midmean - Weighted Average at X(n+1)p17281.3611111111
Midmean - Empirical Distribution Function17281.3611111111
Midmean - Empirical Distribution Function - Averaging17281.3611111111
Midmean - Empirical Distribution Function - Interpolation17281.9117647059
Midmean - Closest Observation17281.3611111111
Midmean - True Basic - Statistics Graphics Toolkit17281.3611111111
Midmean - MS Excel (old versions)17281.3611111111
Number of observations70

\begin{tabular}{lllllllll}
\hline
Central Tendency - Ungrouped Data \tabularnewline
Measure & Value & S.E. & Value/S.E. \tabularnewline
Arithmetic Mean & 17393.5 & 282.369522626803 & 61.5983617431274 \tabularnewline
Geometric Mean & 17233.2180062236 &  &  \tabularnewline
Harmonic Mean & 17070.2782054226 &  &  \tabularnewline
Quadratic Mean & 17550.936955453 &  &  \tabularnewline
Winsorized Mean ( 1 / 23 ) & 17397.1714285714 & 280.405961969138 & 62.0428014668467 \tabularnewline
Winsorized Mean ( 2 / 23 ) & 17435.2285714286 & 267.88649845489 & 65.0843871266044 \tabularnewline
Winsorized Mean ( 3 / 23 ) & 17443.8428571429 & 266.054308529767 & 65.5649703759306 \tabularnewline
Winsorized Mean ( 4 / 23 ) & 17455.3285714286 & 251.819831681146 & 69.3167351232705 \tabularnewline
Winsorized Mean ( 5 / 23 ) & 17445.6142857143 & 245.817119057821 & 70.9698915705327 \tabularnewline
Winsorized Mean ( 6 / 23 ) & 17429.7571428571 & 241.099092568074 & 72.2929188874316 \tabularnewline
Winsorized Mean ( 7 / 23 ) & 17422.7571428571 & 236.359088706063 & 73.713083081498 \tabularnewline
Winsorized Mean ( 8 / 23 ) & 17351.3285714286 & 219.246199398991 & 79.1408408400827 \tabularnewline
Winsorized Mean ( 9 / 23 ) & 17349.1428571429 & 218.361048564794 & 79.4516374196419 \tabularnewline
Winsorized Mean ( 10 / 23 ) & 17341.4285714286 & 214.484785516322 & 80.8515556461644 \tabularnewline
Winsorized Mean ( 11 / 23 ) & 17347.2428571429 & 213.121916562179 & 81.3958655072518 \tabularnewline
Winsorized Mean ( 12 / 23 ) & 17349.4714285714 & 211.729398494699 & 81.9417216122012 \tabularnewline
Winsorized Mean ( 13 / 23 ) & 17321.6142857143 & 206.837760900945 & 83.744932309578 \tabularnewline
Winsorized Mean ( 14 / 23 ) & 17293.6142857143 & 200.15366177021 & 86.4016882467457 \tabularnewline
Winsorized Mean ( 15 / 23 ) & 17323.4 & 193.920657186500 & 89.3324117777692 \tabularnewline
Winsorized Mean ( 16 / 23 ) & 17283.8571428571 & 183.242844544883 & 94.3221394853628 \tabularnewline
Winsorized Mean ( 17 / 23 ) & 17276.8142857143 & 178.589185046788 & 96.7405404822694 \tabularnewline
Winsorized Mean ( 18 / 23 ) & 17280.9285714286 & 175.349335234130 & 98.5514347593891 \tabularnewline
Winsorized Mean ( 19 / 23 ) & 17314.8571428571 & 157.046328153928 & 110.253180360168 \tabularnewline
Winsorized Mean ( 20 / 23 ) & 17264.2857142857 & 137.222559008991 & 125.81229966098 \tabularnewline
Winsorized Mean ( 21 / 23 ) & 17285.2857142857 & 133.571232603570 & 129.408746010357 \tabularnewline
Winsorized Mean ( 22 / 23 ) & 17283.4 & 132.685809245583 & 130.258089378728 \tabularnewline
Winsorized Mean ( 23 / 23 ) & 17162.8142857143 & 101.377786560017 & 169.295610686407 \tabularnewline
Trimmed Mean ( 1 / 23 ) & 17405.9117647059 & 268.825220181879 & 64.7480610373147 \tabularnewline
Trimmed Mean ( 2 / 23 ) & 17415.1818181818 & 254.889268804235 & 68.3244998892337 \tabularnewline
Trimmed Mean ( 3 / 23 ) & 17404.21875 & 246.373862440045 & 70.6414981590644 \tabularnewline
Trimmed Mean ( 4 / 23 ) & 17389.3064516129 & 236.932141234194 & 73.393615408323 \tabularnewline
Trimmed Mean ( 5 / 23 ) & 17370.05 & 230.889282323997 & 75.2310796983004 \tabularnewline
Trimmed Mean ( 6 / 23 ) & 17351.8103448276 & 225.418534515025 & 76.975969975845 \tabularnewline
Trimmed Mean ( 7 / 23 ) & 17335.5714285714 & 220.026870934460 & 78.7884286812187 \tabularnewline
Trimmed Mean ( 8 / 23 ) & 17319.4259259259 & 214.574036621558 & 80.7153847623793 \tabularnewline
Trimmed Mean ( 9 / 23 ) & 17314.0576923077 & 212.018049712323 & 81.6631306428876 \tabularnewline
Trimmed Mean ( 10 / 23 ) & 17308.6 & 208.842659259383 & 82.8786611958561 \tabularnewline
Trimmed Mean ( 11 / 23 ) & 17303.8125 & 205.546617411476 & 84.1843700368961 \tabularnewline
Trimmed Mean ( 12 / 23 ) & 17297.8043478261 & 201.470503755855 & 85.857751012465 \tabularnewline
Trimmed Mean ( 13 / 23 ) & 17290.9545454545 & 196.37632400186 & 88.0500978584911 \tabularnewline
Trimmed Mean ( 14 / 23 ) & 17287.0238095238 & 190.777681293051 & 90.6134496045657 \tabularnewline
Trimmed Mean ( 15 / 23 ) & 17286.2 & 184.893230451162 & 93.4928767149534 \tabularnewline
Trimmed Mean ( 16 / 23 ) & 17281.6315789474 & 178.440675205073 & 96.8480508106485 \tabularnewline
Trimmed Mean ( 17 / 23 ) & 17281.3611111111 & 172.355806551529 & 100.265615977054 \tabularnewline
Trimmed Mean ( 18 / 23 ) & 17281.9117647059 & 165.064203830449 & 104.698119662925 \tabularnewline
Trimmed Mean ( 19 / 23 ) & 17282.03125 & 155.601133254584 & 111.066229972273 \tabularnewline
Trimmed Mean ( 20 / 23 ) & 17278 & 147.811366274722 & 116.892228489974 \tabularnewline
Trimmed Mean ( 21 / 23 ) & 17279.7142857143 & 142.771776081099 & 121.030323779812 \tabularnewline
Trimmed Mean ( 22 / 23 ) & 17279 & 136.101455370052 & 126.956761432267 \tabularnewline
Trimmed Mean ( 23 / 23 ) & 17278.4166666667 & 125.703454183725 & 137.453793763002 \tabularnewline
Median & 17469 &  &  \tabularnewline
Midrange & 16971.5 &  &  \tabularnewline
Midmean - Weighted Average at Xnp & 17228.7142857143 &  &  \tabularnewline
Midmean - Weighted Average at X(n+1)p & 17281.3611111111 &  &  \tabularnewline
Midmean - Empirical Distribution Function & 17281.3611111111 &  &  \tabularnewline
Midmean - Empirical Distribution Function - Averaging & 17281.3611111111 &  &  \tabularnewline
Midmean - Empirical Distribution Function - Interpolation & 17281.9117647059 &  &  \tabularnewline
Midmean - Closest Observation & 17281.3611111111 &  &  \tabularnewline
Midmean - True Basic - Statistics Graphics Toolkit & 17281.3611111111 &  &  \tabularnewline
Midmean - MS Excel (old versions) & 17281.3611111111 &  &  \tabularnewline
Number of observations & 70 &  &  \tabularnewline
\hline
\end{tabular}
%Source: https://freestatistics.org/blog/index.php?pk=29642&T=1

[TABLE]
[ROW][C]Central Tendency - Ungrouped Data[/C][/ROW]
[ROW][C]Measure[/C][C]Value[/C][C]S.E.[/C][C]Value/S.E.[/C][/ROW]
[ROW][C]Arithmetic Mean[/C][C]17393.5[/C][C]282.369522626803[/C][C]61.5983617431274[/C][/ROW]
[ROW][C]Geometric Mean[/C][C]17233.2180062236[/C][C][/C][C][/C][/ROW]
[ROW][C]Harmonic Mean[/C][C]17070.2782054226[/C][C][/C][C][/C][/ROW]
[ROW][C]Quadratic Mean[/C][C]17550.936955453[/C][C][/C][C][/C][/ROW]
[ROW][C]Winsorized Mean ( 1 / 23 )[/C][C]17397.1714285714[/C][C]280.405961969138[/C][C]62.0428014668467[/C][/ROW]
[ROW][C]Winsorized Mean ( 2 / 23 )[/C][C]17435.2285714286[/C][C]267.88649845489[/C][C]65.0843871266044[/C][/ROW]
[ROW][C]Winsorized Mean ( 3 / 23 )[/C][C]17443.8428571429[/C][C]266.054308529767[/C][C]65.5649703759306[/C][/ROW]
[ROW][C]Winsorized Mean ( 4 / 23 )[/C][C]17455.3285714286[/C][C]251.819831681146[/C][C]69.3167351232705[/C][/ROW]
[ROW][C]Winsorized Mean ( 5 / 23 )[/C][C]17445.6142857143[/C][C]245.817119057821[/C][C]70.9698915705327[/C][/ROW]
[ROW][C]Winsorized Mean ( 6 / 23 )[/C][C]17429.7571428571[/C][C]241.099092568074[/C][C]72.2929188874316[/C][/ROW]
[ROW][C]Winsorized Mean ( 7 / 23 )[/C][C]17422.7571428571[/C][C]236.359088706063[/C][C]73.713083081498[/C][/ROW]
[ROW][C]Winsorized Mean ( 8 / 23 )[/C][C]17351.3285714286[/C][C]219.246199398991[/C][C]79.1408408400827[/C][/ROW]
[ROW][C]Winsorized Mean ( 9 / 23 )[/C][C]17349.1428571429[/C][C]218.361048564794[/C][C]79.4516374196419[/C][/ROW]
[ROW][C]Winsorized Mean ( 10 / 23 )[/C][C]17341.4285714286[/C][C]214.484785516322[/C][C]80.8515556461644[/C][/ROW]
[ROW][C]Winsorized Mean ( 11 / 23 )[/C][C]17347.2428571429[/C][C]213.121916562179[/C][C]81.3958655072518[/C][/ROW]
[ROW][C]Winsorized Mean ( 12 / 23 )[/C][C]17349.4714285714[/C][C]211.729398494699[/C][C]81.9417216122012[/C][/ROW]
[ROW][C]Winsorized Mean ( 13 / 23 )[/C][C]17321.6142857143[/C][C]206.837760900945[/C][C]83.744932309578[/C][/ROW]
[ROW][C]Winsorized Mean ( 14 / 23 )[/C][C]17293.6142857143[/C][C]200.15366177021[/C][C]86.4016882467457[/C][/ROW]
[ROW][C]Winsorized Mean ( 15 / 23 )[/C][C]17323.4[/C][C]193.920657186500[/C][C]89.3324117777692[/C][/ROW]
[ROW][C]Winsorized Mean ( 16 / 23 )[/C][C]17283.8571428571[/C][C]183.242844544883[/C][C]94.3221394853628[/C][/ROW]
[ROW][C]Winsorized Mean ( 17 / 23 )[/C][C]17276.8142857143[/C][C]178.589185046788[/C][C]96.7405404822694[/C][/ROW]
[ROW][C]Winsorized Mean ( 18 / 23 )[/C][C]17280.9285714286[/C][C]175.349335234130[/C][C]98.5514347593891[/C][/ROW]
[ROW][C]Winsorized Mean ( 19 / 23 )[/C][C]17314.8571428571[/C][C]157.046328153928[/C][C]110.253180360168[/C][/ROW]
[ROW][C]Winsorized Mean ( 20 / 23 )[/C][C]17264.2857142857[/C][C]137.222559008991[/C][C]125.81229966098[/C][/ROW]
[ROW][C]Winsorized Mean ( 21 / 23 )[/C][C]17285.2857142857[/C][C]133.571232603570[/C][C]129.408746010357[/C][/ROW]
[ROW][C]Winsorized Mean ( 22 / 23 )[/C][C]17283.4[/C][C]132.685809245583[/C][C]130.258089378728[/C][/ROW]
[ROW][C]Winsorized Mean ( 23 / 23 )[/C][C]17162.8142857143[/C][C]101.377786560017[/C][C]169.295610686407[/C][/ROW]
[ROW][C]Trimmed Mean ( 1 / 23 )[/C][C]17405.9117647059[/C][C]268.825220181879[/C][C]64.7480610373147[/C][/ROW]
[ROW][C]Trimmed Mean ( 2 / 23 )[/C][C]17415.1818181818[/C][C]254.889268804235[/C][C]68.3244998892337[/C][/ROW]
[ROW][C]Trimmed Mean ( 3 / 23 )[/C][C]17404.21875[/C][C]246.373862440045[/C][C]70.6414981590644[/C][/ROW]
[ROW][C]Trimmed Mean ( 4 / 23 )[/C][C]17389.3064516129[/C][C]236.932141234194[/C][C]73.393615408323[/C][/ROW]
[ROW][C]Trimmed Mean ( 5 / 23 )[/C][C]17370.05[/C][C]230.889282323997[/C][C]75.2310796983004[/C][/ROW]
[ROW][C]Trimmed Mean ( 6 / 23 )[/C][C]17351.8103448276[/C][C]225.418534515025[/C][C]76.975969975845[/C][/ROW]
[ROW][C]Trimmed Mean ( 7 / 23 )[/C][C]17335.5714285714[/C][C]220.026870934460[/C][C]78.7884286812187[/C][/ROW]
[ROW][C]Trimmed Mean ( 8 / 23 )[/C][C]17319.4259259259[/C][C]214.574036621558[/C][C]80.7153847623793[/C][/ROW]
[ROW][C]Trimmed Mean ( 9 / 23 )[/C][C]17314.0576923077[/C][C]212.018049712323[/C][C]81.6631306428876[/C][/ROW]
[ROW][C]Trimmed Mean ( 10 / 23 )[/C][C]17308.6[/C][C]208.842659259383[/C][C]82.8786611958561[/C][/ROW]
[ROW][C]Trimmed Mean ( 11 / 23 )[/C][C]17303.8125[/C][C]205.546617411476[/C][C]84.1843700368961[/C][/ROW]
[ROW][C]Trimmed Mean ( 12 / 23 )[/C][C]17297.8043478261[/C][C]201.470503755855[/C][C]85.857751012465[/C][/ROW]
[ROW][C]Trimmed Mean ( 13 / 23 )[/C][C]17290.9545454545[/C][C]196.37632400186[/C][C]88.0500978584911[/C][/ROW]
[ROW][C]Trimmed Mean ( 14 / 23 )[/C][C]17287.0238095238[/C][C]190.777681293051[/C][C]90.6134496045657[/C][/ROW]
[ROW][C]Trimmed Mean ( 15 / 23 )[/C][C]17286.2[/C][C]184.893230451162[/C][C]93.4928767149534[/C][/ROW]
[ROW][C]Trimmed Mean ( 16 / 23 )[/C][C]17281.6315789474[/C][C]178.440675205073[/C][C]96.8480508106485[/C][/ROW]
[ROW][C]Trimmed Mean ( 17 / 23 )[/C][C]17281.3611111111[/C][C]172.355806551529[/C][C]100.265615977054[/C][/ROW]
[ROW][C]Trimmed Mean ( 18 / 23 )[/C][C]17281.9117647059[/C][C]165.064203830449[/C][C]104.698119662925[/C][/ROW]
[ROW][C]Trimmed Mean ( 19 / 23 )[/C][C]17282.03125[/C][C]155.601133254584[/C][C]111.066229972273[/C][/ROW]
[ROW][C]Trimmed Mean ( 20 / 23 )[/C][C]17278[/C][C]147.811366274722[/C][C]116.892228489974[/C][/ROW]
[ROW][C]Trimmed Mean ( 21 / 23 )[/C][C]17279.7142857143[/C][C]142.771776081099[/C][C]121.030323779812[/C][/ROW]
[ROW][C]Trimmed Mean ( 22 / 23 )[/C][C]17279[/C][C]136.101455370052[/C][C]126.956761432267[/C][/ROW]
[ROW][C]Trimmed Mean ( 23 / 23 )[/C][C]17278.4166666667[/C][C]125.703454183725[/C][C]137.453793763002[/C][/ROW]
[ROW][C]Median[/C][C]17469[/C][C][/C][C][/C][/ROW]
[ROW][C]Midrange[/C][C]16971.5[/C][C][/C][C][/C][/ROW]
[ROW][C]Midmean - Weighted Average at Xnp[/C][C]17228.7142857143[/C][C][/C][C][/C][/ROW]
[ROW][C]Midmean - Weighted Average at X(n+1)p[/C][C]17281.3611111111[/C][C][/C][C][/C][/ROW]
[ROW][C]Midmean - Empirical Distribution Function[/C][C]17281.3611111111[/C][C][/C][C][/C][/ROW]
[ROW][C]Midmean - Empirical Distribution Function - Averaging[/C][C]17281.3611111111[/C][C][/C][C][/C][/ROW]
[ROW][C]Midmean - Empirical Distribution Function - Interpolation[/C][C]17281.9117647059[/C][C][/C][C][/C][/ROW]
[ROW][C]Midmean - Closest Observation[/C][C]17281.3611111111[/C][C][/C][C][/C][/ROW]
[ROW][C]Midmean - True Basic - Statistics Graphics Toolkit[/C][C]17281.3611111111[/C][C][/C][C][/C][/ROW]
[ROW][C]Midmean - MS Excel (old versions)[/C][C]17281.3611111111[/C][C][/C][C][/C][/ROW]
[ROW][C]Number of observations[/C][C]70[/C][C][/C][C][/C][/ROW]
[/TABLE]
Source: https://freestatistics.org/blog/index.php?pk=29642&T=1

Globally Unique Identifier (entire table): ba.freestatistics.org/blog/index.php?pk=29642&T=1

As an alternative you can also use a QR Code:  

The GUIDs for individual cells are displayed in the table below:

Central Tendency - Ungrouped Data
MeasureValueS.E.Value/S.E.
Arithmetic Mean17393.5282.36952262680361.5983617431274
Geometric Mean17233.2180062236
Harmonic Mean17070.2782054226
Quadratic Mean17550.936955453
Winsorized Mean ( 1 / 23 )17397.1714285714280.40596196913862.0428014668467
Winsorized Mean ( 2 / 23 )17435.2285714286267.8864984548965.0843871266044
Winsorized Mean ( 3 / 23 )17443.8428571429266.05430852976765.5649703759306
Winsorized Mean ( 4 / 23 )17455.3285714286251.81983168114669.3167351232705
Winsorized Mean ( 5 / 23 )17445.6142857143245.81711905782170.9698915705327
Winsorized Mean ( 6 / 23 )17429.7571428571241.09909256807472.2929188874316
Winsorized Mean ( 7 / 23 )17422.7571428571236.35908870606373.713083081498
Winsorized Mean ( 8 / 23 )17351.3285714286219.24619939899179.1408408400827
Winsorized Mean ( 9 / 23 )17349.1428571429218.36104856479479.4516374196419
Winsorized Mean ( 10 / 23 )17341.4285714286214.48478551632280.8515556461644
Winsorized Mean ( 11 / 23 )17347.2428571429213.12191656217981.3958655072518
Winsorized Mean ( 12 / 23 )17349.4714285714211.72939849469981.9417216122012
Winsorized Mean ( 13 / 23 )17321.6142857143206.83776090094583.744932309578
Winsorized Mean ( 14 / 23 )17293.6142857143200.1536617702186.4016882467457
Winsorized Mean ( 15 / 23 )17323.4193.92065718650089.3324117777692
Winsorized Mean ( 16 / 23 )17283.8571428571183.24284454488394.3221394853628
Winsorized Mean ( 17 / 23 )17276.8142857143178.58918504678896.7405404822694
Winsorized Mean ( 18 / 23 )17280.9285714286175.34933523413098.5514347593891
Winsorized Mean ( 19 / 23 )17314.8571428571157.046328153928110.253180360168
Winsorized Mean ( 20 / 23 )17264.2857142857137.222559008991125.81229966098
Winsorized Mean ( 21 / 23 )17285.2857142857133.571232603570129.408746010357
Winsorized Mean ( 22 / 23 )17283.4132.685809245583130.258089378728
Winsorized Mean ( 23 / 23 )17162.8142857143101.377786560017169.295610686407
Trimmed Mean ( 1 / 23 )17405.9117647059268.82522018187964.7480610373147
Trimmed Mean ( 2 / 23 )17415.1818181818254.88926880423568.3244998892337
Trimmed Mean ( 3 / 23 )17404.21875246.37386244004570.6414981590644
Trimmed Mean ( 4 / 23 )17389.3064516129236.93214123419473.393615408323
Trimmed Mean ( 5 / 23 )17370.05230.88928232399775.2310796983004
Trimmed Mean ( 6 / 23 )17351.8103448276225.41853451502576.975969975845
Trimmed Mean ( 7 / 23 )17335.5714285714220.02687093446078.7884286812187
Trimmed Mean ( 8 / 23 )17319.4259259259214.57403662155880.7153847623793
Trimmed Mean ( 9 / 23 )17314.0576923077212.01804971232381.6631306428876
Trimmed Mean ( 10 / 23 )17308.6208.84265925938382.8786611958561
Trimmed Mean ( 11 / 23 )17303.8125205.54661741147684.1843700368961
Trimmed Mean ( 12 / 23 )17297.8043478261201.47050375585585.857751012465
Trimmed Mean ( 13 / 23 )17290.9545454545196.3763240018688.0500978584911
Trimmed Mean ( 14 / 23 )17287.0238095238190.77768129305190.6134496045657
Trimmed Mean ( 15 / 23 )17286.2184.89323045116293.4928767149534
Trimmed Mean ( 16 / 23 )17281.6315789474178.44067520507396.8480508106485
Trimmed Mean ( 17 / 23 )17281.3611111111172.355806551529100.265615977054
Trimmed Mean ( 18 / 23 )17281.9117647059165.064203830449104.698119662925
Trimmed Mean ( 19 / 23 )17282.03125155.601133254584111.066229972273
Trimmed Mean ( 20 / 23 )17278147.811366274722116.892228489974
Trimmed Mean ( 21 / 23 )17279.7142857143142.771776081099121.030323779812
Trimmed Mean ( 22 / 23 )17279136.101455370052126.956761432267
Trimmed Mean ( 23 / 23 )17278.4166666667125.703454183725137.453793763002
Median17469
Midrange16971.5
Midmean - Weighted Average at Xnp17228.7142857143
Midmean - Weighted Average at X(n+1)p17281.3611111111
Midmean - Empirical Distribution Function17281.3611111111
Midmean - Empirical Distribution Function - Averaging17281.3611111111
Midmean - Empirical Distribution Function - Interpolation17281.9117647059
Midmean - Closest Observation17281.3611111111
Midmean - True Basic - Statistics Graphics Toolkit17281.3611111111
Midmean - MS Excel (old versions)17281.3611111111
Number of observations70


Parameters (Session):
Parameters (R input):
R code (references can be found in the software module):
geomean <- function(x) {
return(exp(mean(log(x))))
}
harmean <- function(x) {
return(1/mean(1/x))
}
quamean <- function(x) {
return(sqrt(mean(x*x)))
}
winmean <- function(x) {
x <-sort(x[!is.na(x)])
n<-length(x)
denom <- 3
nodenom <- n/denom
if (nodenom>40) denom <- n/40
sqrtn = sqrt(n)
roundnodenom = floor(nodenom)
win <- array(NA,dim=c(roundnodenom,2))
for (j in 1:roundnodenom) {
win[j,1] <- (j*x[j+1]+sum(x[(j+1):(n-j)])+j*x[n-j])/n
win[j,2] <- sd(c(rep(x[j+1],j),x[(j+1):(n-j)],rep(x[n-j],j)))/sqrtn
}
return(win)
}
trimean <- function(x) {
x <-sort(x[!is.na(x)])
n<-length(x)
denom <- 3
nodenom <- n/denom
if (nodenom>40) denom <- n/40
sqrtn = sqrt(n)
roundnodenom = floor(nodenom)
tri <- array(NA,dim=c(roundnodenom,2))
for (j in 1:roundnodenom) {
tri[j,1] <- mean(x,trim=j/n)
tri[j,2] <- sd(x[(j+1):(n-j)]) / sqrt(n-j*2)
}
return(tri)
}
midrange <- function(x) {
return((max(x)+min(x))/2)
}
q1 <- function(data,n,p,i,f) {
np <- n*p;
i <<- floor(np)
f <<- np - i
qvalue <- (1-f)*data[i] + f*data[i+1]
}
q2 <- function(data,n,p,i,f) {
np <- (n+1)*p
i <<- floor(np)
f <<- np - i
qvalue <- (1-f)*data[i] + f*data[i+1]
}
q3 <- function(data,n,p,i,f) {
np <- n*p
i <<- floor(np)
f <<- np - i
if (f==0) {
qvalue <- data[i]
} else {
qvalue <- data[i+1]
}
}
q4 <- function(data,n,p,i,f) {
np <- n*p
i <<- floor(np)
f <<- np - i
if (f==0) {
qvalue <- (data[i]+data[i+1])/2
} else {
qvalue <- data[i+1]
}
}
q5 <- function(data,n,p,i,f) {
np <- (n-1)*p
i <<- floor(np)
f <<- np - i
if (f==0) {
qvalue <- data[i+1]
} else {
qvalue <- data[i+1] + f*(data[i+2]-data[i+1])
}
}
q6 <- function(data,n,p,i,f) {
np <- n*p+0.5
i <<- floor(np)
f <<- np - i
qvalue <- data[i]
}
q7 <- function(data,n,p,i,f) {
np <- (n+1)*p
i <<- floor(np)
f <<- np - i
if (f==0) {
qvalue <- data[i]
} else {
qvalue <- f*data[i] + (1-f)*data[i+1]
}
}
q8 <- function(data,n,p,i,f) {
np <- (n+1)*p
i <<- floor(np)
f <<- np - i
if (f==0) {
qvalue <- data[i]
} else {
if (f == 0.5) {
qvalue <- (data[i]+data[i+1])/2
} else {
if (f < 0.5) {
qvalue <- data[i]
} else {
qvalue <- data[i+1]
}
}
}
}
midmean <- function(x,def) {
x <-sort(x[!is.na(x)])
n<-length(x)
if (def==1) {
qvalue1 <- q1(x,n,0.25,i,f)
qvalue3 <- q1(x,n,0.75,i,f)
}
if (def==2) {
qvalue1 <- q2(x,n,0.25,i,f)
qvalue3 <- q2(x,n,0.75,i,f)
}
if (def==3) {
qvalue1 <- q3(x,n,0.25,i,f)
qvalue3 <- q3(x,n,0.75,i,f)
}
if (def==4) {
qvalue1 <- q4(x,n,0.25,i,f)
qvalue3 <- q4(x,n,0.75,i,f)
}
if (def==5) {
qvalue1 <- q5(x,n,0.25,i,f)
qvalue3 <- q5(x,n,0.75,i,f)
}
if (def==6) {
qvalue1 <- q6(x,n,0.25,i,f)
qvalue3 <- q6(x,n,0.75,i,f)
}
if (def==7) {
qvalue1 <- q7(x,n,0.25,i,f)
qvalue3 <- q7(x,n,0.75,i,f)
}
if (def==8) {
qvalue1 <- q8(x,n,0.25,i,f)
qvalue3 <- q8(x,n,0.75,i,f)
}
midm <- 0
myn <- 0
roundno4 <- round(n/4)
round3no4 <- round(3*n/4)
for (i in 1:n) {
if ((x[i]>=qvalue1) & (x[i]<=qvalue3)){
midm = midm + x[i]
myn = myn + 1
}
}
midm = midm / myn
return(midm)
}
(arm <- mean(x))
sqrtn <- sqrt(length(x))
(armse <- sd(x) / sqrtn)
(armose <- arm / armse)
(geo <- geomean(x))
(har <- harmean(x))
(qua <- quamean(x))
(win <- winmean(x))
(tri <- trimean(x))
(midr <- midrange(x))
midm <- array(NA,dim=8)
for (j in 1:8) midm[j] <- midmean(x,j)
midm
bitmap(file='test1.png')
lb <- win[,1] - 2*win[,2]
ub <- win[,1] + 2*win[,2]
if ((ylimmin == '') | (ylimmax == '')) plot(win[,1],type='b',main=main, xlab='j', pch=19, ylab='Winsorized Mean(j/n)', ylim=c(min(lb),max(ub))) else plot(win[,1],type='l',main=main, xlab='j', pch=19, ylab='Winsorized Mean(j/n)', ylim=c(ylimmin,ylimmax))
lines(ub,lty=3)
lines(lb,lty=3)
grid()
dev.off()
bitmap(file='test2.png')
lb <- tri[,1] - 2*tri[,2]
ub <- tri[,1] + 2*tri[,2]
if ((ylimmin == '') | (ylimmax == '')) plot(tri[,1],type='b',main=main, xlab='j', pch=19, ylab='Trimmed Mean(j/n)', ylim=c(min(lb),max(ub))) else plot(tri[,1],type='l',main=main, xlab='j', pch=19, ylab='Trimmed Mean(j/n)', ylim=c(ylimmin,ylimmax))
lines(ub,lty=3)
lines(lb,lty=3)
grid()
dev.off()
load(file='createtable')
a<-table.start()
a<-table.row.start(a)
a<-table.element(a,'Central Tendency - Ungrouped Data',4,TRUE)
a<-table.row.end(a)
a<-table.row.start(a)
a<-table.element(a,'Measure',header=TRUE)
a<-table.element(a,'Value',header=TRUE)
a<-table.element(a,'S.E.',header=TRUE)
a<-table.element(a,'Value/S.E.',header=TRUE)
a<-table.row.end(a)
a<-table.row.start(a)
a<-table.element(a,hyperlink('arithmetic_mean.htm', 'Arithmetic Mean', 'click to view the definition of the Arithmetic Mean'),header=TRUE)
a<-table.element(a,arm)
a<-table.element(a,hyperlink('arithmetic_mean_standard_error.htm', armse, 'click to view the definition of the Standard Error of the Arithmetic Mean'))
a<-table.element(a,armose)
a<-table.row.end(a)
a<-table.row.start(a)
a<-table.element(a,hyperlink('geometric_mean.htm', 'Geometric Mean', 'click to view the definition of the Geometric Mean'),header=TRUE)
a<-table.element(a,geo)
a<-table.element(a,'')
a<-table.row.end(a)
a<-table.row.start(a)
a<-table.element(a,hyperlink('harmonic_mean.htm', 'Harmonic Mean', 'click to view the definition of the Harmonic Mean'),header=TRUE)
a<-table.element(a,har)
a<-table.element(a,'')
a<-table.row.end(a)
a<-table.row.start(a)
a<-table.element(a,hyperlink('quadratic_mean.htm', 'Quadratic Mean', 'click to view the definition of the Quadratic Mean'),header=TRUE)
a<-table.element(a,qua)
a<-table.element(a,'')
a<-table.row.end(a)
for (j in 1:length(win[,1])) {
a<-table.row.start(a)
mylabel <- paste('Winsorized Mean (',j)
mylabel <- paste(mylabel,'/')
mylabel <- paste(mylabel,length(win[,1]))
mylabel <- paste(mylabel,')')
a<-table.element(a,hyperlink('winsorized_mean.htm', mylabel, 'click to view the definition of the Winsorized Mean'),header=TRUE)
a<-table.element(a,win[j,1])
a<-table.element(a,win[j,2])
a<-table.element(a,win[j,1]/win[j,2])
a<-table.row.end(a)
}
for (j in 1:length(tri[,1])) {
a<-table.row.start(a)
mylabel <- paste('Trimmed Mean (',j)
mylabel <- paste(mylabel,'/')
mylabel <- paste(mylabel,length(tri[,1]))
mylabel <- paste(mylabel,')')
a<-table.element(a,hyperlink('arithmetic_mean.htm', mylabel, 'click to view the definition of the Trimmed Mean'),header=TRUE)
a<-table.element(a,tri[j,1])
a<-table.element(a,tri[j,2])
a<-table.element(a,tri[j,1]/tri[j,2])
a<-table.row.end(a)
}
a<-table.row.start(a)
a<-table.element(a,hyperlink('median_1.htm', 'Median', 'click to view the definition of the Median'),header=TRUE)
a<-table.element(a,median(x))
a<-table.element(a,'')
a<-table.row.end(a)
a<-table.row.start(a)
a<-table.element(a,hyperlink('midrange.htm', 'Midrange', 'click to view the definition of the Midrange'),header=TRUE)
a<-table.element(a,midr)
a<-table.element(a,'')
a<-table.row.end(a)
a<-table.row.start(a)
mymid <- hyperlink('midmean.htm', 'Midmean', 'click to view the definition of the Midmean')
mylabel <- paste(mymid,hyperlink('method_1.htm','Weighted Average at Xnp',''),sep=' - ')
a<-table.element(a,mylabel,header=TRUE)
a<-table.element(a,midm[1])
a<-table.element(a,'')
a<-table.row.end(a)
a<-table.row.start(a)
mymid <- hyperlink('midmean.htm', 'Midmean', 'click to view the definition of the Midmean')
mylabel <- paste(mymid,hyperlink('method_2.htm','Weighted Average at X(n+1)p',''),sep=' - ')
a<-table.element(a,mylabel,header=TRUE)
a<-table.element(a,midm[2])
a<-table.element(a,'')
a<-table.row.end(a)
a<-table.row.start(a)
mymid <- hyperlink('midmean.htm', 'Midmean', 'click to view the definition of the Midmean')
mylabel <- paste(mymid,hyperlink('method_3.htm','Empirical Distribution Function',''),sep=' - ')
a<-table.element(a,mylabel,header=TRUE)
a<-table.element(a,midm[3])
a<-table.element(a,'')
a<-table.row.end(a)
a<-table.row.start(a)
mymid <- hyperlink('midmean.htm', 'Midmean', 'click to view the definition of the Midmean')
mylabel <- paste(mymid,hyperlink('method_4.htm','Empirical Distribution Function - Averaging',''),sep=' - ')
a<-table.element(a,mylabel,header=TRUE)
a<-table.element(a,midm[4])
a<-table.element(a,'')
a<-table.row.end(a)
a<-table.row.start(a)
mymid <- hyperlink('midmean.htm', 'Midmean', 'click to view the definition of the Midmean')
mylabel <- paste(mymid,hyperlink('method_5.htm','Empirical Distribution Function - Interpolation',''),sep=' - ')
a<-table.element(a,mylabel,header=TRUE)
a<-table.element(a,midm[5])
a<-table.element(a,'')
a<-table.row.end(a)
a<-table.row.start(a)
mymid <- hyperlink('midmean.htm', 'Midmean', 'click to view the definition of the Midmean')
mylabel <- paste(mymid,hyperlink('method_6.htm','Closest Observation',''),sep=' - ')
a<-table.element(a,mylabel,header=TRUE)
a<-table.element(a,midm[6])
a<-table.element(a,'')
a<-table.row.end(a)
a<-table.row.start(a)
mymid <- hyperlink('midmean.htm', 'Midmean', 'click to view the definition of the Midmean')
mylabel <- paste(mymid,hyperlink('method_7.htm','True Basic - Statistics Graphics Toolkit',''),sep=' - ')
a<-table.element(a,mylabel,header=TRUE)
a<-table.element(a,midm[7])
a<-table.element(a,'')
a<-table.row.end(a)
a<-table.row.start(a)
mymid <- hyperlink('midmean.htm', 'Midmean', 'click to view the definition of the Midmean')
mylabel <- paste(mymid,hyperlink('method_8.htm','MS Excel (old versions)',''),sep=' - ')
a<-table.element(a,mylabel,header=TRUE)
a<-table.element(a,midm[8])
a<-table.element(a,'')
a<-table.row.end(a)
a<-table.row.start(a)
a<-table.element(a,'Number of observations',header=TRUE)
a<-table.element(a,length(x))
a<-table.element(a,'')
a<-table.row.end(a)
a<-table.end(a)
table.save(a,file='mytable.tab')