Free Statistics

of Irreproducible Research!

Author's title

Author*Unverified author*
R Software Modulerwasp_autocorrelation.wasp
Title produced by software(Partial) Autocorrelation Function
Date of computationSun, 14 Dec 2008 12:39:47 -0700
Cite this page as followsStatistical Computations at FreeStatistics.org, Office for Research Development and Education, URL https://freestatistics.org/blog/index.php?v=date/2008/Dec/14/t1229283661h3maqpjbytpn9mo.htm/, Retrieved Tue, 14 May 2024 04:01:45 +0000
Statistical Computations at FreeStatistics.org, Office for Research Development and Education, URL https://freestatistics.org/blog/index.php?pk=33544, Retrieved Tue, 14 May 2024 04:01:45 +0000
QR Codes:

Original text written by user:
IsPrivate?No (this computation is public)
User-defined keywords
Estimated Impact177
Family? (F = Feedback message, R = changed R code, M = changed R Module, P = changed Parameters, D = changed Data)
-     [Variance Reduction Matrix] [vrm bel20] [2008-12-10 18:40:53] [74be16979710d4c4e7c6647856088456]
- RMPD    [(Partial) Autocorrelation Function] [PACF paper dow jones] [2008-12-14 19:39:47] [c8dc05b1cdf5010d9a4f2d773adefb82] [Current]
Feedback Forum

Post a new message
Dataseries X:
9005.73
9018.68
9349.44
9327.78
9753.63
10443.5
10853.87
10704.02
11052.23
10935.47
10714.03
10394.48
10817.9
11251.2
11281.26
10539.68
10483.39
10947.43
10580.27
10582.92
10654.41
11014.51
10967.87
10433.56
10665.78
10666.71
10682.74
10777.22
10052.6
10213.97
10546.82
10767.2
10444.5
10314.68
9042.56
9220.75
9721.84
9978.53
9923.81
9892.56
10500.98
10179.35
10080.48
9492.44
8616.49
8685.4
8160.67
8048.1
8641.21
8526.63
8474.21
7916.13
7977.64
8334.59
8623.36
9098.03
9154.34
9284.73
9492.49
9682.35
9762.12
10124.63
10540.05
10601.61
10323.73
10418.4
10092.96
10364.91
10152.09
10032.8
10204.59
10001.6
10411.75
10673.38
10539.51
10723.78
10682.06
10283.19
10377.18
10486.64
10545.38
10554.27
10532.54
10324.31
10695.25
10827.81
10872.48
10971.19
11145.65
11234.68
11333.88
10997.97
11036.89
11257.35
11533.59
11963.12
12185.15
12377.62
12512.89
12631.48
12268.53
12754.8
13407.75
13480.21
13673.28
13239.71
13557.69
13901.28
13200.58
13406.97
12538.12
12419.57
12193.88
12656.63
12812.48
12056.67
11322.38
11530.75
11114.08
9181.73
8614.55


Summary of computational transaction
Raw Inputview raw input (R code)
Raw Outputview raw output of R engine
Computing time1 seconds
R Server'Gwilym Jenkins' @ 72.249.127.135

\begin{tabular}{lllllllll}
\hline
Summary of computational transaction \tabularnewline
Raw Input & view raw input (R code)  \tabularnewline
Raw Output & view raw output of R engine  \tabularnewline
Computing time & 1 seconds \tabularnewline
R Server & 'Gwilym Jenkins' @ 72.249.127.135 \tabularnewline
\hline
\end{tabular}
%Source: https://freestatistics.org/blog/index.php?pk=33544&T=0

[TABLE]
[ROW][C]Summary of computational transaction[/C][/ROW]
[ROW][C]Raw Input[/C][C]view raw input (R code) [/C][/ROW]
[ROW][C]Raw Output[/C][C]view raw output of R engine [/C][/ROW]
[ROW][C]Computing time[/C][C]1 seconds[/C][/ROW]
[ROW][C]R Server[/C][C]'Gwilym Jenkins' @ 72.249.127.135[/C][/ROW]
[/TABLE]
Source: https://freestatistics.org/blog/index.php?pk=33544&T=0

Globally Unique Identifier (entire table): ba.freestatistics.org/blog/index.php?pk=33544&T=0

As an alternative you can also use a QR Code:  

The GUIDs for individual cells are displayed in the table below:

Summary of computational transaction
Raw Inputview raw input (R code)
Raw Outputview raw output of R engine
Computing time1 seconds
R Server'Gwilym Jenkins' @ 72.249.127.135


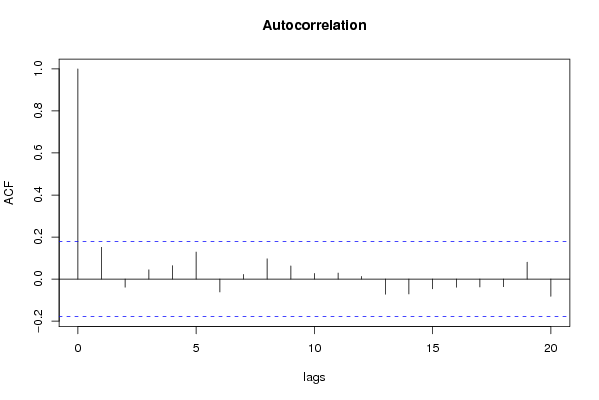
Autocorrelation Function
Time lag kACF(k)T-STATP-value
10.1512881.65730.050038
2-0.038676-0.42370.33628
30.0438030.47980.316107
40.0634870.69550.244054
50.1288061.4110.080416
6-0.061455-0.67320.251056
70.0222310.24350.404006
80.0963831.05580.146584
90.062210.68150.248441
100.0268710.29440.384497
110.0288210.31570.376381
120.0123170.13490.446446
13-0.072031-0.78910.215817
14-0.070861-0.77620.219566
15-0.046185-0.50590.306917
16-0.038918-0.42630.335318
17-0.037209-0.40760.342145
18-0.036347-0.39820.345609
190.0800570.8770.191126
20-0.082323-0.90180.184483

\begin{tabular}{lllllllll}
\hline
Autocorrelation Function \tabularnewline
Time lag k & ACF(k) & T-STAT & P-value \tabularnewline
1 & 0.151288 & 1.6573 & 0.050038 \tabularnewline
2 & -0.038676 & -0.4237 & 0.33628 \tabularnewline
3 & 0.043803 & 0.4798 & 0.316107 \tabularnewline
4 & 0.063487 & 0.6955 & 0.244054 \tabularnewline
5 & 0.128806 & 1.411 & 0.080416 \tabularnewline
6 & -0.061455 & -0.6732 & 0.251056 \tabularnewline
7 & 0.022231 & 0.2435 & 0.404006 \tabularnewline
8 & 0.096383 & 1.0558 & 0.146584 \tabularnewline
9 & 0.06221 & 0.6815 & 0.248441 \tabularnewline
10 & 0.026871 & 0.2944 & 0.384497 \tabularnewline
11 & 0.028821 & 0.3157 & 0.376381 \tabularnewline
12 & 0.012317 & 0.1349 & 0.446446 \tabularnewline
13 & -0.072031 & -0.7891 & 0.215817 \tabularnewline
14 & -0.070861 & -0.7762 & 0.219566 \tabularnewline
15 & -0.046185 & -0.5059 & 0.306917 \tabularnewline
16 & -0.038918 & -0.4263 & 0.335318 \tabularnewline
17 & -0.037209 & -0.4076 & 0.342145 \tabularnewline
18 & -0.036347 & -0.3982 & 0.345609 \tabularnewline
19 & 0.080057 & 0.877 & 0.191126 \tabularnewline
20 & -0.082323 & -0.9018 & 0.184483 \tabularnewline
\hline
\end{tabular}
%Source: https://freestatistics.org/blog/index.php?pk=33544&T=1

[TABLE]
[ROW][C]Autocorrelation Function[/C][/ROW]
[ROW][C]Time lag k[/C][C]ACF(k)[/C][C]T-STAT[/C][C]P-value[/C][/ROW]
[ROW][C]1[/C][C]0.151288[/C][C]1.6573[/C][C]0.050038[/C][/ROW]
[ROW][C]2[/C][C]-0.038676[/C][C]-0.4237[/C][C]0.33628[/C][/ROW]
[ROW][C]3[/C][C]0.043803[/C][C]0.4798[/C][C]0.316107[/C][/ROW]
[ROW][C]4[/C][C]0.063487[/C][C]0.6955[/C][C]0.244054[/C][/ROW]
[ROW][C]5[/C][C]0.128806[/C][C]1.411[/C][C]0.080416[/C][/ROW]
[ROW][C]6[/C][C]-0.061455[/C][C]-0.6732[/C][C]0.251056[/C][/ROW]
[ROW][C]7[/C][C]0.022231[/C][C]0.2435[/C][C]0.404006[/C][/ROW]
[ROW][C]8[/C][C]0.096383[/C][C]1.0558[/C][C]0.146584[/C][/ROW]
[ROW][C]9[/C][C]0.06221[/C][C]0.6815[/C][C]0.248441[/C][/ROW]
[ROW][C]10[/C][C]0.026871[/C][C]0.2944[/C][C]0.384497[/C][/ROW]
[ROW][C]11[/C][C]0.028821[/C][C]0.3157[/C][C]0.376381[/C][/ROW]
[ROW][C]12[/C][C]0.012317[/C][C]0.1349[/C][C]0.446446[/C][/ROW]
[ROW][C]13[/C][C]-0.072031[/C][C]-0.7891[/C][C]0.215817[/C][/ROW]
[ROW][C]14[/C][C]-0.070861[/C][C]-0.7762[/C][C]0.219566[/C][/ROW]
[ROW][C]15[/C][C]-0.046185[/C][C]-0.5059[/C][C]0.306917[/C][/ROW]
[ROW][C]16[/C][C]-0.038918[/C][C]-0.4263[/C][C]0.335318[/C][/ROW]
[ROW][C]17[/C][C]-0.037209[/C][C]-0.4076[/C][C]0.342145[/C][/ROW]
[ROW][C]18[/C][C]-0.036347[/C][C]-0.3982[/C][C]0.345609[/C][/ROW]
[ROW][C]19[/C][C]0.080057[/C][C]0.877[/C][C]0.191126[/C][/ROW]
[ROW][C]20[/C][C]-0.082323[/C][C]-0.9018[/C][C]0.184483[/C][/ROW]
[/TABLE]
Source: https://freestatistics.org/blog/index.php?pk=33544&T=1

Globally Unique Identifier (entire table): ba.freestatistics.org/blog/index.php?pk=33544&T=1

As an alternative you can also use a QR Code:  

The GUIDs for individual cells are displayed in the table below:

Autocorrelation Function
Time lag kACF(k)T-STATP-value
10.1512881.65730.050038
2-0.038676-0.42370.33628
30.0438030.47980.316107
40.0634870.69550.244054
50.1288061.4110.080416
6-0.061455-0.67320.251056
70.0222310.24350.404006
80.0963831.05580.146584
90.062210.68150.248441
100.0268710.29440.384497
110.0288210.31570.376381
120.0123170.13490.446446
13-0.072031-0.78910.215817
14-0.070861-0.77620.219566
15-0.046185-0.50590.306917
16-0.038918-0.42630.335318
17-0.037209-0.40760.342145
18-0.036347-0.39820.345609
190.0800570.8770.191126
20-0.082323-0.90180.184483


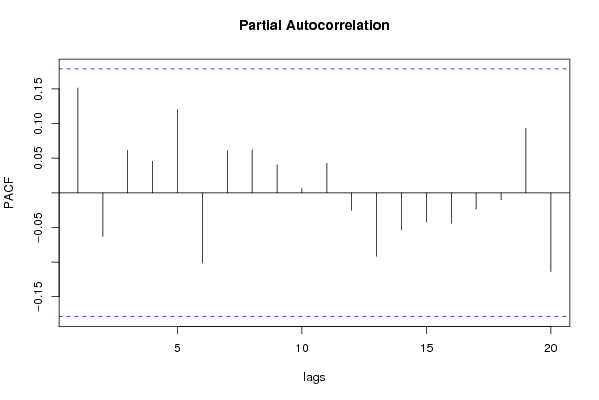
Partial Autocorrelation Function
Time lag kPACF(k)T-STATP-value
10.1512881.65730.050038
2-0.063006-0.69020.245701
30.0611930.67030.251965
40.0455850.49940.309221
50.1206671.32180.094368
6-0.101459-1.11140.134303
70.0609630.66780.252766
80.0618970.6780.249523
90.0403940.44250.329462
100.0063320.06940.472406
110.042830.46920.319898
12-0.025076-0.27470.392012
13-0.091579-1.00320.158893
14-0.053413-0.58510.279787
15-0.042081-0.4610.322827
16-0.043821-0.480.316038
17-0.023617-0.25870.398152
18-0.010096-0.11060.456059
190.0932521.02150.154531
20-0.113798-1.24660.107488

\begin{tabular}{lllllllll}
\hline
Partial Autocorrelation Function \tabularnewline
Time lag k & PACF(k) & T-STAT & P-value \tabularnewline
1 & 0.151288 & 1.6573 & 0.050038 \tabularnewline
2 & -0.063006 & -0.6902 & 0.245701 \tabularnewline
3 & 0.061193 & 0.6703 & 0.251965 \tabularnewline
4 & 0.045585 & 0.4994 & 0.309221 \tabularnewline
5 & 0.120667 & 1.3218 & 0.094368 \tabularnewline
6 & -0.101459 & -1.1114 & 0.134303 \tabularnewline
7 & 0.060963 & 0.6678 & 0.252766 \tabularnewline
8 & 0.061897 & 0.678 & 0.249523 \tabularnewline
9 & 0.040394 & 0.4425 & 0.329462 \tabularnewline
10 & 0.006332 & 0.0694 & 0.472406 \tabularnewline
11 & 0.04283 & 0.4692 & 0.319898 \tabularnewline
12 & -0.025076 & -0.2747 & 0.392012 \tabularnewline
13 & -0.091579 & -1.0032 & 0.158893 \tabularnewline
14 & -0.053413 & -0.5851 & 0.279787 \tabularnewline
15 & -0.042081 & -0.461 & 0.322827 \tabularnewline
16 & -0.043821 & -0.48 & 0.316038 \tabularnewline
17 & -0.023617 & -0.2587 & 0.398152 \tabularnewline
18 & -0.010096 & -0.1106 & 0.456059 \tabularnewline
19 & 0.093252 & 1.0215 & 0.154531 \tabularnewline
20 & -0.113798 & -1.2466 & 0.107488 \tabularnewline
\hline
\end{tabular}
%Source: https://freestatistics.org/blog/index.php?pk=33544&T=2

[TABLE]
[ROW][C]Partial Autocorrelation Function[/C][/ROW]
[ROW][C]Time lag k[/C][C]PACF(k)[/C][C]T-STAT[/C][C]P-value[/C][/ROW]
[ROW][C]1[/C][C]0.151288[/C][C]1.6573[/C][C]0.050038[/C][/ROW]
[ROW][C]2[/C][C]-0.063006[/C][C]-0.6902[/C][C]0.245701[/C][/ROW]
[ROW][C]3[/C][C]0.061193[/C][C]0.6703[/C][C]0.251965[/C][/ROW]
[ROW][C]4[/C][C]0.045585[/C][C]0.4994[/C][C]0.309221[/C][/ROW]
[ROW][C]5[/C][C]0.120667[/C][C]1.3218[/C][C]0.094368[/C][/ROW]
[ROW][C]6[/C][C]-0.101459[/C][C]-1.1114[/C][C]0.134303[/C][/ROW]
[ROW][C]7[/C][C]0.060963[/C][C]0.6678[/C][C]0.252766[/C][/ROW]
[ROW][C]8[/C][C]0.061897[/C][C]0.678[/C][C]0.249523[/C][/ROW]
[ROW][C]9[/C][C]0.040394[/C][C]0.4425[/C][C]0.329462[/C][/ROW]
[ROW][C]10[/C][C]0.006332[/C][C]0.0694[/C][C]0.472406[/C][/ROW]
[ROW][C]11[/C][C]0.04283[/C][C]0.4692[/C][C]0.319898[/C][/ROW]
[ROW][C]12[/C][C]-0.025076[/C][C]-0.2747[/C][C]0.392012[/C][/ROW]
[ROW][C]13[/C][C]-0.091579[/C][C]-1.0032[/C][C]0.158893[/C][/ROW]
[ROW][C]14[/C][C]-0.053413[/C][C]-0.5851[/C][C]0.279787[/C][/ROW]
[ROW][C]15[/C][C]-0.042081[/C][C]-0.461[/C][C]0.322827[/C][/ROW]
[ROW][C]16[/C][C]-0.043821[/C][C]-0.48[/C][C]0.316038[/C][/ROW]
[ROW][C]17[/C][C]-0.023617[/C][C]-0.2587[/C][C]0.398152[/C][/ROW]
[ROW][C]18[/C][C]-0.010096[/C][C]-0.1106[/C][C]0.456059[/C][/ROW]
[ROW][C]19[/C][C]0.093252[/C][C]1.0215[/C][C]0.154531[/C][/ROW]
[ROW][C]20[/C][C]-0.113798[/C][C]-1.2466[/C][C]0.107488[/C][/ROW]
[/TABLE]
Source: https://freestatistics.org/blog/index.php?pk=33544&T=2

Globally Unique Identifier (entire table): ba.freestatistics.org/blog/index.php?pk=33544&T=2

As an alternative you can also use a QR Code:  

The GUIDs for individual cells are displayed in the table below:

Partial Autocorrelation Function
Time lag kPACF(k)T-STATP-value
10.1512881.65730.050038
2-0.063006-0.69020.245701
30.0611930.67030.251965
40.0455850.49940.309221
50.1206671.32180.094368
6-0.101459-1.11140.134303
70.0609630.66780.252766
80.0618970.6780.249523
90.0403940.44250.329462
100.0063320.06940.472406
110.042830.46920.319898
12-0.025076-0.27470.392012
13-0.091579-1.00320.158893
14-0.053413-0.58510.279787
15-0.042081-0.4610.322827
16-0.043821-0.480.316038
17-0.023617-0.25870.398152
18-0.010096-0.11060.456059
190.0932521.02150.154531
20-0.113798-1.24660.107488


Parameters (Session):
par1 = Default ; par2 = 1 ; par3 = 1 ; par4 = 0 ; par5 = 12 ;
Parameters (R input):
par1 = Default ; par2 = 1 ; par3 = 1 ; par4 = 0 ; par5 = 12 ;
R code (references can be found in the software module):
if (par1 == 'Default') {
par1 = 10*log10(length(x))
} else {
par1 <- as.numeric(par1)
}
par2 <- as.numeric(par2)
par3 <- as.numeric(par3)
par4 <- as.numeric(par4)
par5 <- as.numeric(par5)
if (par2 == 0) {
x <- log(x)
} else {
x <- (x ^ par2 - 1) / par2
}
if (par3 > 0) x <- diff(x,lag=1,difference=par3)
if (par4 > 0) x <- diff(x,lag=par5,difference=par4)
bitmap(file='pic1.png')
racf <- acf(x,par1,main='Autocorrelation',xlab='lags',ylab='ACF')
dev.off()
bitmap(file='pic2.png')
rpacf <- pacf(x,par1,main='Partial Autocorrelation',xlab='lags',ylab='PACF')
dev.off()
(myacf <- c(racf$acf))
(mypacf <- c(rpacf$acf))
lengthx <- length(x)
sqrtn <- sqrt(lengthx)
load(file='createtable')
a<-table.start()
a<-table.row.start(a)
a<-table.element(a,'Autocorrelation Function',4,TRUE)
a<-table.row.end(a)
a<-table.row.start(a)
a<-table.element(a,'Time lag k',header=TRUE)
a<-table.element(a,hyperlink('basics.htm','ACF(k)','click here for more information about the Autocorrelation Function'),header=TRUE)
a<-table.element(a,'T-STAT',header=TRUE)
a<-table.element(a,'P-value',header=TRUE)
a<-table.row.end(a)
for (i in 2:(par1+1)) {
a<-table.row.start(a)
a<-table.element(a,i-1,header=TRUE)
a<-table.element(a,round(myacf[i],6))
mytstat <- myacf[i]*sqrtn
a<-table.element(a,round(mytstat,4))
a<-table.element(a,round(1-pt(abs(mytstat),lengthx),6))
a<-table.row.end(a)
}
a<-table.end(a)
table.save(a,file='mytable.tab')
a<-table.start()
a<-table.row.start(a)
a<-table.element(a,'Partial Autocorrelation Function',4,TRUE)
a<-table.row.end(a)
a<-table.row.start(a)
a<-table.element(a,'Time lag k',header=TRUE)
a<-table.element(a,hyperlink('basics.htm','PACF(k)','click here for more information about the Partial Autocorrelation Function'),header=TRUE)
a<-table.element(a,'T-STAT',header=TRUE)
a<-table.element(a,'P-value',header=TRUE)
a<-table.row.end(a)
for (i in 1:par1) {
a<-table.row.start(a)
a<-table.element(a,i,header=TRUE)
a<-table.element(a,round(mypacf[i],6))
mytstat <- mypacf[i]*sqrtn
a<-table.element(a,round(mytstat,4))
a<-table.element(a,round(1-pt(abs(mytstat),lengthx),6))
a<-table.row.end(a)
}
a<-table.end(a)
table.save(a,file='mytable1.tab')