Free Statistics

of Irreproducible Research!

Author's title

Author*Unverified author*
R Software Modulerwasp_autocorrelation.wasp
Title produced by software(Partial) Autocorrelation Function
Date of computationTue, 16 Dec 2008 05:52:35 -0700
Cite this page as followsStatistical Computations at FreeStatistics.org, Office for Research Development and Education, URL https://freestatistics.org/blog/index.php?v=date/2008/Dec/16/t12294320403xhpfack6jzr9s8.htm/, Retrieved Tue, 14 May 2024 03:06:54 +0000
Statistical Computations at FreeStatistics.org, Office for Research Development and Education, URL https://freestatistics.org/blog/index.php?pk=33941, Retrieved Tue, 14 May 2024 03:06:54 +0000
QR Codes:

Original text written by user:
IsPrivate?No (this computation is public)
User-defined keywords
Estimated Impact184
Family? (F = Feedback message, R = changed R code, M = changed R Module, P = changed Parameters, D = changed Data)
-     [Variance Reduction Matrix] [vrm bel20] [2008-12-10 18:40:53] [74be16979710d4c4e7c6647856088456]
-    D  [Variance Reduction Matrix] [VRM paper dow jones] [2008-12-14 19:19:01] [629740e107727857ef4896c7a406110f]
-    D    [Variance Reduction Matrix] [] [2008-12-16 12:43:25] [74be16979710d4c4e7c6647856088456]
- RMPD        [(Partial) Autocorrelation Function] [] [2008-12-16 12:52:35] [d41d8cd98f00b204e9800998ecf8427e] [Current]
Feedback Forum

Post a new message
Dataseries X:
14525.87
14295.79
13830.14
14153.22
15418.03
16666.97
16505.21
17135.96
18033.25
17671
17544.22
17677.9
18470.97
18409.96
18941.6
19685.53
19834.71
19598.93
17039.97
16969.28
16973.38
16329.89
16153.34
15311.7
14760.87
14452.93
13720.95
13266.27
12708.47
13411.84
13975.55
12974.89
12151.11
11576.21
9996.83
10438.9
10511.22
10496.2
10300.79
9981.65
11448.79
11384.49
11717.46
10965.88
10352.27
9751.2
9354.01
8792.5
8721.14
8692.94
8570.73
8538.47
8169.75
7905.84
8145.82
8895.71
9676.31
9884.59
10637.44
10717.13
10205.29
10295.98
10892.76
10631.92
11441.08
11950.95
11037.54
11527.72
11383.89
10989.34
11079.42
11028.93
10973
11068.05
11394.84
11545.71
11809.38
11395.64
11082.38
11402.75
11716.87
12204.98
12986.62
13392.79
14368.05
15650.83
16102.64
16187.64
16311.54
17232.97
16397.83
14990.31
15147.55
15786.78
15934.09
16519.44
16101.07
16775.08
17286.32
17741.23
17128.37
17460.53
17611.14
18001.37
17974.77
16460.95
16235.39
16903.36
15543.76
15532.18
13731.31
13547.84
12602.93
13357.7
13995.33
14084.6
13168.91
12989.35
12123.53
9117.03
8531.45


Summary of computational transaction
Raw Inputview raw input (R code)
Raw Outputview raw output of R engine
Computing time1 seconds
R Server'George Udny Yule' @ 72.249.76.132

\begin{tabular}{lllllllll}
\hline
Summary of computational transaction \tabularnewline
Raw Input & view raw input (R code)  \tabularnewline
Raw Output & view raw output of R engine  \tabularnewline
Computing time & 1 seconds \tabularnewline
R Server & 'George Udny Yule' @ 72.249.76.132 \tabularnewline
\hline
\end{tabular}
%Source: https://freestatistics.org/blog/index.php?pk=33941&T=0

[TABLE]
[ROW][C]Summary of computational transaction[/C][/ROW]
[ROW][C]Raw Input[/C][C]view raw input (R code) [/C][/ROW]
[ROW][C]Raw Output[/C][C]view raw output of R engine [/C][/ROW]
[ROW][C]Computing time[/C][C]1 seconds[/C][/ROW]
[ROW][C]R Server[/C][C]'George Udny Yule' @ 72.249.76.132[/C][/ROW]
[/TABLE]
Source: https://freestatistics.org/blog/index.php?pk=33941&T=0

Globally Unique Identifier (entire table): ba.freestatistics.org/blog/index.php?pk=33941&T=0

As an alternative you can also use a QR Code:  

The GUIDs for individual cells are displayed in the table below:

Summary of computational transaction
Raw Inputview raw input (R code)
Raw Outputview raw output of R engine
Computing time1 seconds
R Server'George Udny Yule' @ 72.249.76.132


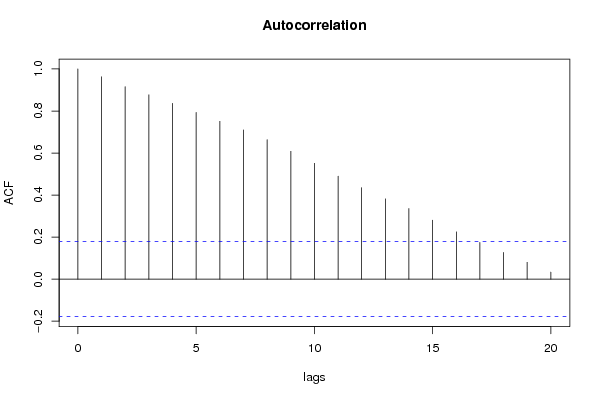
Autocorrelation Function
Time lag kACF(k)T-STATP-value
10.96277710.59060
20.91588610.07470
30.8769299.64620
40.8362949.19920
50.7932398.72560
60.7510728.26180
70.7100937.8110
80.6637047.30070
90.6084016.69240
100.5509816.06080
110.489785.38760
120.4351454.78662e-06
130.3820494.20252.5e-05
140.335723.69290.000167
150.2807813.08860.001247
160.2250822.47590.007337
170.1745591.92010.028597
180.1272811.40010.082023
190.0801340.88150.189906
200.0336550.37020.355938

\begin{tabular}{lllllllll}
\hline
Autocorrelation Function \tabularnewline
Time lag k & ACF(k) & T-STAT & P-value \tabularnewline
1 & 0.962777 & 10.5906 & 0 \tabularnewline
2 & 0.915886 & 10.0747 & 0 \tabularnewline
3 & 0.876929 & 9.6462 & 0 \tabularnewline
4 & 0.836294 & 9.1992 & 0 \tabularnewline
5 & 0.793239 & 8.7256 & 0 \tabularnewline
6 & 0.751072 & 8.2618 & 0 \tabularnewline
7 & 0.710093 & 7.811 & 0 \tabularnewline
8 & 0.663704 & 7.3007 & 0 \tabularnewline
9 & 0.608401 & 6.6924 & 0 \tabularnewline
10 & 0.550981 & 6.0608 & 0 \tabularnewline
11 & 0.48978 & 5.3876 & 0 \tabularnewline
12 & 0.435145 & 4.7866 & 2e-06 \tabularnewline
13 & 0.382049 & 4.2025 & 2.5e-05 \tabularnewline
14 & 0.33572 & 3.6929 & 0.000167 \tabularnewline
15 & 0.280781 & 3.0886 & 0.001247 \tabularnewline
16 & 0.225082 & 2.4759 & 0.007337 \tabularnewline
17 & 0.174559 & 1.9201 & 0.028597 \tabularnewline
18 & 0.127281 & 1.4001 & 0.082023 \tabularnewline
19 & 0.080134 & 0.8815 & 0.189906 \tabularnewline
20 & 0.033655 & 0.3702 & 0.355938 \tabularnewline
\hline
\end{tabular}
%Source: https://freestatistics.org/blog/index.php?pk=33941&T=1

[TABLE]
[ROW][C]Autocorrelation Function[/C][/ROW]
[ROW][C]Time lag k[/C][C]ACF(k)[/C][C]T-STAT[/C][C]P-value[/C][/ROW]
[ROW][C]1[/C][C]0.962777[/C][C]10.5906[/C][C]0[/C][/ROW]
[ROW][C]2[/C][C]0.915886[/C][C]10.0747[/C][C]0[/C][/ROW]
[ROW][C]3[/C][C]0.876929[/C][C]9.6462[/C][C]0[/C][/ROW]
[ROW][C]4[/C][C]0.836294[/C][C]9.1992[/C][C]0[/C][/ROW]
[ROW][C]5[/C][C]0.793239[/C][C]8.7256[/C][C]0[/C][/ROW]
[ROW][C]6[/C][C]0.751072[/C][C]8.2618[/C][C]0[/C][/ROW]
[ROW][C]7[/C][C]0.710093[/C][C]7.811[/C][C]0[/C][/ROW]
[ROW][C]8[/C][C]0.663704[/C][C]7.3007[/C][C]0[/C][/ROW]
[ROW][C]9[/C][C]0.608401[/C][C]6.6924[/C][C]0[/C][/ROW]
[ROW][C]10[/C][C]0.550981[/C][C]6.0608[/C][C]0[/C][/ROW]
[ROW][C]11[/C][C]0.48978[/C][C]5.3876[/C][C]0[/C][/ROW]
[ROW][C]12[/C][C]0.435145[/C][C]4.7866[/C][C]2e-06[/C][/ROW]
[ROW][C]13[/C][C]0.382049[/C][C]4.2025[/C][C]2.5e-05[/C][/ROW]
[ROW][C]14[/C][C]0.33572[/C][C]3.6929[/C][C]0.000167[/C][/ROW]
[ROW][C]15[/C][C]0.280781[/C][C]3.0886[/C][C]0.001247[/C][/ROW]
[ROW][C]16[/C][C]0.225082[/C][C]2.4759[/C][C]0.007337[/C][/ROW]
[ROW][C]17[/C][C]0.174559[/C][C]1.9201[/C][C]0.028597[/C][/ROW]
[ROW][C]18[/C][C]0.127281[/C][C]1.4001[/C][C]0.082023[/C][/ROW]
[ROW][C]19[/C][C]0.080134[/C][C]0.8815[/C][C]0.189906[/C][/ROW]
[ROW][C]20[/C][C]0.033655[/C][C]0.3702[/C][C]0.355938[/C][/ROW]
[/TABLE]
Source: https://freestatistics.org/blog/index.php?pk=33941&T=1

Globally Unique Identifier (entire table): ba.freestatistics.org/blog/index.php?pk=33941&T=1

As an alternative you can also use a QR Code:  

The GUIDs for individual cells are displayed in the table below:

Autocorrelation Function
Time lag kACF(k)T-STATP-value
10.96277710.59060
20.91588610.07470
30.8769299.64620
40.8362949.19920
50.7932398.72560
60.7510728.26180
70.7100937.8110
80.6637047.30070
90.6084016.69240
100.5509816.06080
110.489785.38760
120.4351454.78662e-06
130.3820494.20252.5e-05
140.335723.69290.000167
150.2807813.08860.001247
160.2250822.47590.007337
170.1745591.92010.028597
180.1272811.40010.082023
190.0801340.88150.189906
200.0336550.37020.355938


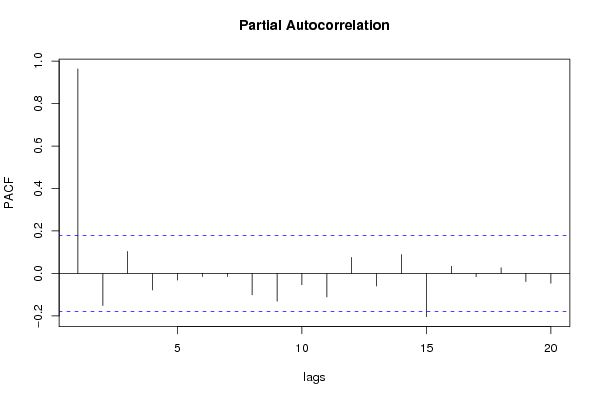
Partial Autocorrelation Function
Time lag kPACF(k)T-STATP-value
10.96277710.59060
2-0.151309-1.66440.04931
30.1034931.13840.128597
4-0.077381-0.85120.198172
5-0.030845-0.33930.367488
6-0.014213-0.15630.438014
7-0.01455-0.16010.436552
8-0.100432-1.10480.13573
9-0.130754-1.43830.076466
10-0.052694-0.57960.28162
11-0.110746-1.21820.112757
120.0756570.83220.20346
13-0.058937-0.64830.259009
140.0888690.97760.16512
15-0.203259-2.23590.013597
160.0338270.37210.355238
17-0.014987-0.16490.434667
180.0266510.29320.384952
19-0.037838-0.41620.338995
20-0.045966-0.50560.307019

\begin{tabular}{lllllllll}
\hline
Partial Autocorrelation Function \tabularnewline
Time lag k & PACF(k) & T-STAT & P-value \tabularnewline
1 & 0.962777 & 10.5906 & 0 \tabularnewline
2 & -0.151309 & -1.6644 & 0.04931 \tabularnewline
3 & 0.103493 & 1.1384 & 0.128597 \tabularnewline
4 & -0.077381 & -0.8512 & 0.198172 \tabularnewline
5 & -0.030845 & -0.3393 & 0.367488 \tabularnewline
6 & -0.014213 & -0.1563 & 0.438014 \tabularnewline
7 & -0.01455 & -0.1601 & 0.436552 \tabularnewline
8 & -0.100432 & -1.1048 & 0.13573 \tabularnewline
9 & -0.130754 & -1.4383 & 0.076466 \tabularnewline
10 & -0.052694 & -0.5796 & 0.28162 \tabularnewline
11 & -0.110746 & -1.2182 & 0.112757 \tabularnewline
12 & 0.075657 & 0.8322 & 0.20346 \tabularnewline
13 & -0.058937 & -0.6483 & 0.259009 \tabularnewline
14 & 0.088869 & 0.9776 & 0.16512 \tabularnewline
15 & -0.203259 & -2.2359 & 0.013597 \tabularnewline
16 & 0.033827 & 0.3721 & 0.355238 \tabularnewline
17 & -0.014987 & -0.1649 & 0.434667 \tabularnewline
18 & 0.026651 & 0.2932 & 0.384952 \tabularnewline
19 & -0.037838 & -0.4162 & 0.338995 \tabularnewline
20 & -0.045966 & -0.5056 & 0.307019 \tabularnewline
\hline
\end{tabular}
%Source: https://freestatistics.org/blog/index.php?pk=33941&T=2

[TABLE]
[ROW][C]Partial Autocorrelation Function[/C][/ROW]
[ROW][C]Time lag k[/C][C]PACF(k)[/C][C]T-STAT[/C][C]P-value[/C][/ROW]
[ROW][C]1[/C][C]0.962777[/C][C]10.5906[/C][C]0[/C][/ROW]
[ROW][C]2[/C][C]-0.151309[/C][C]-1.6644[/C][C]0.04931[/C][/ROW]
[ROW][C]3[/C][C]0.103493[/C][C]1.1384[/C][C]0.128597[/C][/ROW]
[ROW][C]4[/C][C]-0.077381[/C][C]-0.8512[/C][C]0.198172[/C][/ROW]
[ROW][C]5[/C][C]-0.030845[/C][C]-0.3393[/C][C]0.367488[/C][/ROW]
[ROW][C]6[/C][C]-0.014213[/C][C]-0.1563[/C][C]0.438014[/C][/ROW]
[ROW][C]7[/C][C]-0.01455[/C][C]-0.1601[/C][C]0.436552[/C][/ROW]
[ROW][C]8[/C][C]-0.100432[/C][C]-1.1048[/C][C]0.13573[/C][/ROW]
[ROW][C]9[/C][C]-0.130754[/C][C]-1.4383[/C][C]0.076466[/C][/ROW]
[ROW][C]10[/C][C]-0.052694[/C][C]-0.5796[/C][C]0.28162[/C][/ROW]
[ROW][C]11[/C][C]-0.110746[/C][C]-1.2182[/C][C]0.112757[/C][/ROW]
[ROW][C]12[/C][C]0.075657[/C][C]0.8322[/C][C]0.20346[/C][/ROW]
[ROW][C]13[/C][C]-0.058937[/C][C]-0.6483[/C][C]0.259009[/C][/ROW]
[ROW][C]14[/C][C]0.088869[/C][C]0.9776[/C][C]0.16512[/C][/ROW]
[ROW][C]15[/C][C]-0.203259[/C][C]-2.2359[/C][C]0.013597[/C][/ROW]
[ROW][C]16[/C][C]0.033827[/C][C]0.3721[/C][C]0.355238[/C][/ROW]
[ROW][C]17[/C][C]-0.014987[/C][C]-0.1649[/C][C]0.434667[/C][/ROW]
[ROW][C]18[/C][C]0.026651[/C][C]0.2932[/C][C]0.384952[/C][/ROW]
[ROW][C]19[/C][C]-0.037838[/C][C]-0.4162[/C][C]0.338995[/C][/ROW]
[ROW][C]20[/C][C]-0.045966[/C][C]-0.5056[/C][C]0.307019[/C][/ROW]
[/TABLE]
Source: https://freestatistics.org/blog/index.php?pk=33941&T=2

Globally Unique Identifier (entire table): ba.freestatistics.org/blog/index.php?pk=33941&T=2

As an alternative you can also use a QR Code:  

The GUIDs for individual cells are displayed in the table below:

Partial Autocorrelation Function
Time lag kPACF(k)T-STATP-value
10.96277710.59060
2-0.151309-1.66440.04931
30.1034931.13840.128597
4-0.077381-0.85120.198172
5-0.030845-0.33930.367488
6-0.014213-0.15630.438014
7-0.01455-0.16010.436552
8-0.100432-1.10480.13573
9-0.130754-1.43830.076466
10-0.052694-0.57960.28162
11-0.110746-1.21820.112757
120.0756570.83220.20346
13-0.058937-0.64830.259009
140.0888690.97760.16512
15-0.203259-2.23590.013597
160.0338270.37210.355238
17-0.014987-0.16490.434667
180.0266510.29320.384952
19-0.037838-0.41620.338995
20-0.045966-0.50560.307019


Parameters (Session):
par1 = Default ; par2 = 1 ; par3 = 0 ; par4 = 0 ; par5 = 12 ;
Parameters (R input):
par1 = Default ; par2 = 1 ; par3 = 0 ; par4 = 0 ; par5 = 12 ;
R code (references can be found in the software module):
if (par1 == 'Default') {
par1 = 10*log10(length(x))
} else {
par1 <- as.numeric(par1)
}
par2 <- as.numeric(par2)
par3 <- as.numeric(par3)
par4 <- as.numeric(par4)
par5 <- as.numeric(par5)
if (par2 == 0) {
x <- log(x)
} else {
x <- (x ^ par2 - 1) / par2
}
if (par3 > 0) x <- diff(x,lag=1,difference=par3)
if (par4 > 0) x <- diff(x,lag=par5,difference=par4)
bitmap(file='pic1.png')
racf <- acf(x,par1,main='Autocorrelation',xlab='lags',ylab='ACF')
dev.off()
bitmap(file='pic2.png')
rpacf <- pacf(x,par1,main='Partial Autocorrelation',xlab='lags',ylab='PACF')
dev.off()
(myacf <- c(racf$acf))
(mypacf <- c(rpacf$acf))
lengthx <- length(x)
sqrtn <- sqrt(lengthx)
load(file='createtable')
a<-table.start()
a<-table.row.start(a)
a<-table.element(a,'Autocorrelation Function',4,TRUE)
a<-table.row.end(a)
a<-table.row.start(a)
a<-table.element(a,'Time lag k',header=TRUE)
a<-table.element(a,hyperlink('basics.htm','ACF(k)','click here for more information about the Autocorrelation Function'),header=TRUE)
a<-table.element(a,'T-STAT',header=TRUE)
a<-table.element(a,'P-value',header=TRUE)
a<-table.row.end(a)
for (i in 2:(par1+1)) {
a<-table.row.start(a)
a<-table.element(a,i-1,header=TRUE)
a<-table.element(a,round(myacf[i],6))
mytstat <- myacf[i]*sqrtn
a<-table.element(a,round(mytstat,4))
a<-table.element(a,round(1-pt(abs(mytstat),lengthx),6))
a<-table.row.end(a)
}
a<-table.end(a)
table.save(a,file='mytable.tab')
a<-table.start()
a<-table.row.start(a)
a<-table.element(a,'Partial Autocorrelation Function',4,TRUE)
a<-table.row.end(a)
a<-table.row.start(a)
a<-table.element(a,'Time lag k',header=TRUE)
a<-table.element(a,hyperlink('basics.htm','PACF(k)','click here for more information about the Partial Autocorrelation Function'),header=TRUE)
a<-table.element(a,'T-STAT',header=TRUE)
a<-table.element(a,'P-value',header=TRUE)
a<-table.row.end(a)
for (i in 1:par1) {
a<-table.row.start(a)
a<-table.element(a,i,header=TRUE)
a<-table.element(a,round(mypacf[i],6))
mytstat <- mypacf[i]*sqrtn
a<-table.element(a,round(mytstat,4))
a<-table.element(a,round(1-pt(abs(mytstat),lengthx),6))
a<-table.row.end(a)
}
a<-table.end(a)
table.save(a,file='mytable1.tab')