Free Statistics
of Irreproducible Research!
Description of Statistical Computation | |||||||||||||||||||||||||||||||||||||||||
|---|---|---|---|---|---|---|---|---|---|---|---|---|---|---|---|---|---|---|---|---|---|---|---|---|---|---|---|---|---|---|---|---|---|---|---|---|---|---|---|---|---|
| Author's title | |||||||||||||||||||||||||||||||||||||||||
| Author | *The author of this computation has been verified* | ||||||||||||||||||||||||||||||||||||||||
| R Software Module | rwasp_univariatedataseries.wasp | ||||||||||||||||||||||||||||||||||||||||
| Title produced by software | Univariate Data Series | ||||||||||||||||||||||||||||||||||||||||
| Date of computation | Wed, 17 Dec 2008 12:32:14 -0700 | ||||||||||||||||||||||||||||||||||||||||
| Cite this page as follows | Statistical Computations at FreeStatistics.org, Office for Research Development and Education, URL https://freestatistics.org/blog/index.php?v=date/2008/Dec/17/t1229542352xxiapprg23z6106.htm/, Retrieved Mon, 08 Jun 2026 08:38:57 +0000 | ||||||||||||||||||||||||||||||||||||||||
| Statistical Computations at FreeStatistics.org, Office for Research Development and Education, URL https://freestatistics.org/blog/index.php?pk=34513, Retrieved Mon, 08 Jun 2026 08:38:57 +0000 | |||||||||||||||||||||||||||||||||||||||||
| QR Codes: | |||||||||||||||||||||||||||||||||||||||||
|
| |||||||||||||||||||||||||||||||||||||||||
| Original text written by user: | |||||||||||||||||||||||||||||||||||||||||
| IsPrivate? | No (this computation is public) | ||||||||||||||||||||||||||||||||||||||||
| User-defined keywords | |||||||||||||||||||||||||||||||||||||||||
| Estimated Impact | 603 | ||||||||||||||||||||||||||||||||||||||||
Tree of Dependent Computations | |||||||||||||||||||||||||||||||||||||||||
| Family? (F = Feedback message, R = changed R code, M = changed R Module, P = changed Parameters, D = changed Data) | |||||||||||||||||||||||||||||||||||||||||
| - [Pearson Correlation] [Correlation: inve...] [2008-12-16 19:18:46] [5161246d1ccc1b670cc664d03050f084] - RMPD [Univariate Data Series] [] [2008-12-17 14:56:45] [b98453cac15ba1066b407e146608df68] - PD [Univariate Data Series] [] [2008-12-17 19:32:14] [d76b387543b13b5e3afd8ff9e5fdc89f] [Current] - MPD [Univariate Data Series] [Res1] [2009-12-17 19:22:49] [7d268329e554b8694908ba13e6e6f258] - P [Univariate Data Series] [Res1] [2009-12-18 08:57:34] [7d268329e554b8694908ba13e6e6f258] - RMP [Harrell-Davis Quantiles] [HDQ1] [2009-12-18 09:04:05] [7d268329e554b8694908ba13e6e6f258] - P [Harrell-Davis Quantiles] [HDQ1] [2009-12-18 16:08:04] [7d268329e554b8694908ba13e6e6f258] - RMPD [] [CT1] [-0001-11-30 00:00:00] [7d268329e554b8694908ba13e6e6f258] - RMPD [] [CT1] [-0001-11-30 00:00:00] [7d268329e554b8694908ba13e6e6f258] - RMPD [Central Tendency] [CT1] [2009-12-18 08:47:00] [7d268329e554b8694908ba13e6e6f258] | |||||||||||||||||||||||||||||||||||||||||
| Feedback Forum | |||||||||||||||||||||||||||||||||||||||||
Post a new message | |||||||||||||||||||||||||||||||||||||||||
Dataset | |||||||||||||||||||||||||||||||||||||||||
| Dataseries X: | |||||||||||||||||||||||||||||||||||||||||
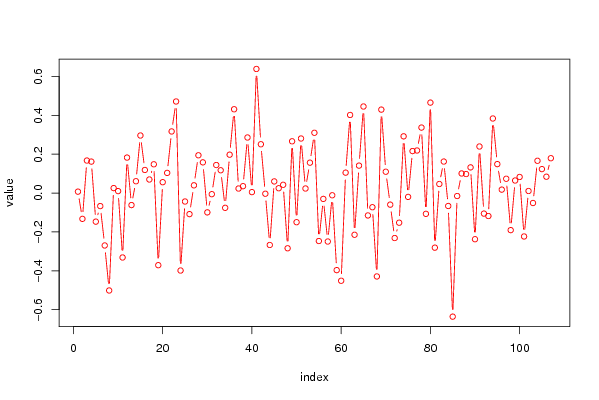
0.0074506557876825 -0.132442416277169 0.167508335619297 0.162179475022331 -0.146931001973622 -0.0668603738682577 -0.269529881950270 -0.501159535904405 0.0257705207115739 0.0103920112419809 -0.331297153720096 0.182851594080835 -0.0616423002040546 0.0611391202324174 0.296329447468030 0.119060175741668 0.0700576382174025 0.148255268858675 -0.371005644115859 0.0561643933314547 0.103938003871328 0.317403809539125 0.47148700869133 -0.398411446088021 -0.0432761149904893 -0.108118935756980 0.0401107485044805 0.194657389845583 0.158210139077063 -0.0990937826064845 -0.00556266803194087 0.144548748293867 0.117606815437551 -0.0757110164777423 0.197705397710686 0.43154186277326 0.0235289943338020 0.0356480768094974 0.286156406204286 0.00513379161279537 0.63893193763354 0.251390112105119 -0.00323749422575261 -0.266976252327191 0.0601251864592664 0.0250884232596969 0.0427753200608914 -0.283921635806831 0.266596524755491 -0.149765918875036 0.280920126538979 0.0236532951156516 0.156622609872607 0.31040672700784 -0.246586965870557 -0.0298393590558678 -0.249166463960415 -0.0112133689462801 -0.396395414468751 -0.451133318396317 0.105253505345444 0.402092579269608 -0.21438906878249 0.141397349553946 0.445665827381415 -0.114984764067256 -0.0727348687731968 -0.428887385112165 0.429672738628761 0.110015782612343 -0.0594175281086153 -0.231319503867720 -0.152401412327718 0.292208397539926 -0.0196616726586817 0.216316258224451 0.219252748724271 0.337295855125314 -0.106712413444743 0.465673740811403 -0.280816345253791 0.0468365870230674 0.162365651238084 -0.0663666999576886 -0.635837605985355 -0.0149943478807808 0.10104210135649 0.0980516104255642 0.132481182172313 -0.237259624681085 0.239843258350056 -0.105452963338377 -0.118119254249678 0.384026536850281 0.149193012243773 0.0179012528572979 0.0737714063911667 -0.190562367586525 0.0648156227466323 0.0831011315891885 -0.223187173116132 0.0109073057119824 -0.0509472940820421 0.166337221716903 0.123534000363326 0.0842716541850166 0.17950771880394 | |||||||||||||||||||||||||||||||||||||||||
Tables (Output of Computation) | |||||||||||||||||||||||||||||||||||||||||
| |||||||||||||||||||||||||||||||||||||||||
Figures (Output of Computation) | |||||||||||||||||||||||||||||||||||||||||
Input Parameters & R Code | |||||||||||||||||||||||||||||||||||||||||
| Parameters (Session): | |||||||||||||||||||||||||||||||||||||||||
| par1 = residuals ; | |||||||||||||||||||||||||||||||||||||||||
| Parameters (R input): | |||||||||||||||||||||||||||||||||||||||||
| par1 = residuals ; par2 = ; par3 = ; | |||||||||||||||||||||||||||||||||||||||||
| R code (references can be found in the software module): | |||||||||||||||||||||||||||||||||||||||||
bitmap(file='test1.png') | |||||||||||||||||||||||||||||||||||||||||