Free Statistics

of Irreproducible Research!

Author's title

Author*The author of this computation has been verified*
R Software Modulerwasp_multipleregression.wasp
Title produced by softwareMultiple Regression
Date of computationMon, 22 Dec 2008 09:54:43 -0700
Cite this page as followsStatistical Computations at FreeStatistics.org, Office for Research Development and Education, URL https://freestatistics.org/blog/index.php?v=date/2008/Dec/22/t1229966743zl9t6b89647tbwg.htm/, Retrieved Wed, 01 May 2024 23:17:57 +0000
Statistical Computations at FreeStatistics.org, Office for Research Development and Education, URL https://freestatistics.org/blog/index.php?pk=36152, Retrieved Wed, 01 May 2024 23:17:57 +0000
QR Codes:

Original text written by user:
IsPrivate?No (this computation is public)
User-defined keywords
Estimated Impact186
Family? (F = Feedback message, R = changed R code, M = changed R Module, P = changed Parameters, D = changed Data)
-     [Multiple Regression] [Colombia Coffee -...] [2008-02-26 11:21:57] [74be16979710d4c4e7c6647856088456]
-   PD    [Multiple Regression] [Multiple Regressi...] [2008-12-22 16:54:43] [dafd615cb3e0decc017580d68ecea30a] [Current]
-    D      [Multiple Regression] [Multiple Regressi...] [2008-12-22 20:26:15] [b187fac1a1b0cb3920f54366df47fea3]
-    D      [Multiple Regression] [multiple regressi...] [2008-12-22 20:54:23] [b641c14ac36cb6fee377f3b099dcac19]
Feedback Forum

Post a new message
Dataseries X:
101,1	103
100,7	102,4
100	102
100	101,8
100,8	101,6
101,9	101,4
102,7	101,3
103,1	101,4
103,5	101,7
103,9	102,4
104,4	103,1
105,2	103,8
106	104,4
107	105
108,2	105,7
109	106,4
109,1	107,1
109,3	107,9
110,1	108,8
110,7	109,6
110,8	110,3
110,7	110,8
110,9	111,2
111,3	111,7
111,6	112,3
111,8	112,8
112,1	113,1
112,3	113,1
112,5	113,1
113	113,2
113,6	113,1
114,4	112,8
114,9	112,5
115,2	112,3
116	112,5
117	112,9
118	113,5
119,4	114,1
121,1	114,6
123,1	114,9
125	115,4
126,3	115,7
127,4	116,1
129	116,5
131	117,1
133,3	117,5
135,9	117,7
138,4	117,7
140,3	117,7
141,7	117,6
143,1	117,5
144,5	117,6
146	117,9
147,7	118,2
149	118,5
149,7	118,7
150,2	118,8
150,5	118,9
150,7	119
150,9	119


Summary of computational transaction
Raw Inputview raw input (R code)
Raw Outputview raw output of R engine
Computing time4 seconds
R Server'Gwilym Jenkins' @ 72.249.127.135

\begin{tabular}{lllllllll}
\hline
Summary of computational transaction \tabularnewline
Raw Input & view raw input (R code)  \tabularnewline
Raw Output & view raw output of R engine  \tabularnewline
Computing time & 4 seconds \tabularnewline
R Server & 'Gwilym Jenkins' @ 72.249.127.135 \tabularnewline
\hline
\end{tabular}
%Source: https://freestatistics.org/blog/index.php?pk=36152&T=0

[TABLE]
[ROW][C]Summary of computational transaction[/C][/ROW]
[ROW][C]Raw Input[/C][C]view raw input (R code) [/C][/ROW]
[ROW][C]Raw Output[/C][C]view raw output of R engine [/C][/ROW]
[ROW][C]Computing time[/C][C]4 seconds[/C][/ROW]
[ROW][C]R Server[/C][C]'Gwilym Jenkins' @ 72.249.127.135[/C][/ROW]
[/TABLE]
Source: https://freestatistics.org/blog/index.php?pk=36152&T=0

Globally Unique Identifier (entire table): ba.freestatistics.org/blog/index.php?pk=36152&T=0

As an alternative you can also use a QR Code:  

The GUIDs for individual cells are displayed in the table below:

Summary of computational transaction
Raw Inputview raw input (R code)
Raw Outputview raw output of R engine
Computing time4 seconds
R Server'Gwilym Jenkins' @ 72.249.127.135


Multiple Linear Regression - Estimated Regression Equation
Transportmiddelen[t] = + 117.173226126416 -0.169843653424947Machines[t] + 0.481241096237379t + e[t]

\begin{tabular}{lllllllll}
\hline
Multiple Linear Regression - Estimated Regression Equation \tabularnewline
Transportmiddelen[t] =  +  117.173226126416 -0.169843653424947Machines[t] +  0.481241096237379t  + e[t] \tabularnewline
\hline
\end{tabular}
%Source: https://freestatistics.org/blog/index.php?pk=36152&T=1

[TABLE]
[ROW][C]Multiple Linear Regression - Estimated Regression Equation[/C][/ROW]
[ROW][C]Transportmiddelen[t] =  +  117.173226126416 -0.169843653424947Machines[t] +  0.481241096237379t  + e[t][/C][/ROW]
[/TABLE]
Source: https://freestatistics.org/blog/index.php?pk=36152&T=1

Globally Unique Identifier (entire table): ba.freestatistics.org/blog/index.php?pk=36152&T=1

As an alternative you can also use a QR Code:  

The GUIDs for individual cells are displayed in the table below:

Multiple Linear Regression - Estimated Regression Equation
Transportmiddelen[t] = + 117.173226126416 -0.169843653424947Machines[t] + 0.481241096237379t + e[t]


Multiple Linear Regression - Ordinary Least Squares
VariableParameterS.D.T-STATH0: parameter = 02-tail p-value1-tail p-value
(Intercept)117.1732261264163.15397937.150900
Machines-0.1698436534249470.03383-5.02055e-063e-06
t0.4812410962373790.03161515.221700

\begin{tabular}{lllllllll}
\hline
Multiple Linear Regression - Ordinary Least Squares \tabularnewline
Variable & Parameter & S.D. & T-STATH0: parameter = 0 & 2-tail p-value & 1-tail p-value \tabularnewline
(Intercept) & 117.173226126416 & 3.153979 & 37.1509 & 0 & 0 \tabularnewline
Machines & -0.169843653424947 & 0.03383 & -5.0205 & 5e-06 & 3e-06 \tabularnewline
t & 0.481241096237379 & 0.031615 & 15.2217 & 0 & 0 \tabularnewline
\hline
\end{tabular}
%Source: https://freestatistics.org/blog/index.php?pk=36152&T=2

[TABLE]
[ROW][C]Multiple Linear Regression - Ordinary Least Squares[/C][/ROW]
[ROW][C]Variable[/C][C]Parameter[/C][C]S.D.[/C][C]T-STATH0: parameter = 0[/C][C]2-tail p-value[/C][C]1-tail p-value[/C][/ROW]
[ROW][C](Intercept)[/C][C]117.173226126416[/C][C]3.153979[/C][C]37.1509[/C][C]0[/C][C]0[/C][/ROW]
[ROW][C]Machines[/C][C]-0.169843653424947[/C][C]0.03383[/C][C]-5.0205[/C][C]5e-06[/C][C]3e-06[/C][/ROW]
[ROW][C]t[/C][C]0.481241096237379[/C][C]0.031615[/C][C]15.2217[/C][C]0[/C][C]0[/C][/ROW]
[/TABLE]
Source: https://freestatistics.org/blog/index.php?pk=36152&T=2

Globally Unique Identifier (entire table): ba.freestatistics.org/blog/index.php?pk=36152&T=2

As an alternative you can also use a QR Code:  

The GUIDs for individual cells are displayed in the table below:

Multiple Linear Regression - Ordinary Least Squares
VariableParameterS.D.T-STATH0: parameter = 02-tail p-value1-tail p-value
(Intercept)117.1732261264163.15397937.150900
Machines-0.1698436534249470.03383-5.02055e-063e-06
t0.4812410962373790.03161515.221700


Multiple Linear Regression - Regression Statistics
Multiple R0.978222902425695
R-squared0.956920046830152
Adjusted R-squared0.955408469525946
F-TEST (value)633.060607729425
F-TEST (DF numerator)2
F-TEST (DF denominator)57
p-value0
Multiple Linear Regression - Residual Statistics
Residual Standard Deviation1.25524473150456
Sum Squared Residuals89.8114421502871

\begin{tabular}{lllllllll}
\hline
Multiple Linear Regression - Regression Statistics \tabularnewline
Multiple R & 0.978222902425695 \tabularnewline
R-squared & 0.956920046830152 \tabularnewline
Adjusted R-squared & 0.955408469525946 \tabularnewline
F-TEST (value) & 633.060607729425 \tabularnewline
F-TEST (DF numerator) & 2 \tabularnewline
F-TEST (DF denominator) & 57 \tabularnewline
p-value & 0 \tabularnewline
Multiple Linear Regression - Residual Statistics \tabularnewline
Residual Standard Deviation & 1.25524473150456 \tabularnewline
Sum Squared Residuals & 89.8114421502871 \tabularnewline
\hline
\end{tabular}
%Source: https://freestatistics.org/blog/index.php?pk=36152&T=3

[TABLE]
[ROW][C]Multiple Linear Regression - Regression Statistics[/C][/ROW]
[ROW][C]Multiple R[/C][C]0.978222902425695[/C][/ROW]
[ROW][C]R-squared[/C][C]0.956920046830152[/C][/ROW]
[ROW][C]Adjusted R-squared[/C][C]0.955408469525946[/C][/ROW]
[ROW][C]F-TEST (value)[/C][C]633.060607729425[/C][/ROW]
[ROW][C]F-TEST (DF numerator)[/C][C]2[/C][/ROW]
[ROW][C]F-TEST (DF denominator)[/C][C]57[/C][/ROW]
[ROW][C]p-value[/C][C]0[/C][/ROW]
[ROW][C]Multiple Linear Regression - Residual Statistics[/C][/ROW]
[ROW][C]Residual Standard Deviation[/C][C]1.25524473150456[/C][/ROW]
[ROW][C]Sum Squared Residuals[/C][C]89.8114421502871[/C][/ROW]
[/TABLE]
Source: https://freestatistics.org/blog/index.php?pk=36152&T=3

Globally Unique Identifier (entire table): ba.freestatistics.org/blog/index.php?pk=36152&T=3

As an alternative you can also use a QR Code:  

The GUIDs for individual cells are displayed in the table below:

Multiple Linear Regression - Regression Statistics
Multiple R0.978222902425695
R-squared0.956920046830152
Adjusted R-squared0.955408469525946
F-TEST (value)633.060607729425
F-TEST (DF numerator)2
F-TEST (DF denominator)57
p-value0
Multiple Linear Regression - Residual Statistics
Residual Standard Deviation1.25524473150456
Sum Squared Residuals89.8114421502871


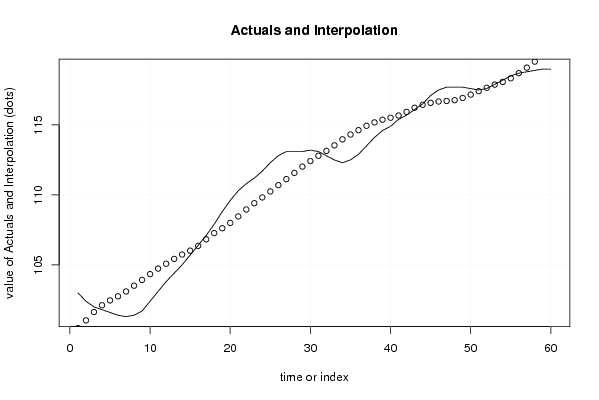
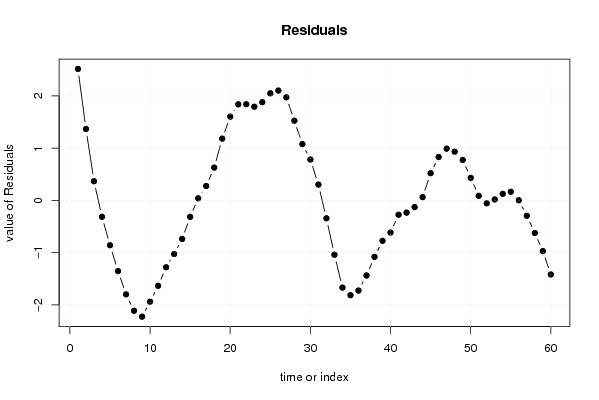
Multiple Linear Regression - Actuals, Interpolation, and Residuals
Time or IndexActualsInterpolationForecastResidualsPrediction Error
1103100.4832738613912.51672613860910
2102.4101.0324524189981.36754758100175
3102101.6325840726330.367415927366901
4101.8102.113825168870-0.313825168870486
5101.6102.459191342368-0.85919134236791
6101.4102.753604419838-1.35360441983783
7101.3103.098970593335-1.79897059333526
8101.4103.512274228203-2.11227422820266
9101.7103.92557786307-2.22557786307006
10102.4104.338881497937-1.93888149793746
11103.1104.735200767462-1.63520076746237
12103.8105.080566940960-1.28056694095979
13104.4105.425933114457-1.02593311445721
14105105.737330557270-0.737330557269643
15105.7106.014759269397-0.314759269397083
16106.4106.3601254428950.0398745571054983
17107.1106.8243821737890.275617826210601
18107.9107.2716545393420.628345460658224
19108.8107.6170207128391.18297928716079
20109.6107.9963556170221.60364438297838
21110.3108.4606123479161.8393876520835
22110.8108.9588378094961.84116219050363
23111.2109.4061101750491.79388982495124
24111.7109.8194138099161.88058619008384
25112.3110.2497018101262.05029818987394
26112.8110.6969741756782.10302582432155
27113.1111.1272621758881.97273782411165
28113.1111.5745345414411.52546545855926
29113.1112.0218069069931.07819309300687
30113.2112.4181261765180.781873823481977
31113.1112.7974610807000.302538919299557
32112.8113.142827254198-0.342827254197859
33112.5113.539146523723-1.03914652372276
34112.3113.969434523933-1.66943452393266
35112.5114.31480069743-1.81480069743008
36112.9114.626198140243-1.72619814024251
37113.5114.937595583055-1.43759558305494
38114.1115.181055564497-1.08105556449740
39114.6115.373562449912-0.773562449912372
40114.9115.515116239300-0.615116239299846
41115.4115.673654394030-0.273654394029825
42115.7115.934098740815-0.234098740814776
43116.1116.228511818285-0.128511818284721
44116.5116.4380030690420.0619969309578202
45117.1116.5795568584300.520443141570329
46117.5116.6701575517900.829842448210336
47117.7116.7098051491220.990194850877821
48117.7116.7664371117970.93356288820281
49117.7116.9249752665270.77502473347283
50117.6117.1684352479700.431564752030364
51117.5117.4118952294120.08810477058792
52117.6117.655355210855-0.0553552108545395
53117.9117.8818308269540.0181691730455138
54118.2118.0743377123690.125662287630539
55118.5118.3347820591540.16521794084559
56118.7118.6971325979940.00286740200567781
57118.8119.093451867519-0.293451867519234
58118.9119.523739867729-0.62373986772912
59119119.971012233282-0.971012233281516
60119120.418284598834-1.41828459883390

\begin{tabular}{lllllllll}
\hline
Multiple Linear Regression - Actuals, Interpolation, and Residuals \tabularnewline
Time or Index & Actuals & InterpolationForecast & ResidualsPrediction Error \tabularnewline
1 & 103 & 100.483273861391 & 2.51672613860910 \tabularnewline
2 & 102.4 & 101.032452418998 & 1.36754758100175 \tabularnewline
3 & 102 & 101.632584072633 & 0.367415927366901 \tabularnewline
4 & 101.8 & 102.113825168870 & -0.313825168870486 \tabularnewline
5 & 101.6 & 102.459191342368 & -0.85919134236791 \tabularnewline
6 & 101.4 & 102.753604419838 & -1.35360441983783 \tabularnewline
7 & 101.3 & 103.098970593335 & -1.79897059333526 \tabularnewline
8 & 101.4 & 103.512274228203 & -2.11227422820266 \tabularnewline
9 & 101.7 & 103.92557786307 & -2.22557786307006 \tabularnewline
10 & 102.4 & 104.338881497937 & -1.93888149793746 \tabularnewline
11 & 103.1 & 104.735200767462 & -1.63520076746237 \tabularnewline
12 & 103.8 & 105.080566940960 & -1.28056694095979 \tabularnewline
13 & 104.4 & 105.425933114457 & -1.02593311445721 \tabularnewline
14 & 105 & 105.737330557270 & -0.737330557269643 \tabularnewline
15 & 105.7 & 106.014759269397 & -0.314759269397083 \tabularnewline
16 & 106.4 & 106.360125442895 & 0.0398745571054983 \tabularnewline
17 & 107.1 & 106.824382173789 & 0.275617826210601 \tabularnewline
18 & 107.9 & 107.271654539342 & 0.628345460658224 \tabularnewline
19 & 108.8 & 107.617020712839 & 1.18297928716079 \tabularnewline
20 & 109.6 & 107.996355617022 & 1.60364438297838 \tabularnewline
21 & 110.3 & 108.460612347916 & 1.8393876520835 \tabularnewline
22 & 110.8 & 108.958837809496 & 1.84116219050363 \tabularnewline
23 & 111.2 & 109.406110175049 & 1.79388982495124 \tabularnewline
24 & 111.7 & 109.819413809916 & 1.88058619008384 \tabularnewline
25 & 112.3 & 110.249701810126 & 2.05029818987394 \tabularnewline
26 & 112.8 & 110.696974175678 & 2.10302582432155 \tabularnewline
27 & 113.1 & 111.127262175888 & 1.97273782411165 \tabularnewline
28 & 113.1 & 111.574534541441 & 1.52546545855926 \tabularnewline
29 & 113.1 & 112.021806906993 & 1.07819309300687 \tabularnewline
30 & 113.2 & 112.418126176518 & 0.781873823481977 \tabularnewline
31 & 113.1 & 112.797461080700 & 0.302538919299557 \tabularnewline
32 & 112.8 & 113.142827254198 & -0.342827254197859 \tabularnewline
33 & 112.5 & 113.539146523723 & -1.03914652372276 \tabularnewline
34 & 112.3 & 113.969434523933 & -1.66943452393266 \tabularnewline
35 & 112.5 & 114.31480069743 & -1.81480069743008 \tabularnewline
36 & 112.9 & 114.626198140243 & -1.72619814024251 \tabularnewline
37 & 113.5 & 114.937595583055 & -1.43759558305494 \tabularnewline
38 & 114.1 & 115.181055564497 & -1.08105556449740 \tabularnewline
39 & 114.6 & 115.373562449912 & -0.773562449912372 \tabularnewline
40 & 114.9 & 115.515116239300 & -0.615116239299846 \tabularnewline
41 & 115.4 & 115.673654394030 & -0.273654394029825 \tabularnewline
42 & 115.7 & 115.934098740815 & -0.234098740814776 \tabularnewline
43 & 116.1 & 116.228511818285 & -0.128511818284721 \tabularnewline
44 & 116.5 & 116.438003069042 & 0.0619969309578202 \tabularnewline
45 & 117.1 & 116.579556858430 & 0.520443141570329 \tabularnewline
46 & 117.5 & 116.670157551790 & 0.829842448210336 \tabularnewline
47 & 117.7 & 116.709805149122 & 0.990194850877821 \tabularnewline
48 & 117.7 & 116.766437111797 & 0.93356288820281 \tabularnewline
49 & 117.7 & 116.924975266527 & 0.77502473347283 \tabularnewline
50 & 117.6 & 117.168435247970 & 0.431564752030364 \tabularnewline
51 & 117.5 & 117.411895229412 & 0.08810477058792 \tabularnewline
52 & 117.6 & 117.655355210855 & -0.0553552108545395 \tabularnewline
53 & 117.9 & 117.881830826954 & 0.0181691730455138 \tabularnewline
54 & 118.2 & 118.074337712369 & 0.125662287630539 \tabularnewline
55 & 118.5 & 118.334782059154 & 0.16521794084559 \tabularnewline
56 & 118.7 & 118.697132597994 & 0.00286740200567781 \tabularnewline
57 & 118.8 & 119.093451867519 & -0.293451867519234 \tabularnewline
58 & 118.9 & 119.523739867729 & -0.62373986772912 \tabularnewline
59 & 119 & 119.971012233282 & -0.971012233281516 \tabularnewline
60 & 119 & 120.418284598834 & -1.41828459883390 \tabularnewline
\hline
\end{tabular}
%Source: https://freestatistics.org/blog/index.php?pk=36152&T=4

[TABLE]
[ROW][C]Multiple Linear Regression - Actuals, Interpolation, and Residuals[/C][/ROW]
[ROW][C]Time or Index[/C][C]Actuals[/C][C]InterpolationForecast[/C][C]ResidualsPrediction Error[/C][/ROW]
[ROW][C]1[/C][C]103[/C][C]100.483273861391[/C][C]2.51672613860910[/C][/ROW]
[ROW][C]2[/C][C]102.4[/C][C]101.032452418998[/C][C]1.36754758100175[/C][/ROW]
[ROW][C]3[/C][C]102[/C][C]101.632584072633[/C][C]0.367415927366901[/C][/ROW]
[ROW][C]4[/C][C]101.8[/C][C]102.113825168870[/C][C]-0.313825168870486[/C][/ROW]
[ROW][C]5[/C][C]101.6[/C][C]102.459191342368[/C][C]-0.85919134236791[/C][/ROW]
[ROW][C]6[/C][C]101.4[/C][C]102.753604419838[/C][C]-1.35360441983783[/C][/ROW]
[ROW][C]7[/C][C]101.3[/C][C]103.098970593335[/C][C]-1.79897059333526[/C][/ROW]
[ROW][C]8[/C][C]101.4[/C][C]103.512274228203[/C][C]-2.11227422820266[/C][/ROW]
[ROW][C]9[/C][C]101.7[/C][C]103.92557786307[/C][C]-2.22557786307006[/C][/ROW]
[ROW][C]10[/C][C]102.4[/C][C]104.338881497937[/C][C]-1.93888149793746[/C][/ROW]
[ROW][C]11[/C][C]103.1[/C][C]104.735200767462[/C][C]-1.63520076746237[/C][/ROW]
[ROW][C]12[/C][C]103.8[/C][C]105.080566940960[/C][C]-1.28056694095979[/C][/ROW]
[ROW][C]13[/C][C]104.4[/C][C]105.425933114457[/C][C]-1.02593311445721[/C][/ROW]
[ROW][C]14[/C][C]105[/C][C]105.737330557270[/C][C]-0.737330557269643[/C][/ROW]
[ROW][C]15[/C][C]105.7[/C][C]106.014759269397[/C][C]-0.314759269397083[/C][/ROW]
[ROW][C]16[/C][C]106.4[/C][C]106.360125442895[/C][C]0.0398745571054983[/C][/ROW]
[ROW][C]17[/C][C]107.1[/C][C]106.824382173789[/C][C]0.275617826210601[/C][/ROW]
[ROW][C]18[/C][C]107.9[/C][C]107.271654539342[/C][C]0.628345460658224[/C][/ROW]
[ROW][C]19[/C][C]108.8[/C][C]107.617020712839[/C][C]1.18297928716079[/C][/ROW]
[ROW][C]20[/C][C]109.6[/C][C]107.996355617022[/C][C]1.60364438297838[/C][/ROW]
[ROW][C]21[/C][C]110.3[/C][C]108.460612347916[/C][C]1.8393876520835[/C][/ROW]
[ROW][C]22[/C][C]110.8[/C][C]108.958837809496[/C][C]1.84116219050363[/C][/ROW]
[ROW][C]23[/C][C]111.2[/C][C]109.406110175049[/C][C]1.79388982495124[/C][/ROW]
[ROW][C]24[/C][C]111.7[/C][C]109.819413809916[/C][C]1.88058619008384[/C][/ROW]
[ROW][C]25[/C][C]112.3[/C][C]110.249701810126[/C][C]2.05029818987394[/C][/ROW]
[ROW][C]26[/C][C]112.8[/C][C]110.696974175678[/C][C]2.10302582432155[/C][/ROW]
[ROW][C]27[/C][C]113.1[/C][C]111.127262175888[/C][C]1.97273782411165[/C][/ROW]
[ROW][C]28[/C][C]113.1[/C][C]111.574534541441[/C][C]1.52546545855926[/C][/ROW]
[ROW][C]29[/C][C]113.1[/C][C]112.021806906993[/C][C]1.07819309300687[/C][/ROW]
[ROW][C]30[/C][C]113.2[/C][C]112.418126176518[/C][C]0.781873823481977[/C][/ROW]
[ROW][C]31[/C][C]113.1[/C][C]112.797461080700[/C][C]0.302538919299557[/C][/ROW]
[ROW][C]32[/C][C]112.8[/C][C]113.142827254198[/C][C]-0.342827254197859[/C][/ROW]
[ROW][C]33[/C][C]112.5[/C][C]113.539146523723[/C][C]-1.03914652372276[/C][/ROW]
[ROW][C]34[/C][C]112.3[/C][C]113.969434523933[/C][C]-1.66943452393266[/C][/ROW]
[ROW][C]35[/C][C]112.5[/C][C]114.31480069743[/C][C]-1.81480069743008[/C][/ROW]
[ROW][C]36[/C][C]112.9[/C][C]114.626198140243[/C][C]-1.72619814024251[/C][/ROW]
[ROW][C]37[/C][C]113.5[/C][C]114.937595583055[/C][C]-1.43759558305494[/C][/ROW]
[ROW][C]38[/C][C]114.1[/C][C]115.181055564497[/C][C]-1.08105556449740[/C][/ROW]
[ROW][C]39[/C][C]114.6[/C][C]115.373562449912[/C][C]-0.773562449912372[/C][/ROW]
[ROW][C]40[/C][C]114.9[/C][C]115.515116239300[/C][C]-0.615116239299846[/C][/ROW]
[ROW][C]41[/C][C]115.4[/C][C]115.673654394030[/C][C]-0.273654394029825[/C][/ROW]
[ROW][C]42[/C][C]115.7[/C][C]115.934098740815[/C][C]-0.234098740814776[/C][/ROW]
[ROW][C]43[/C][C]116.1[/C][C]116.228511818285[/C][C]-0.128511818284721[/C][/ROW]
[ROW][C]44[/C][C]116.5[/C][C]116.438003069042[/C][C]0.0619969309578202[/C][/ROW]
[ROW][C]45[/C][C]117.1[/C][C]116.579556858430[/C][C]0.520443141570329[/C][/ROW]
[ROW][C]46[/C][C]117.5[/C][C]116.670157551790[/C][C]0.829842448210336[/C][/ROW]
[ROW][C]47[/C][C]117.7[/C][C]116.709805149122[/C][C]0.990194850877821[/C][/ROW]
[ROW][C]48[/C][C]117.7[/C][C]116.766437111797[/C][C]0.93356288820281[/C][/ROW]
[ROW][C]49[/C][C]117.7[/C][C]116.924975266527[/C][C]0.77502473347283[/C][/ROW]
[ROW][C]50[/C][C]117.6[/C][C]117.168435247970[/C][C]0.431564752030364[/C][/ROW]
[ROW][C]51[/C][C]117.5[/C][C]117.411895229412[/C][C]0.08810477058792[/C][/ROW]
[ROW][C]52[/C][C]117.6[/C][C]117.655355210855[/C][C]-0.0553552108545395[/C][/ROW]
[ROW][C]53[/C][C]117.9[/C][C]117.881830826954[/C][C]0.0181691730455138[/C][/ROW]
[ROW][C]54[/C][C]118.2[/C][C]118.074337712369[/C][C]0.125662287630539[/C][/ROW]
[ROW][C]55[/C][C]118.5[/C][C]118.334782059154[/C][C]0.16521794084559[/C][/ROW]
[ROW][C]56[/C][C]118.7[/C][C]118.697132597994[/C][C]0.00286740200567781[/C][/ROW]
[ROW][C]57[/C][C]118.8[/C][C]119.093451867519[/C][C]-0.293451867519234[/C][/ROW]
[ROW][C]58[/C][C]118.9[/C][C]119.523739867729[/C][C]-0.62373986772912[/C][/ROW]
[ROW][C]59[/C][C]119[/C][C]119.971012233282[/C][C]-0.971012233281516[/C][/ROW]
[ROW][C]60[/C][C]119[/C][C]120.418284598834[/C][C]-1.41828459883390[/C][/ROW]
[/TABLE]
Source: https://freestatistics.org/blog/index.php?pk=36152&T=4

Globally Unique Identifier (entire table): ba.freestatistics.org/blog/index.php?pk=36152&T=4

As an alternative you can also use a QR Code:  

The GUIDs for individual cells are displayed in the table below:

Multiple Linear Regression - Actuals, Interpolation, and Residuals
Time or IndexActualsInterpolationForecastResidualsPrediction Error
1103100.4832738613912.51672613860910
2102.4101.0324524189981.36754758100175
3102101.6325840726330.367415927366901
4101.8102.113825168870-0.313825168870486
5101.6102.459191342368-0.85919134236791
6101.4102.753604419838-1.35360441983783
7101.3103.098970593335-1.79897059333526
8101.4103.512274228203-2.11227422820266
9101.7103.92557786307-2.22557786307006
10102.4104.338881497937-1.93888149793746
11103.1104.735200767462-1.63520076746237
12103.8105.080566940960-1.28056694095979
13104.4105.425933114457-1.02593311445721
14105105.737330557270-0.737330557269643
15105.7106.014759269397-0.314759269397083
16106.4106.3601254428950.0398745571054983
17107.1106.8243821737890.275617826210601
18107.9107.2716545393420.628345460658224
19108.8107.6170207128391.18297928716079
20109.6107.9963556170221.60364438297838
21110.3108.4606123479161.8393876520835
22110.8108.9588378094961.84116219050363
23111.2109.4061101750491.79388982495124
24111.7109.8194138099161.88058619008384
25112.3110.2497018101262.05029818987394
26112.8110.6969741756782.10302582432155
27113.1111.1272621758881.97273782411165
28113.1111.5745345414411.52546545855926
29113.1112.0218069069931.07819309300687
30113.2112.4181261765180.781873823481977
31113.1112.7974610807000.302538919299557
32112.8113.142827254198-0.342827254197859
33112.5113.539146523723-1.03914652372276
34112.3113.969434523933-1.66943452393266
35112.5114.31480069743-1.81480069743008
36112.9114.626198140243-1.72619814024251
37113.5114.937595583055-1.43759558305494
38114.1115.181055564497-1.08105556449740
39114.6115.373562449912-0.773562449912372
40114.9115.515116239300-0.615116239299846
41115.4115.673654394030-0.273654394029825
42115.7115.934098740815-0.234098740814776
43116.1116.228511818285-0.128511818284721
44116.5116.4380030690420.0619969309578202
45117.1116.5795568584300.520443141570329
46117.5116.6701575517900.829842448210336
47117.7116.7098051491220.990194850877821
48117.7116.7664371117970.93356288820281
49117.7116.9249752665270.77502473347283
50117.6117.1684352479700.431564752030364
51117.5117.4118952294120.08810477058792
52117.6117.655355210855-0.0553552108545395
53117.9117.8818308269540.0181691730455138
54118.2118.0743377123690.125662287630539
55118.5118.3347820591540.16521794084559
56118.7118.6971325979940.00286740200567781
57118.8119.093451867519-0.293451867519234
58118.9119.523739867729-0.62373986772912
59119119.971012233282-0.971012233281516
60119120.418284598834-1.41828459883390


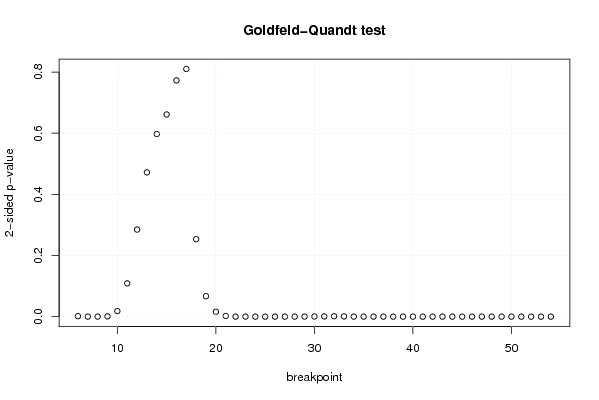
Goldfeld-Quandt test for Heteroskedasticity
p-valuesAlternative Hypothesis
breakpoint indexgreater2-sidedless
60.0007919553851311380.001583910770262280.999208044614869
75.92443941399347e-050.0001184887882798690.99994075560586
86.94457919729656e-050.0001388915839459310.999930554208027
90.0005001056603264290.001000211320652860.999499894339674
100.009102768959323440.01820553791864690.990897231040677
110.05447441899053960.1089488379810790.94552558100946
120.1424355564129790.2848711128259580.857564443587021
130.2359382219637520.4718764439275030.764061778036248
140.2987263491031310.5974526982062620.701273650896869
150.3307271297379590.6614542594759190.66927287026204
160.3863972362834680.7727944725669360.613602763716532
170.5948462523801780.8103074952396430.405153747619822
180.873278175643970.2534436487120590.126721824356029
190.9665937385864450.06681252282711030.0334062614135551
200.9919353109694330.01612937806113450.00806468903056726
210.9988852972626530.002229405474694830.00111470273734742
220.9998746851178920.0002506297642152830.000125314882107642
230.9999689375105786.21249788447151e-053.10624894223575e-05
240.9999826398788723.47202422565339e-051.73601211282669e-05
250.9999819279258653.61441482704791e-051.80720741352395e-05
260.9999732103630935.357927381512e-052.678963690756e-05
270.9999538528079579.22943840860695e-054.61471920430347e-05
280.9999095100879330.0001809798241346429.04899120673208e-05
290.999826931473340.0003461370533207980.000173068526660399
300.9997070731659050.00058585366818930.00029292683409465
310.9995258872137140.0009482255725714170.000474112786285708
320.9994022452522930.001195509495414010.000597754747707003
330.9996024588148620.0007950823702751890.000397541185137594
340.9998965807504220.0002068384991551090.000103419249577555
350.9999855438683872.89122632262049e-051.44561316131025e-05
360.9999985627927832.87441443481216e-061.43720721740608e-06
370.99999972042575.59148599762295e-072.79574299881148e-07
380.999999880390732.39218541045185e-071.19609270522593e-07
390.9999999154689641.69062071741215e-078.45310358706073e-08
400.9999999629204727.41590551243336e-083.70795275621668e-08
410.9999999698830576.02338856723597e-083.01169428361798e-08
420.999999982688193.46236207927009e-081.73118103963504e-08
430.9999999892767162.14465687918203e-081.07232843959102e-08
440.9999999946531921.06936168358571e-085.34680841792854e-09
450.9999999798418974.03162054839925e-082.01581027419963e-08
460.9999998693657532.61268494856938e-071.30634247428469e-07
470.9999996452348967.09530208072671e-073.54765104036336e-07
480.9999995928087558.14382490774342e-074.07191245387171e-07
490.9999998982320142.03535972924754e-071.01767986462377e-07
500.999999997312915.37418169393698e-092.68709084696849e-09
510.9999999993667221.26655543400117e-096.33277717000587e-10
520.9999999768722824.62554367379689e-082.31277183689844e-08
530.9999997022393755.95521250052183e-072.97760625026091e-07
540.9999845921773643.08156452716122e-051.54078226358061e-05

\begin{tabular}{lllllllll}
\hline
Goldfeld-Quandt test for Heteroskedasticity \tabularnewline
p-values & Alternative Hypothesis \tabularnewline
breakpoint index & greater & 2-sided & less \tabularnewline
6 & 0.000791955385131138 & 0.00158391077026228 & 0.999208044614869 \tabularnewline
7 & 5.92443941399347e-05 & 0.000118488788279869 & 0.99994075560586 \tabularnewline
8 & 6.94457919729656e-05 & 0.000138891583945931 & 0.999930554208027 \tabularnewline
9 & 0.000500105660326429 & 0.00100021132065286 & 0.999499894339674 \tabularnewline
10 & 0.00910276895932344 & 0.0182055379186469 & 0.990897231040677 \tabularnewline
11 & 0.0544744189905396 & 0.108948837981079 & 0.94552558100946 \tabularnewline
12 & 0.142435556412979 & 0.284871112825958 & 0.857564443587021 \tabularnewline
13 & 0.235938221963752 & 0.471876443927503 & 0.764061778036248 \tabularnewline
14 & 0.298726349103131 & 0.597452698206262 & 0.701273650896869 \tabularnewline
15 & 0.330727129737959 & 0.661454259475919 & 0.66927287026204 \tabularnewline
16 & 0.386397236283468 & 0.772794472566936 & 0.613602763716532 \tabularnewline
17 & 0.594846252380178 & 0.810307495239643 & 0.405153747619822 \tabularnewline
18 & 0.87327817564397 & 0.253443648712059 & 0.126721824356029 \tabularnewline
19 & 0.966593738586445 & 0.0668125228271103 & 0.0334062614135551 \tabularnewline
20 & 0.991935310969433 & 0.0161293780611345 & 0.00806468903056726 \tabularnewline
21 & 0.998885297262653 & 0.00222940547469483 & 0.00111470273734742 \tabularnewline
22 & 0.999874685117892 & 0.000250629764215283 & 0.000125314882107642 \tabularnewline
23 & 0.999968937510578 & 6.21249788447151e-05 & 3.10624894223575e-05 \tabularnewline
24 & 0.999982639878872 & 3.47202422565339e-05 & 1.73601211282669e-05 \tabularnewline
25 & 0.999981927925865 & 3.61441482704791e-05 & 1.80720741352395e-05 \tabularnewline
26 & 0.999973210363093 & 5.357927381512e-05 & 2.678963690756e-05 \tabularnewline
27 & 0.999953852807957 & 9.22943840860695e-05 & 4.61471920430347e-05 \tabularnewline
28 & 0.999909510087933 & 0.000180979824134642 & 9.04899120673208e-05 \tabularnewline
29 & 0.99982693147334 & 0.000346137053320798 & 0.000173068526660399 \tabularnewline
30 & 0.999707073165905 & 0.0005858536681893 & 0.00029292683409465 \tabularnewline
31 & 0.999525887213714 & 0.000948225572571417 & 0.000474112786285708 \tabularnewline
32 & 0.999402245252293 & 0.00119550949541401 & 0.000597754747707003 \tabularnewline
33 & 0.999602458814862 & 0.000795082370275189 & 0.000397541185137594 \tabularnewline
34 & 0.999896580750422 & 0.000206838499155109 & 0.000103419249577555 \tabularnewline
35 & 0.999985543868387 & 2.89122632262049e-05 & 1.44561316131025e-05 \tabularnewline
36 & 0.999998562792783 & 2.87441443481216e-06 & 1.43720721740608e-06 \tabularnewline
37 & 0.9999997204257 & 5.59148599762295e-07 & 2.79574299881148e-07 \tabularnewline
38 & 0.99999988039073 & 2.39218541045185e-07 & 1.19609270522593e-07 \tabularnewline
39 & 0.999999915468964 & 1.69062071741215e-07 & 8.45310358706073e-08 \tabularnewline
40 & 0.999999962920472 & 7.41590551243336e-08 & 3.70795275621668e-08 \tabularnewline
41 & 0.999999969883057 & 6.02338856723597e-08 & 3.01169428361798e-08 \tabularnewline
42 & 0.99999998268819 & 3.46236207927009e-08 & 1.73118103963504e-08 \tabularnewline
43 & 0.999999989276716 & 2.14465687918203e-08 & 1.07232843959102e-08 \tabularnewline
44 & 0.999999994653192 & 1.06936168358571e-08 & 5.34680841792854e-09 \tabularnewline
45 & 0.999999979841897 & 4.03162054839925e-08 & 2.01581027419963e-08 \tabularnewline
46 & 0.999999869365753 & 2.61268494856938e-07 & 1.30634247428469e-07 \tabularnewline
47 & 0.999999645234896 & 7.09530208072671e-07 & 3.54765104036336e-07 \tabularnewline
48 & 0.999999592808755 & 8.14382490774342e-07 & 4.07191245387171e-07 \tabularnewline
49 & 0.999999898232014 & 2.03535972924754e-07 & 1.01767986462377e-07 \tabularnewline
50 & 0.99999999731291 & 5.37418169393698e-09 & 2.68709084696849e-09 \tabularnewline
51 & 0.999999999366722 & 1.26655543400117e-09 & 6.33277717000587e-10 \tabularnewline
52 & 0.999999976872282 & 4.62554367379689e-08 & 2.31277183689844e-08 \tabularnewline
53 & 0.999999702239375 & 5.95521250052183e-07 & 2.97760625026091e-07 \tabularnewline
54 & 0.999984592177364 & 3.08156452716122e-05 & 1.54078226358061e-05 \tabularnewline
\hline
\end{tabular}
%Source: https://freestatistics.org/blog/index.php?pk=36152&T=5

[TABLE]
[ROW][C]Goldfeld-Quandt test for Heteroskedasticity[/C][/ROW]
[ROW][C]p-values[/C][C]Alternative Hypothesis[/C][/ROW]
[ROW][C]breakpoint index[/C][C]greater[/C][C]2-sided[/C][C]less[/C][/ROW]
[ROW][C]6[/C][C]0.000791955385131138[/C][C]0.00158391077026228[/C][C]0.999208044614869[/C][/ROW]
[ROW][C]7[/C][C]5.92443941399347e-05[/C][C]0.000118488788279869[/C][C]0.99994075560586[/C][/ROW]
[ROW][C]8[/C][C]6.94457919729656e-05[/C][C]0.000138891583945931[/C][C]0.999930554208027[/C][/ROW]
[ROW][C]9[/C][C]0.000500105660326429[/C][C]0.00100021132065286[/C][C]0.999499894339674[/C][/ROW]
[ROW][C]10[/C][C]0.00910276895932344[/C][C]0.0182055379186469[/C][C]0.990897231040677[/C][/ROW]
[ROW][C]11[/C][C]0.0544744189905396[/C][C]0.108948837981079[/C][C]0.94552558100946[/C][/ROW]
[ROW][C]12[/C][C]0.142435556412979[/C][C]0.284871112825958[/C][C]0.857564443587021[/C][/ROW]
[ROW][C]13[/C][C]0.235938221963752[/C][C]0.471876443927503[/C][C]0.764061778036248[/C][/ROW]
[ROW][C]14[/C][C]0.298726349103131[/C][C]0.597452698206262[/C][C]0.701273650896869[/C][/ROW]
[ROW][C]15[/C][C]0.330727129737959[/C][C]0.661454259475919[/C][C]0.66927287026204[/C][/ROW]
[ROW][C]16[/C][C]0.386397236283468[/C][C]0.772794472566936[/C][C]0.613602763716532[/C][/ROW]
[ROW][C]17[/C][C]0.594846252380178[/C][C]0.810307495239643[/C][C]0.405153747619822[/C][/ROW]
[ROW][C]18[/C][C]0.87327817564397[/C][C]0.253443648712059[/C][C]0.126721824356029[/C][/ROW]
[ROW][C]19[/C][C]0.966593738586445[/C][C]0.0668125228271103[/C][C]0.0334062614135551[/C][/ROW]
[ROW][C]20[/C][C]0.991935310969433[/C][C]0.0161293780611345[/C][C]0.00806468903056726[/C][/ROW]
[ROW][C]21[/C][C]0.998885297262653[/C][C]0.00222940547469483[/C][C]0.00111470273734742[/C][/ROW]
[ROW][C]22[/C][C]0.999874685117892[/C][C]0.000250629764215283[/C][C]0.000125314882107642[/C][/ROW]
[ROW][C]23[/C][C]0.999968937510578[/C][C]6.21249788447151e-05[/C][C]3.10624894223575e-05[/C][/ROW]
[ROW][C]24[/C][C]0.999982639878872[/C][C]3.47202422565339e-05[/C][C]1.73601211282669e-05[/C][/ROW]
[ROW][C]25[/C][C]0.999981927925865[/C][C]3.61441482704791e-05[/C][C]1.80720741352395e-05[/C][/ROW]
[ROW][C]26[/C][C]0.999973210363093[/C][C]5.357927381512e-05[/C][C]2.678963690756e-05[/C][/ROW]
[ROW][C]27[/C][C]0.999953852807957[/C][C]9.22943840860695e-05[/C][C]4.61471920430347e-05[/C][/ROW]
[ROW][C]28[/C][C]0.999909510087933[/C][C]0.000180979824134642[/C][C]9.04899120673208e-05[/C][/ROW]
[ROW][C]29[/C][C]0.99982693147334[/C][C]0.000346137053320798[/C][C]0.000173068526660399[/C][/ROW]
[ROW][C]30[/C][C]0.999707073165905[/C][C]0.0005858536681893[/C][C]0.00029292683409465[/C][/ROW]
[ROW][C]31[/C][C]0.999525887213714[/C][C]0.000948225572571417[/C][C]0.000474112786285708[/C][/ROW]
[ROW][C]32[/C][C]0.999402245252293[/C][C]0.00119550949541401[/C][C]0.000597754747707003[/C][/ROW]
[ROW][C]33[/C][C]0.999602458814862[/C][C]0.000795082370275189[/C][C]0.000397541185137594[/C][/ROW]
[ROW][C]34[/C][C]0.999896580750422[/C][C]0.000206838499155109[/C][C]0.000103419249577555[/C][/ROW]
[ROW][C]35[/C][C]0.999985543868387[/C][C]2.89122632262049e-05[/C][C]1.44561316131025e-05[/C][/ROW]
[ROW][C]36[/C][C]0.999998562792783[/C][C]2.87441443481216e-06[/C][C]1.43720721740608e-06[/C][/ROW]
[ROW][C]37[/C][C]0.9999997204257[/C][C]5.59148599762295e-07[/C][C]2.79574299881148e-07[/C][/ROW]
[ROW][C]38[/C][C]0.99999988039073[/C][C]2.39218541045185e-07[/C][C]1.19609270522593e-07[/C][/ROW]
[ROW][C]39[/C][C]0.999999915468964[/C][C]1.69062071741215e-07[/C][C]8.45310358706073e-08[/C][/ROW]
[ROW][C]40[/C][C]0.999999962920472[/C][C]7.41590551243336e-08[/C][C]3.70795275621668e-08[/C][/ROW]
[ROW][C]41[/C][C]0.999999969883057[/C][C]6.02338856723597e-08[/C][C]3.01169428361798e-08[/C][/ROW]
[ROW][C]42[/C][C]0.99999998268819[/C][C]3.46236207927009e-08[/C][C]1.73118103963504e-08[/C][/ROW]
[ROW][C]43[/C][C]0.999999989276716[/C][C]2.14465687918203e-08[/C][C]1.07232843959102e-08[/C][/ROW]
[ROW][C]44[/C][C]0.999999994653192[/C][C]1.06936168358571e-08[/C][C]5.34680841792854e-09[/C][/ROW]
[ROW][C]45[/C][C]0.999999979841897[/C][C]4.03162054839925e-08[/C][C]2.01581027419963e-08[/C][/ROW]
[ROW][C]46[/C][C]0.999999869365753[/C][C]2.61268494856938e-07[/C][C]1.30634247428469e-07[/C][/ROW]
[ROW][C]47[/C][C]0.999999645234896[/C][C]7.09530208072671e-07[/C][C]3.54765104036336e-07[/C][/ROW]
[ROW][C]48[/C][C]0.999999592808755[/C][C]8.14382490774342e-07[/C][C]4.07191245387171e-07[/C][/ROW]
[ROW][C]49[/C][C]0.999999898232014[/C][C]2.03535972924754e-07[/C][C]1.01767986462377e-07[/C][/ROW]
[ROW][C]50[/C][C]0.99999999731291[/C][C]5.37418169393698e-09[/C][C]2.68709084696849e-09[/C][/ROW]
[ROW][C]51[/C][C]0.999999999366722[/C][C]1.26655543400117e-09[/C][C]6.33277717000587e-10[/C][/ROW]
[ROW][C]52[/C][C]0.999999976872282[/C][C]4.62554367379689e-08[/C][C]2.31277183689844e-08[/C][/ROW]
[ROW][C]53[/C][C]0.999999702239375[/C][C]5.95521250052183e-07[/C][C]2.97760625026091e-07[/C][/ROW]
[ROW][C]54[/C][C]0.999984592177364[/C][C]3.08156452716122e-05[/C][C]1.54078226358061e-05[/C][/ROW]
[/TABLE]
Source: https://freestatistics.org/blog/index.php?pk=36152&T=5

Globally Unique Identifier (entire table): ba.freestatistics.org/blog/index.php?pk=36152&T=5

As an alternative you can also use a QR Code:  

The GUIDs for individual cells are displayed in the table below:

Goldfeld-Quandt test for Heteroskedasticity
p-valuesAlternative Hypothesis
breakpoint indexgreater2-sidedless
60.0007919553851311380.001583910770262280.999208044614869
75.92443941399347e-050.0001184887882798690.99994075560586
86.94457919729656e-050.0001388915839459310.999930554208027
90.0005001056603264290.001000211320652860.999499894339674
100.009102768959323440.01820553791864690.990897231040677
110.05447441899053960.1089488379810790.94552558100946
120.1424355564129790.2848711128259580.857564443587021
130.2359382219637520.4718764439275030.764061778036248
140.2987263491031310.5974526982062620.701273650896869
150.3307271297379590.6614542594759190.66927287026204
160.3863972362834680.7727944725669360.613602763716532
170.5948462523801780.8103074952396430.405153747619822
180.873278175643970.2534436487120590.126721824356029
190.9665937385864450.06681252282711030.0334062614135551
200.9919353109694330.01612937806113450.00806468903056726
210.9988852972626530.002229405474694830.00111470273734742
220.9998746851178920.0002506297642152830.000125314882107642
230.9999689375105786.21249788447151e-053.10624894223575e-05
240.9999826398788723.47202422565339e-051.73601211282669e-05
250.9999819279258653.61441482704791e-051.80720741352395e-05
260.9999732103630935.357927381512e-052.678963690756e-05
270.9999538528079579.22943840860695e-054.61471920430347e-05
280.9999095100879330.0001809798241346429.04899120673208e-05
290.999826931473340.0003461370533207980.000173068526660399
300.9997070731659050.00058585366818930.00029292683409465
310.9995258872137140.0009482255725714170.000474112786285708
320.9994022452522930.001195509495414010.000597754747707003
330.9996024588148620.0007950823702751890.000397541185137594
340.9998965807504220.0002068384991551090.000103419249577555
350.9999855438683872.89122632262049e-051.44561316131025e-05
360.9999985627927832.87441443481216e-061.43720721740608e-06
370.99999972042575.59148599762295e-072.79574299881148e-07
380.999999880390732.39218541045185e-071.19609270522593e-07
390.9999999154689641.69062071741215e-078.45310358706073e-08
400.9999999629204727.41590551243336e-083.70795275621668e-08
410.9999999698830576.02338856723597e-083.01169428361798e-08
420.999999982688193.46236207927009e-081.73118103963504e-08
430.9999999892767162.14465687918203e-081.07232843959102e-08
440.9999999946531921.06936168358571e-085.34680841792854e-09
450.9999999798418974.03162054839925e-082.01581027419963e-08
460.9999998693657532.61268494856938e-071.30634247428469e-07
470.9999996452348967.09530208072671e-073.54765104036336e-07
480.9999995928087558.14382490774342e-074.07191245387171e-07
490.9999998982320142.03535972924754e-071.01767986462377e-07
500.999999997312915.37418169393698e-092.68709084696849e-09
510.9999999993667221.26655543400117e-096.33277717000587e-10
520.9999999768722824.62554367379689e-082.31277183689844e-08
530.9999997022393755.95521250052183e-072.97760625026091e-07
540.9999845921773643.08156452716122e-051.54078226358061e-05


Meta Analysis of Goldfeld-Quandt test for Heteroskedasticity
Description# significant tests% significant testsOK/NOK
1% type I error level380.775510204081633NOK
5% type I error level400.816326530612245NOK
10% type I error level410.836734693877551NOK

\begin{tabular}{lllllllll}
\hline
Meta Analysis of Goldfeld-Quandt test for Heteroskedasticity \tabularnewline
Description & # significant tests & % significant tests & OK/NOK \tabularnewline
1% type I error level & 38 & 0.775510204081633 & NOK \tabularnewline
5% type I error level & 40 & 0.816326530612245 & NOK \tabularnewline
10% type I error level & 41 & 0.836734693877551 & NOK \tabularnewline
\hline
\end{tabular}
%Source: https://freestatistics.org/blog/index.php?pk=36152&T=6

[TABLE]
[ROW][C]Meta Analysis of Goldfeld-Quandt test for Heteroskedasticity[/C][/ROW]
[ROW][C]Description[/C][C]# significant tests[/C][C]% significant tests[/C][C]OK/NOK[/C][/ROW]
[ROW][C]1% type I error level[/C][C]38[/C][C]0.775510204081633[/C][C]NOK[/C][/ROW]
[ROW][C]5% type I error level[/C][C]40[/C][C]0.816326530612245[/C][C]NOK[/C][/ROW]
[ROW][C]10% type I error level[/C][C]41[/C][C]0.836734693877551[/C][C]NOK[/C][/ROW]
[/TABLE]
Source: https://freestatistics.org/blog/index.php?pk=36152&T=6

Globally Unique Identifier (entire table): ba.freestatistics.org/blog/index.php?pk=36152&T=6

As an alternative you can also use a QR Code:  

The GUIDs for individual cells are displayed in the table below:

Meta Analysis of Goldfeld-Quandt test for Heteroskedasticity
Description# significant tests% significant testsOK/NOK
1% type I error level380.775510204081633NOK
5% type I error level400.816326530612245NOK
10% type I error level410.836734693877551NOK


Parameters (Session):
par1 = 12 ;
Parameters (R input):
par1 = 2 ; par2 = Do not include Seasonal Dummies ; par3 = Linear Trend ;
R code (references can be found in the software module):
library(lattice)
library(lmtest)
n25 <- 25 #minimum number of obs. for Goldfeld-Quandt test
par1 <- as.numeric(par1)
x <- t(y)
k <- length(x[1,])
n <- length(x[,1])
x1 <- cbind(x[,par1], x[,1:k!=par1])
mycolnames <- c(colnames(x)[par1], colnames(x)[1:k!=par1])
colnames(x1) <- mycolnames #colnames(x)[par1]
x <- x1
if (par3 == 'First Differences'){
x2 <- array(0, dim=c(n-1,k), dimnames=list(1:(n-1), paste('(1-B)',colnames(x),sep='')))
for (i in 1:n-1) {
for (j in 1:k) {
x2[i,j] <- x[i+1,j] - x[i,j]
}
}
x <- x2
}
if (par2 == 'Include Monthly Dummies'){
x2 <- array(0, dim=c(n,11), dimnames=list(1:n, paste('M', seq(1:11), sep ='')))
for (i in 1:11){
x2[seq(i,n,12),i] <- 1
}
x <- cbind(x, x2)
}
if (par2 == 'Include Quarterly Dummies'){
x2 <- array(0, dim=c(n,3), dimnames=list(1:n, paste('Q', seq(1:3), sep ='')))
for (i in 1:3){
x2[seq(i,n,4),i] <- 1
}
x <- cbind(x, x2)
}
k <- length(x[1,])
if (par3 == 'Linear Trend'){
x <- cbind(x, c(1:n))
colnames(x)[k+1] <- 't'
}
x
k <- length(x[1,])
df <- as.data.frame(x)
(mylm <- lm(df))
(mysum <- summary(mylm))
if (n > n25) {
kp3 <- k + 3
nmkm3 <- n - k - 3
gqarr <- array(NA, dim=c(nmkm3-kp3+1,3))
numgqtests <- 0
numsignificant1 <- 0
numsignificant5 <- 0
numsignificant10 <- 0
for (mypoint in kp3:nmkm3) {
j <- 0
numgqtests <- numgqtests + 1
for (myalt in c('greater', 'two.sided', 'less')) {
j <- j + 1
gqarr[mypoint-kp3+1,j] <- gqtest(mylm, point=mypoint, alternative=myalt)$p.value
}
if (gqarr[mypoint-kp3+1,2] < 0.01) numsignificant1 <- numsignificant1 + 1
if (gqarr[mypoint-kp3+1,2] < 0.05) numsignificant5 <- numsignificant5 + 1
if (gqarr[mypoint-kp3+1,2] < 0.10) numsignificant10 <- numsignificant10 + 1
}
gqarr
}
bitmap(file='test0.png')
plot(x[,1], type='l', main='Actuals and Interpolation', ylab='value of Actuals and Interpolation (dots)', xlab='time or index')
points(x[,1]-mysum$resid)
grid()
dev.off()
bitmap(file='test1.png')
plot(mysum$resid, type='b', pch=19, main='Residuals', ylab='value of Residuals', xlab='time or index')
grid()
dev.off()
bitmap(file='test2.png')
hist(mysum$resid, main='Residual Histogram', xlab='values of Residuals')
grid()
dev.off()
bitmap(file='test3.png')
densityplot(~mysum$resid,col='black',main='Residual Density Plot', xlab='values of Residuals')
dev.off()
bitmap(file='test4.png')
qqnorm(mysum$resid, main='Residual Normal Q-Q Plot')
qqline(mysum$resid)
grid()
dev.off()
(myerror <- as.ts(mysum$resid))
bitmap(file='test5.png')
dum <- cbind(lag(myerror,k=1),myerror)
dum
dum1 <- dum[2:length(myerror),]
dum1
z <- as.data.frame(dum1)
z
plot(z,main=paste('Residual Lag plot, lowess, and regression line'), ylab='values of Residuals', xlab='lagged values of Residuals')
lines(lowess(z))
abline(lm(z))
grid()
dev.off()
bitmap(file='test6.png')
acf(mysum$resid, lag.max=length(mysum$resid)/2, main='Residual Autocorrelation Function')
grid()
dev.off()
bitmap(file='test7.png')
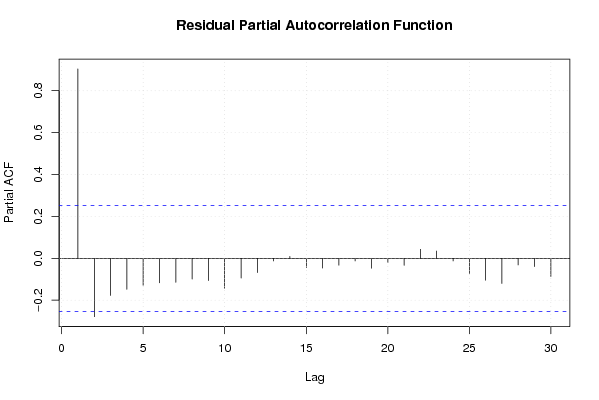
pacf(mysum$resid, lag.max=length(mysum$resid)/2, main='Residual Partial Autocorrelation Function')
grid()
dev.off()
bitmap(file='test8.png')
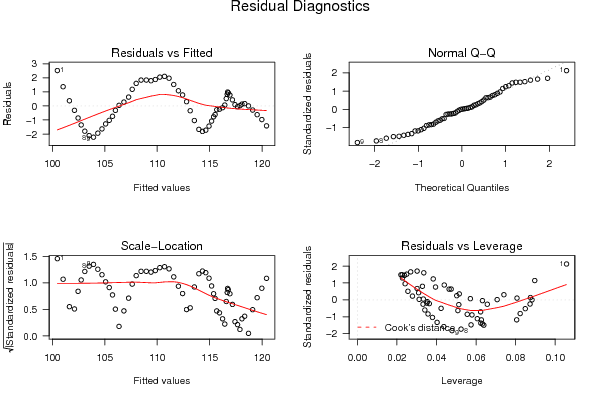
opar <- par(mfrow = c(2,2), oma = c(0, 0, 1.1, 0))
plot(mylm, las = 1, sub='Residual Diagnostics')
par(opar)
dev.off()
if (n > n25) {
bitmap(file='test9.png')
plot(kp3:nmkm3,gqarr[,2], main='Goldfeld-Quandt test',ylab='2-sided p-value',xlab='breakpoint')
grid()
dev.off()
}
load(file='createtable')
a<-table.start()
a<-table.row.start(a)
a<-table.element(a, 'Multiple Linear Regression - Estimated Regression Equation', 1, TRUE)
a<-table.row.end(a)
myeq <- colnames(x)[1]
myeq <- paste(myeq, '[t] = ', sep='')
for (i in 1:k){
if (mysum$coefficients[i,1] > 0) myeq <- paste(myeq, '+', '')
myeq <- paste(myeq, mysum$coefficients[i,1], sep=' ')
if (rownames(mysum$coefficients)[i] != '(Intercept)') {
myeq <- paste(myeq, rownames(mysum$coefficients)[i], sep='')
if (rownames(mysum$coefficients)[i] != 't') myeq <- paste(myeq, '[t]', sep='')
}
}
myeq <- paste(myeq, ' + e[t]')
a<-table.row.start(a)
a<-table.element(a, myeq)
a<-table.row.end(a)
a<-table.end(a)
table.save(a,file='mytable1.tab')
a<-table.start()
a<-table.row.start(a)
a<-table.element(a,hyperlink('ols1.htm','Multiple Linear Regression - Ordinary Least Squares',''), 6, TRUE)
a<-table.row.end(a)
a<-table.row.start(a)
a<-table.element(a,'Variable',header=TRUE)
a<-table.element(a,'Parameter',header=TRUE)
a<-table.element(a,'S.D.',header=TRUE)
a<-table.element(a,'T-STAT
H0: parameter = 0',header=TRUE)
a<-table.element(a,'2-tail p-value',header=TRUE)
a<-table.element(a,'1-tail p-value',header=TRUE)
a<-table.row.end(a)
for (i in 1:k){
a<-table.row.start(a)
a<-table.element(a,rownames(mysum$coefficients)[i],header=TRUE)
a<-table.element(a,mysum$coefficients[i,1])
a<-table.element(a, round(mysum$coefficients[i,2],6))
a<-table.element(a, round(mysum$coefficients[i,3],4))
a<-table.element(a, round(mysum$coefficients[i,4],6))
a<-table.element(a, round(mysum$coefficients[i,4]/2,6))
a<-table.row.end(a)
}
a<-table.end(a)
table.save(a,file='mytable2.tab')
a<-table.start()
a<-table.row.start(a)
a<-table.element(a, 'Multiple Linear Regression - Regression Statistics', 2, TRUE)
a<-table.row.end(a)
a<-table.row.start(a)
a<-table.element(a, 'Multiple R',1,TRUE)
a<-table.element(a, sqrt(mysum$r.squared))
a<-table.row.end(a)
a<-table.row.start(a)
a<-table.element(a, 'R-squared',1,TRUE)
a<-table.element(a, mysum$r.squared)
a<-table.row.end(a)
a<-table.row.start(a)
a<-table.element(a, 'Adjusted R-squared',1,TRUE)
a<-table.element(a, mysum$adj.r.squared)
a<-table.row.end(a)
a<-table.row.start(a)
a<-table.element(a, 'F-TEST (value)',1,TRUE)
a<-table.element(a, mysum$fstatistic[1])
a<-table.row.end(a)
a<-table.row.start(a)
a<-table.element(a, 'F-TEST (DF numerator)',1,TRUE)
a<-table.element(a, mysum$fstatistic[2])
a<-table.row.end(a)
a<-table.row.start(a)
a<-table.element(a, 'F-TEST (DF denominator)',1,TRUE)
a<-table.element(a, mysum$fstatistic[3])
a<-table.row.end(a)
a<-table.row.start(a)
a<-table.element(a, 'p-value',1,TRUE)
a<-table.element(a, 1-pf(mysum$fstatistic[1],mysum$fstatistic[2],mysum$fstatistic[3]))
a<-table.row.end(a)
a<-table.row.start(a)
a<-table.element(a, 'Multiple Linear Regression - Residual Statistics', 2, TRUE)
a<-table.row.end(a)
a<-table.row.start(a)
a<-table.element(a, 'Residual Standard Deviation',1,TRUE)
a<-table.element(a, mysum$sigma)
a<-table.row.end(a)
a<-table.row.start(a)
a<-table.element(a, 'Sum Squared Residuals',1,TRUE)
a<-table.element(a, sum(myerror*myerror))
a<-table.row.end(a)
a<-table.end(a)
table.save(a,file='mytable3.tab')
a<-table.start()
a<-table.row.start(a)
a<-table.element(a, 'Multiple Linear Regression - Actuals, Interpolation, and Residuals', 4, TRUE)
a<-table.row.end(a)
a<-table.row.start(a)
a<-table.element(a, 'Time or Index', 1, TRUE)
a<-table.element(a, 'Actuals', 1, TRUE)
a<-table.element(a, 'Interpolation
Forecast', 1, TRUE)
a<-table.element(a, 'Residuals
Prediction Error', 1, TRUE)
a<-table.row.end(a)
for (i in 1:n) {
a<-table.row.start(a)
a<-table.element(a,i, 1, TRUE)
a<-table.element(a,x[i])
a<-table.element(a,x[i]-mysum$resid[i])
a<-table.element(a,mysum$resid[i])
a<-table.row.end(a)
}
a<-table.end(a)
table.save(a,file='mytable4.tab')
if (n > n25) {
a<-table.start()
a<-table.row.start(a)
a<-table.element(a,'Goldfeld-Quandt test for Heteroskedasticity',4,TRUE)
a<-table.row.end(a)
a<-table.row.start(a)
a<-table.element(a,'p-values',header=TRUE)
a<-table.element(a,'Alternative Hypothesis',3,header=TRUE)
a<-table.row.end(a)
a<-table.row.start(a)
a<-table.element(a,'breakpoint index',header=TRUE)
a<-table.element(a,'greater',header=TRUE)
a<-table.element(a,'2-sided',header=TRUE)
a<-table.element(a,'less',header=TRUE)
a<-table.row.end(a)
for (mypoint in kp3:nmkm3) {
a<-table.row.start(a)
a<-table.element(a,mypoint,header=TRUE)
a<-table.element(a,gqarr[mypoint-kp3+1,1])
a<-table.element(a,gqarr[mypoint-kp3+1,2])
a<-table.element(a,gqarr[mypoint-kp3+1,3])
a<-table.row.end(a)
}
a<-table.end(a)
table.save(a,file='mytable5.tab')
a<-table.start()
a<-table.row.start(a)
a<-table.element(a,'Meta Analysis of Goldfeld-Quandt test for Heteroskedasticity',4,TRUE)
a<-table.row.end(a)
a<-table.row.start(a)
a<-table.element(a,'Description',header=TRUE)
a<-table.element(a,'# significant tests',header=TRUE)
a<-table.element(a,'% significant tests',header=TRUE)
a<-table.element(a,'OK/NOK',header=TRUE)
a<-table.row.end(a)
a<-table.row.start(a)
a<-table.element(a,'1% type I error level',header=TRUE)
a<-table.element(a,numsignificant1)
a<-table.element(a,numsignificant1/numgqtests)
if (numsignificant1/numgqtests < 0.01) dum <- 'OK' else dum <- 'NOK'
a<-table.element(a,dum)
a<-table.row.end(a)
a<-table.row.start(a)
a<-table.element(a,'5% type I error level',header=TRUE)
a<-table.element(a,numsignificant5)
a<-table.element(a,numsignificant5/numgqtests)
if (numsignificant5/numgqtests < 0.05) dum <- 'OK' else dum <- 'NOK'
a<-table.element(a,dum)
a<-table.row.end(a)
a<-table.row.start(a)
a<-table.element(a,'10% type I error level',header=TRUE)
a<-table.element(a,numsignificant10)
a<-table.element(a,numsignificant10/numgqtests)
if (numsignificant10/numgqtests < 0.1) dum <- 'OK' else dum <- 'NOK'
a<-table.element(a,dum)
a<-table.row.end(a)
a<-table.end(a)
table.save(a,file='mytable6.tab')
}