Free Statistics

of Irreproducible Research!

Author's title

Author*Unverified author*
R Software Modulerwasp_autocorrelation.wasp
Title produced by software(Partial) Autocorrelation Function
Date of computationTue, 23 Dec 2008 09:28:25 -0700
Cite this page as followsStatistical Computations at FreeStatistics.org, Office for Research Development and Education, URL https://freestatistics.org/blog/index.php?v=date/2008/Dec/23/t1230049737rqw4swxfi77sraa.htm/, Retrieved Mon, 20 May 2024 07:49:07 +0000
Statistical Computations at FreeStatistics.org, Office for Research Development and Education, URL https://freestatistics.org/blog/index.php?pk=36346, Retrieved Mon, 20 May 2024 07:49:07 +0000
QR Codes:

Original text written by user:
IsPrivate?No (this computation is public)
User-defined keywords
Estimated Impact142
Family? (F = Feedback message, R = changed R code, M = changed R Module, P = changed Parameters, D = changed Data)
-     [(Partial) Autocorrelation Function] [(Partial) Autocor...] [2008-12-21 16:05:06] [005278dde49cfd8c32bf201feaeb19d6]
- R PD    [(Partial) Autocorrelation Function] [(Partial) Autocor...] [2008-12-23 16:28:25] [44fbdf1868a3b8f737edae4578b93508] [Current]
-  MPD      [(Partial) Autocorrelation Function] [autocorrelatie fu...] [2009-12-19 17:04:11] [4b453aa14d54730625f8d3de5f1f6d82]
Feedback Forum

Post a new message
Dataseries X:
621
604
584
574
555
545
599
620
608
590
579
580
579
572
560
551
537
541
588
607
599
578
563
566
561
554
540
526
512
505
554
584
569
540
522
526
527
516
503
489
479
475
524
552
532
511
492
492
493
481
462
457
442
439
488
521
501
485
464
460
467
460
448
443
436
431
484
510
513
503
471
471
476
475
470
461
455
456
517
525
523
519
509
512
519
517
510
509
501
507
569
580
578
565
547
555
562
561
555
544
537
543
594
611
613
611
594
595
591
589
584
573
567
569
621
629
628
612
595
597
593
590
580
574
573
573
620
626
620
588
566
557
561
549
532
526
511
499
555
565
542
527
510
514
517
508
493
490
469
478
528
534
518
506
502


Summary of computational transaction
Raw Inputview raw input (R code)
Raw Outputview raw output of R engine
Computing time3 seconds
R Server'Herman Ole Andreas Wold' @ 193.190.124.10:1001

\begin{tabular}{lllllllll}
\hline
Summary of computational transaction \tabularnewline
Raw Input & view raw input (R code)  \tabularnewline
Raw Output & view raw output of R engine  \tabularnewline
Computing time & 3 seconds \tabularnewline
R Server & 'Herman Ole Andreas Wold' @ 193.190.124.10:1001 \tabularnewline
\hline
\end{tabular}
%Source: https://freestatistics.org/blog/index.php?pk=36346&T=0

[TABLE]
[ROW][C]Summary of computational transaction[/C][/ROW]
[ROW][C]Raw Input[/C][C]view raw input (R code) [/C][/ROW]
[ROW][C]Raw Output[/C][C]view raw output of R engine [/C][/ROW]
[ROW][C]Computing time[/C][C]3 seconds[/C][/ROW]
[ROW][C]R Server[/C][C]'Herman Ole Andreas Wold' @ 193.190.124.10:1001[/C][/ROW]
[/TABLE]
Source: https://freestatistics.org/blog/index.php?pk=36346&T=0

Globally Unique Identifier (entire table): ba.freestatistics.org/blog/index.php?pk=36346&T=0

As an alternative you can also use a QR Code:  

The GUIDs for individual cells are displayed in the table below:

Summary of computational transaction
Raw Inputview raw input (R code)
Raw Outputview raw output of R engine
Computing time3 seconds
R Server'Herman Ole Andreas Wold' @ 193.190.124.10:1001


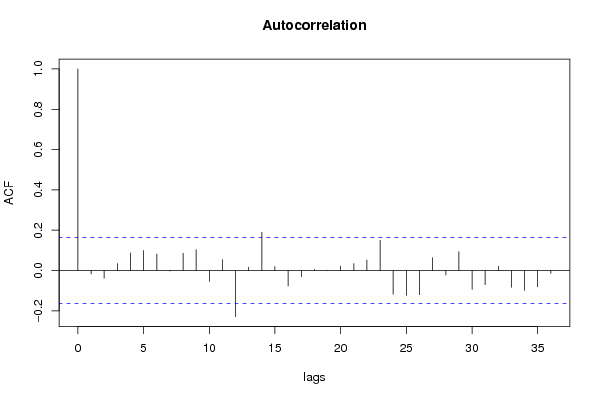
Autocorrelation Function
Time lag kACF(k)T-STATP-value
1-0.017189-0.20480.418998
2-0.037815-0.45060.326474
30.0345680.41190.340509
40.0871231.03820.150473
50.0993331.18370.119258
60.0817250.97390.165891
7-0.002904-0.03460.486223
80.085151.01470.155993
90.1034521.23280.109848
10-0.054458-0.64890.258714
110.0539630.6430.260615
12-0.228825-2.72680.003601
130.0163360.19470.422967
140.1895652.25890.012706
150.0194220.23140.408652
16-0.07648-0.91140.181824
17-0.030695-0.36580.35754
180.0063470.07560.469909
190.0008190.00980.496111
200.0222580.26520.395608
210.0342580.40820.34186
220.0520550.62030.268023
230.1497641.78460.038227
24-0.117786-1.40360.081313
25-0.122819-1.46360.072763
26-0.120129-1.43150.077241
270.063830.76060.224072
28-0.021994-0.26210.396815
290.0935531.11480.133406
30-0.093295-1.11170.134064
31-0.069996-0.83410.202814
320.0208820.24880.401923
33-0.083392-0.99370.161023
34-0.098475-1.17350.121287
35-0.080967-0.96480.168135
36-0.013542-0.16140.436016

\begin{tabular}{lllllllll}
\hline
Autocorrelation Function \tabularnewline
Time lag k & ACF(k) & T-STAT & P-value \tabularnewline
1 & -0.017189 & -0.2048 & 0.418998 \tabularnewline
2 & -0.037815 & -0.4506 & 0.326474 \tabularnewline
3 & 0.034568 & 0.4119 & 0.340509 \tabularnewline
4 & 0.087123 & 1.0382 & 0.150473 \tabularnewline
5 & 0.099333 & 1.1837 & 0.119258 \tabularnewline
6 & 0.081725 & 0.9739 & 0.165891 \tabularnewline
7 & -0.002904 & -0.0346 & 0.486223 \tabularnewline
8 & 0.08515 & 1.0147 & 0.155993 \tabularnewline
9 & 0.103452 & 1.2328 & 0.109848 \tabularnewline
10 & -0.054458 & -0.6489 & 0.258714 \tabularnewline
11 & 0.053963 & 0.643 & 0.260615 \tabularnewline
12 & -0.228825 & -2.7268 & 0.003601 \tabularnewline
13 & 0.016336 & 0.1947 & 0.422967 \tabularnewline
14 & 0.189565 & 2.2589 & 0.012706 \tabularnewline
15 & 0.019422 & 0.2314 & 0.408652 \tabularnewline
16 & -0.07648 & -0.9114 & 0.181824 \tabularnewline
17 & -0.030695 & -0.3658 & 0.35754 \tabularnewline
18 & 0.006347 & 0.0756 & 0.469909 \tabularnewline
19 & 0.000819 & 0.0098 & 0.496111 \tabularnewline
20 & 0.022258 & 0.2652 & 0.395608 \tabularnewline
21 & 0.034258 & 0.4082 & 0.34186 \tabularnewline
22 & 0.052055 & 0.6203 & 0.268023 \tabularnewline
23 & 0.149764 & 1.7846 & 0.038227 \tabularnewline
24 & -0.117786 & -1.4036 & 0.081313 \tabularnewline
25 & -0.122819 & -1.4636 & 0.072763 \tabularnewline
26 & -0.120129 & -1.4315 & 0.077241 \tabularnewline
27 & 0.06383 & 0.7606 & 0.224072 \tabularnewline
28 & -0.021994 & -0.2621 & 0.396815 \tabularnewline
29 & 0.093553 & 1.1148 & 0.133406 \tabularnewline
30 & -0.093295 & -1.1117 & 0.134064 \tabularnewline
31 & -0.069996 & -0.8341 & 0.202814 \tabularnewline
32 & 0.020882 & 0.2488 & 0.401923 \tabularnewline
33 & -0.083392 & -0.9937 & 0.161023 \tabularnewline
34 & -0.098475 & -1.1735 & 0.121287 \tabularnewline
35 & -0.080967 & -0.9648 & 0.168135 \tabularnewline
36 & -0.013542 & -0.1614 & 0.436016 \tabularnewline
\hline
\end{tabular}
%Source: https://freestatistics.org/blog/index.php?pk=36346&T=1

[TABLE]
[ROW][C]Autocorrelation Function[/C][/ROW]
[ROW][C]Time lag k[/C][C]ACF(k)[/C][C]T-STAT[/C][C]P-value[/C][/ROW]
[ROW][C]1[/C][C]-0.017189[/C][C]-0.2048[/C][C]0.418998[/C][/ROW]
[ROW][C]2[/C][C]-0.037815[/C][C]-0.4506[/C][C]0.326474[/C][/ROW]
[ROW][C]3[/C][C]0.034568[/C][C]0.4119[/C][C]0.340509[/C][/ROW]
[ROW][C]4[/C][C]0.087123[/C][C]1.0382[/C][C]0.150473[/C][/ROW]
[ROW][C]5[/C][C]0.099333[/C][C]1.1837[/C][C]0.119258[/C][/ROW]
[ROW][C]6[/C][C]0.081725[/C][C]0.9739[/C][C]0.165891[/C][/ROW]
[ROW][C]7[/C][C]-0.002904[/C][C]-0.0346[/C][C]0.486223[/C][/ROW]
[ROW][C]8[/C][C]0.08515[/C][C]1.0147[/C][C]0.155993[/C][/ROW]
[ROW][C]9[/C][C]0.103452[/C][C]1.2328[/C][C]0.109848[/C][/ROW]
[ROW][C]10[/C][C]-0.054458[/C][C]-0.6489[/C][C]0.258714[/C][/ROW]
[ROW][C]11[/C][C]0.053963[/C][C]0.643[/C][C]0.260615[/C][/ROW]
[ROW][C]12[/C][C]-0.228825[/C][C]-2.7268[/C][C]0.003601[/C][/ROW]
[ROW][C]13[/C][C]0.016336[/C][C]0.1947[/C][C]0.422967[/C][/ROW]
[ROW][C]14[/C][C]0.189565[/C][C]2.2589[/C][C]0.012706[/C][/ROW]
[ROW][C]15[/C][C]0.019422[/C][C]0.2314[/C][C]0.408652[/C][/ROW]
[ROW][C]16[/C][C]-0.07648[/C][C]-0.9114[/C][C]0.181824[/C][/ROW]
[ROW][C]17[/C][C]-0.030695[/C][C]-0.3658[/C][C]0.35754[/C][/ROW]
[ROW][C]18[/C][C]0.006347[/C][C]0.0756[/C][C]0.469909[/C][/ROW]
[ROW][C]19[/C][C]0.000819[/C][C]0.0098[/C][C]0.496111[/C][/ROW]
[ROW][C]20[/C][C]0.022258[/C][C]0.2652[/C][C]0.395608[/C][/ROW]
[ROW][C]21[/C][C]0.034258[/C][C]0.4082[/C][C]0.34186[/C][/ROW]
[ROW][C]22[/C][C]0.052055[/C][C]0.6203[/C][C]0.268023[/C][/ROW]
[ROW][C]23[/C][C]0.149764[/C][C]1.7846[/C][C]0.038227[/C][/ROW]
[ROW][C]24[/C][C]-0.117786[/C][C]-1.4036[/C][C]0.081313[/C][/ROW]
[ROW][C]25[/C][C]-0.122819[/C][C]-1.4636[/C][C]0.072763[/C][/ROW]
[ROW][C]26[/C][C]-0.120129[/C][C]-1.4315[/C][C]0.077241[/C][/ROW]
[ROW][C]27[/C][C]0.06383[/C][C]0.7606[/C][C]0.224072[/C][/ROW]
[ROW][C]28[/C][C]-0.021994[/C][C]-0.2621[/C][C]0.396815[/C][/ROW]
[ROW][C]29[/C][C]0.093553[/C][C]1.1148[/C][C]0.133406[/C][/ROW]
[ROW][C]30[/C][C]-0.093295[/C][C]-1.1117[/C][C]0.134064[/C][/ROW]
[ROW][C]31[/C][C]-0.069996[/C][C]-0.8341[/C][C]0.202814[/C][/ROW]
[ROW][C]32[/C][C]0.020882[/C][C]0.2488[/C][C]0.401923[/C][/ROW]
[ROW][C]33[/C][C]-0.083392[/C][C]-0.9937[/C][C]0.161023[/C][/ROW]
[ROW][C]34[/C][C]-0.098475[/C][C]-1.1735[/C][C]0.121287[/C][/ROW]
[ROW][C]35[/C][C]-0.080967[/C][C]-0.9648[/C][C]0.168135[/C][/ROW]
[ROW][C]36[/C][C]-0.013542[/C][C]-0.1614[/C][C]0.436016[/C][/ROW]
[/TABLE]
Source: https://freestatistics.org/blog/index.php?pk=36346&T=1

Globally Unique Identifier (entire table): ba.freestatistics.org/blog/index.php?pk=36346&T=1

As an alternative you can also use a QR Code:  

The GUIDs for individual cells are displayed in the table below:

Autocorrelation Function
Time lag kACF(k)T-STATP-value
1-0.017189-0.20480.418998
2-0.037815-0.45060.326474
30.0345680.41190.340509
40.0871231.03820.150473
50.0993331.18370.119258
60.0817250.97390.165891
7-0.002904-0.03460.486223
80.085151.01470.155993
90.1034521.23280.109848
10-0.054458-0.64890.258714
110.0539630.6430.260615
12-0.228825-2.72680.003601
130.0163360.19470.422967
140.1895652.25890.012706
150.0194220.23140.408652
16-0.07648-0.91140.181824
17-0.030695-0.36580.35754
180.0063470.07560.469909
190.0008190.00980.496111
200.0222580.26520.395608
210.0342580.40820.34186
220.0520550.62030.268023
230.1497641.78460.038227
24-0.117786-1.40360.081313
25-0.122819-1.46360.072763
26-0.120129-1.43150.077241
270.063830.76060.224072
28-0.021994-0.26210.396815
290.0935531.11480.133406
30-0.093295-1.11170.134064
31-0.069996-0.83410.202814
320.0208820.24880.401923
33-0.083392-0.99370.161023
34-0.098475-1.17350.121287
35-0.080967-0.96480.168135
36-0.013542-0.16140.436016


Partial Autocorrelation Function
Time lag kPACF(k)T-STATP-value
1-0.017189-0.20480.418998
2-0.038122-0.45430.325161
30.0332960.39680.346068
40.0870981.03790.150542
50.106131.26470.104027
60.0937751.11750.132842
70.0044840.05340.478731
80.0796480.94910.172088
90.0883221.05250.147185
10-0.067987-0.81020.209602
110.0368710.43940.33053
12-0.272026-3.24160.000741
13-0.028798-0.34320.365988
140.1522261.8140.035896
150.0353250.4210.337214
16-0.020299-0.24190.404606
17-0.020508-0.24440.403644
180.0168360.20060.420642
19-0.022559-0.26880.394229
200.0317560.37840.352843
210.104281.24260.108024
220.0051180.0610.475725
230.16972.02220.022516
24-0.174954-2.08480.019438
25-0.16982-2.02360.022441
26-0.122255-1.45680.073685
270.027620.32910.371272
28-0.0834-0.99380.160999
290.1150631.37110.086249
30-0.015968-0.19030.42468
31-0.055318-0.65920.255421
320.0455920.54330.29389
330.0076980.09170.463519
34-0.105832-1.26110.104664
35-0.015862-0.1890.425173
36-0.100369-1.1960.116839

\begin{tabular}{lllllllll}
\hline
Partial Autocorrelation Function \tabularnewline
Time lag k & PACF(k) & T-STAT & P-value \tabularnewline
1 & -0.017189 & -0.2048 & 0.418998 \tabularnewline
2 & -0.038122 & -0.4543 & 0.325161 \tabularnewline
3 & 0.033296 & 0.3968 & 0.346068 \tabularnewline
4 & 0.087098 & 1.0379 & 0.150542 \tabularnewline
5 & 0.10613 & 1.2647 & 0.104027 \tabularnewline
6 & 0.093775 & 1.1175 & 0.132842 \tabularnewline
7 & 0.004484 & 0.0534 & 0.478731 \tabularnewline
8 & 0.079648 & 0.9491 & 0.172088 \tabularnewline
9 & 0.088322 & 1.0525 & 0.147185 \tabularnewline
10 & -0.067987 & -0.8102 & 0.209602 \tabularnewline
11 & 0.036871 & 0.4394 & 0.33053 \tabularnewline
12 & -0.272026 & -3.2416 & 0.000741 \tabularnewline
13 & -0.028798 & -0.3432 & 0.365988 \tabularnewline
14 & 0.152226 & 1.814 & 0.035896 \tabularnewline
15 & 0.035325 & 0.421 & 0.337214 \tabularnewline
16 & -0.020299 & -0.2419 & 0.404606 \tabularnewline
17 & -0.020508 & -0.2444 & 0.403644 \tabularnewline
18 & 0.016836 & 0.2006 & 0.420642 \tabularnewline
19 & -0.022559 & -0.2688 & 0.394229 \tabularnewline
20 & 0.031756 & 0.3784 & 0.352843 \tabularnewline
21 & 0.10428 & 1.2426 & 0.108024 \tabularnewline
22 & 0.005118 & 0.061 & 0.475725 \tabularnewline
23 & 0.1697 & 2.0222 & 0.022516 \tabularnewline
24 & -0.174954 & -2.0848 & 0.019438 \tabularnewline
25 & -0.16982 & -2.0236 & 0.022441 \tabularnewline
26 & -0.122255 & -1.4568 & 0.073685 \tabularnewline
27 & 0.02762 & 0.3291 & 0.371272 \tabularnewline
28 & -0.0834 & -0.9938 & 0.160999 \tabularnewline
29 & 0.115063 & 1.3711 & 0.086249 \tabularnewline
30 & -0.015968 & -0.1903 & 0.42468 \tabularnewline
31 & -0.055318 & -0.6592 & 0.255421 \tabularnewline
32 & 0.045592 & 0.5433 & 0.29389 \tabularnewline
33 & 0.007698 & 0.0917 & 0.463519 \tabularnewline
34 & -0.105832 & -1.2611 & 0.104664 \tabularnewline
35 & -0.015862 & -0.189 & 0.425173 \tabularnewline
36 & -0.100369 & -1.196 & 0.116839 \tabularnewline
\hline
\end{tabular}
%Source: https://freestatistics.org/blog/index.php?pk=36346&T=2

[TABLE]
[ROW][C]Partial Autocorrelation Function[/C][/ROW]
[ROW][C]Time lag k[/C][C]PACF(k)[/C][C]T-STAT[/C][C]P-value[/C][/ROW]
[ROW][C]1[/C][C]-0.017189[/C][C]-0.2048[/C][C]0.418998[/C][/ROW]
[ROW][C]2[/C][C]-0.038122[/C][C]-0.4543[/C][C]0.325161[/C][/ROW]
[ROW][C]3[/C][C]0.033296[/C][C]0.3968[/C][C]0.346068[/C][/ROW]
[ROW][C]4[/C][C]0.087098[/C][C]1.0379[/C][C]0.150542[/C][/ROW]
[ROW][C]5[/C][C]0.10613[/C][C]1.2647[/C][C]0.104027[/C][/ROW]
[ROW][C]6[/C][C]0.093775[/C][C]1.1175[/C][C]0.132842[/C][/ROW]
[ROW][C]7[/C][C]0.004484[/C][C]0.0534[/C][C]0.478731[/C][/ROW]
[ROW][C]8[/C][C]0.079648[/C][C]0.9491[/C][C]0.172088[/C][/ROW]
[ROW][C]9[/C][C]0.088322[/C][C]1.0525[/C][C]0.147185[/C][/ROW]
[ROW][C]10[/C][C]-0.067987[/C][C]-0.8102[/C][C]0.209602[/C][/ROW]
[ROW][C]11[/C][C]0.036871[/C][C]0.4394[/C][C]0.33053[/C][/ROW]
[ROW][C]12[/C][C]-0.272026[/C][C]-3.2416[/C][C]0.000741[/C][/ROW]
[ROW][C]13[/C][C]-0.028798[/C][C]-0.3432[/C][C]0.365988[/C][/ROW]
[ROW][C]14[/C][C]0.152226[/C][C]1.814[/C][C]0.035896[/C][/ROW]
[ROW][C]15[/C][C]0.035325[/C][C]0.421[/C][C]0.337214[/C][/ROW]
[ROW][C]16[/C][C]-0.020299[/C][C]-0.2419[/C][C]0.404606[/C][/ROW]
[ROW][C]17[/C][C]-0.020508[/C][C]-0.2444[/C][C]0.403644[/C][/ROW]
[ROW][C]18[/C][C]0.016836[/C][C]0.2006[/C][C]0.420642[/C][/ROW]
[ROW][C]19[/C][C]-0.022559[/C][C]-0.2688[/C][C]0.394229[/C][/ROW]
[ROW][C]20[/C][C]0.031756[/C][C]0.3784[/C][C]0.352843[/C][/ROW]
[ROW][C]21[/C][C]0.10428[/C][C]1.2426[/C][C]0.108024[/C][/ROW]
[ROW][C]22[/C][C]0.005118[/C][C]0.061[/C][C]0.475725[/C][/ROW]
[ROW][C]23[/C][C]0.1697[/C][C]2.0222[/C][C]0.022516[/C][/ROW]
[ROW][C]24[/C][C]-0.174954[/C][C]-2.0848[/C][C]0.019438[/C][/ROW]
[ROW][C]25[/C][C]-0.16982[/C][C]-2.0236[/C][C]0.022441[/C][/ROW]
[ROW][C]26[/C][C]-0.122255[/C][C]-1.4568[/C][C]0.073685[/C][/ROW]
[ROW][C]27[/C][C]0.02762[/C][C]0.3291[/C][C]0.371272[/C][/ROW]
[ROW][C]28[/C][C]-0.0834[/C][C]-0.9938[/C][C]0.160999[/C][/ROW]
[ROW][C]29[/C][C]0.115063[/C][C]1.3711[/C][C]0.086249[/C][/ROW]
[ROW][C]30[/C][C]-0.015968[/C][C]-0.1903[/C][C]0.42468[/C][/ROW]
[ROW][C]31[/C][C]-0.055318[/C][C]-0.6592[/C][C]0.255421[/C][/ROW]
[ROW][C]32[/C][C]0.045592[/C][C]0.5433[/C][C]0.29389[/C][/ROW]
[ROW][C]33[/C][C]0.007698[/C][C]0.0917[/C][C]0.463519[/C][/ROW]
[ROW][C]34[/C][C]-0.105832[/C][C]-1.2611[/C][C]0.104664[/C][/ROW]
[ROW][C]35[/C][C]-0.015862[/C][C]-0.189[/C][C]0.425173[/C][/ROW]
[ROW][C]36[/C][C]-0.100369[/C][C]-1.196[/C][C]0.116839[/C][/ROW]
[/TABLE]
Source: https://freestatistics.org/blog/index.php?pk=36346&T=2

Globally Unique Identifier (entire table): ba.freestatistics.org/blog/index.php?pk=36346&T=2

As an alternative you can also use a QR Code:  

The GUIDs for individual cells are displayed in the table below:

Partial Autocorrelation Function
Time lag kPACF(k)T-STATP-value
1-0.017189-0.20480.418998
2-0.038122-0.45430.325161
30.0332960.39680.346068
40.0870981.03790.150542
50.106131.26470.104027
60.0937751.11750.132842
70.0044840.05340.478731
80.0796480.94910.172088
90.0883221.05250.147185
10-0.067987-0.81020.209602
110.0368710.43940.33053
12-0.272026-3.24160.000741
13-0.028798-0.34320.365988
140.1522261.8140.035896
150.0353250.4210.337214
16-0.020299-0.24190.404606
17-0.020508-0.24440.403644
180.0168360.20060.420642
19-0.022559-0.26880.394229
200.0317560.37840.352843
210.104281.24260.108024
220.0051180.0610.475725
230.16972.02220.022516
24-0.174954-2.08480.019438
25-0.16982-2.02360.022441
26-0.122255-1.45680.073685
270.027620.32910.371272
28-0.0834-0.99380.160999
290.1150631.37110.086249
30-0.015968-0.19030.42468
31-0.055318-0.65920.255421
320.0455920.54330.29389
330.0076980.09170.463519
34-0.105832-1.26110.104664
35-0.015862-0.1890.425173
36-0.100369-1.1960.116839


Parameters (Session):
par1 = 36 ; par2 = 1 ; par3 = 1 ; par4 = 1 ; par5 = 12 ;
Parameters (R input):
par1 = 36 ; par2 = 1 ; par3 = 1 ; par4 = 1 ; par5 = 12 ;
R code (references can be found in the software module):
if (par1 == 'Default') {
par1 = 10*log10(length(x))
} else {
par1 <- as.numeric(par1)
}
par2 <- as.numeric(par2)
par3 <- as.numeric(par3)
par4 <- as.numeric(par4)
par5 <- as.numeric(par5)
if (par2 == 0) {
x <- log(x)
} else {
x <- (x ^ par2 - 1) / par2
}
if (par3 > 0) x <- diff(x,lag=1,difference=par3)
if (par4 > 0) x <- diff(x,lag=par5,difference=par4)
bitmap(file='pic1.png')
racf <- acf(x,par1,main='Autocorrelation',xlab='lags',ylab='ACF')
dev.off()
bitmap(file='pic2.png')
rpacf <- pacf(x,par1,main='Partial Autocorrelation',xlab='lags',ylab='PACF')
dev.off()
(myacf <- c(racf$acf))
(mypacf <- c(rpacf$acf))
lengthx <- length(x)
sqrtn <- sqrt(lengthx)
load(file='createtable')
a<-table.start()
a<-table.row.start(a)
a<-table.element(a,'Autocorrelation Function',4,TRUE)
a<-table.row.end(a)
a<-table.row.start(a)
a<-table.element(a,'Time lag k',header=TRUE)
a<-table.element(a,hyperlink('basics.htm','ACF(k)','click here for more information about the Autocorrelation Function'),header=TRUE)
a<-table.element(a,'T-STAT',header=TRUE)
a<-table.element(a,'P-value',header=TRUE)
a<-table.row.end(a)
for (i in 2:(par1+1)) {
a<-table.row.start(a)
a<-table.element(a,i-1,header=TRUE)
a<-table.element(a,round(myacf[i],6))
mytstat <- myacf[i]*sqrtn
a<-table.element(a,round(mytstat,4))
a<-table.element(a,round(1-pt(abs(mytstat),lengthx),6))
a<-table.row.end(a)
}
a<-table.end(a)
table.save(a,file='mytable.tab')
a<-table.start()
a<-table.row.start(a)
a<-table.element(a,'Partial Autocorrelation Function',4,TRUE)
a<-table.row.end(a)
a<-table.row.start(a)
a<-table.element(a,'Time lag k',header=TRUE)
a<-table.element(a,hyperlink('basics.htm','PACF(k)','click here for more information about the Partial Autocorrelation Function'),header=TRUE)
a<-table.element(a,'T-STAT',header=TRUE)
a<-table.element(a,'P-value',header=TRUE)
a<-table.row.end(a)
for (i in 1:par1) {
a<-table.row.start(a)
a<-table.element(a,i,header=TRUE)
a<-table.element(a,round(mypacf[i],6))
mytstat <- mypacf[i]*sqrtn
a<-table.element(a,round(mytstat,4))
a<-table.element(a,round(1-pt(abs(mytstat),lengthx),6))
a<-table.row.end(a)
}
a<-table.end(a)
table.save(a,file='mytable1.tab')