Free Statistics

of Irreproducible Research!

Author's title

Author*Unverified author*
R Software Modulerwasp_autocorrelation.wasp
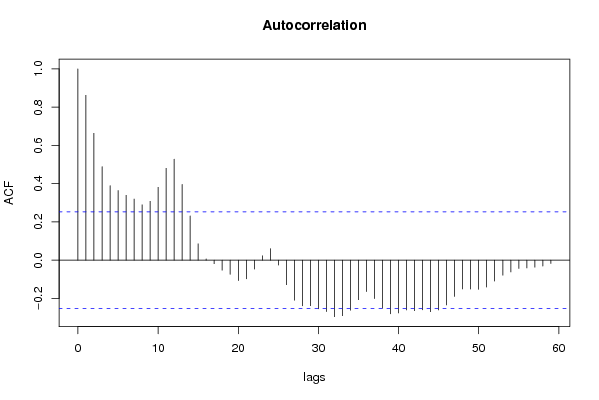
Title produced by software(Partial) Autocorrelation Function
Date of computationTue, 23 Dec 2008 13:44:20 -0700
Cite this page as followsStatistical Computations at FreeStatistics.org, Office for Research Development and Education, URL https://freestatistics.org/blog/index.php?v=date/2008/Dec/23/t1230065111utmeb1kvf8b6l7d.htm/, Retrieved Mon, 29 Apr 2024 08:03:18 +0000
Statistical Computations at FreeStatistics.org, Office for Research Development and Education, URL https://freestatistics.org/blog/index.php?pk=36415, Retrieved Mon, 29 Apr 2024 08:03:18 +0000
QR Codes:

Original text written by user:
IsPrivate?No (this computation is public)
User-defined keywords
Estimated Impact118
Family? (F = Feedback message, R = changed R code, M = changed R Module, P = changed Parameters, D = changed Data)
-       [(Partial) Autocorrelation Function] [(P)ACF Mannen ] [2008-12-23 20:44:20] [f0e1dc59aca2fa8d78080b39899f316a] [Current]
- RMPD    [(Partial) Autocorrelation Function] [Paper - 8] [2009-12-10 15:24:47] [33b67a4fef396e07351e7d265eba4806]
- RMPD    [(Partial) Autocorrelation Function] [Paper - 9] [2009-12-10 15:28:07] [33b67a4fef396e07351e7d265eba4806]
- RMPD    [(Partial) Autocorrelation Function] [Paper - 10] [2009-12-10 15:31:29] [33b67a4fef396e07351e7d265eba4806]
Feedback Forum

Post a new message
Dataseries X:
54156
53661
52441
50648
48141
46127
45623
56527
60205
61321
58088
54623
53495
51824
50518
49050
47111
45264
44357
54862
57871
59070
56273
52837
51702
49447
48965
46922
46256
45200
44471
53119
55016
56641
51847
47990
45744
46390
44461
41582
40813
38096
35461
44375
46255
45610
43375
40167
40628
40590
39473
36735
36634
32806
32907
41076
42254
43215
41116
40373


Summary of computational transaction
Raw Inputview raw input (R code)
Raw Outputview raw output of R engine
Computing time2 seconds
R Server'George Udny Yule' @ 72.249.76.132

\begin{tabular}{lllllllll}
\hline
Summary of computational transaction \tabularnewline
Raw Input & view raw input (R code)  \tabularnewline
Raw Output & view raw output of R engine  \tabularnewline
Computing time & 2 seconds \tabularnewline
R Server & 'George Udny Yule' @ 72.249.76.132 \tabularnewline
\hline
\end{tabular}
%Source: https://freestatistics.org/blog/index.php?pk=36415&T=0

[TABLE]
[ROW][C]Summary of computational transaction[/C][/ROW]
[ROW][C]Raw Input[/C][C]view raw input (R code) [/C][/ROW]
[ROW][C]Raw Output[/C][C]view raw output of R engine [/C][/ROW]
[ROW][C]Computing time[/C][C]2 seconds[/C][/ROW]
[ROW][C]R Server[/C][C]'George Udny Yule' @ 72.249.76.132[/C][/ROW]
[/TABLE]
Source: https://freestatistics.org/blog/index.php?pk=36415&T=0

Globally Unique Identifier (entire table): ba.freestatistics.org/blog/index.php?pk=36415&T=0

As an alternative you can also use a QR Code:  

The GUIDs for individual cells are displayed in the table below:

Summary of computational transaction
Raw Inputview raw input (R code)
Raw Outputview raw output of R engine
Computing time2 seconds
R Server'George Udny Yule' @ 72.249.76.132


Autocorrelation Function
Time lag kACF(k)T-STATP-value
10.8622586.6790
20.6637115.14112e-06
30.4891533.7890.000176
40.38943.01630.001875
50.3643792.82250.003228
60.3394562.62940.005425
70.3198942.47790.008024
80.2897922.24470.014243
90.3082932.3880.010052
100.3813962.95430.002236
110.4804423.72150.000219
120.5283734.09286.5e-05
130.3963363.070.001607
140.2313781.79220.039068
150.0860090.66620.253911
160.0069760.0540.478542
17-0.017859-0.13830.445218
18-0.051976-0.40260.344334
19-0.07375-0.57130.284976
20-0.106438-0.82450.206471
21-0.097162-0.75260.227313
22-0.046131-0.35730.361048
230.0234130.18140.42835
240.0601950.46630.321355
25-0.0254-0.19670.422346
26-0.127749-0.98950.163187
27-0.209174-1.62030.055211
28-0.238172-1.84490.034997
29-0.237803-1.8420.035208
30-0.254155-1.96870.026807
31-0.268369-2.07880.020961
32-0.295001-2.28510.012929
33-0.289872-2.24530.014222
34-0.260895-2.02090.023881
35-0.206379-1.59860.057581
36-0.16377-1.26860.104749
37-0.200478-1.55290.062853
38-0.250735-1.94220.028407
39-0.279973-2.16870.017042
40-0.275708-2.13560.0184
41-0.259594-2.01080.024423
42-0.263539-2.04140.02281
43-0.259322-2.00870.024538
44-0.269303-2.0860.020619
45-0.260039-2.01430.024236
46-0.233585-1.80930.037704
47-0.18933-1.46650.073861
48-0.150283-1.16410.124499
49-0.151066-1.17020.123283
50-0.15231-1.17980.121371
51-0.140469-1.08810.140458
52-0.109216-0.8460.200461
53-0.07804-0.60450.273898
54-0.061027-0.47270.319067
55-0.04286-0.3320.370527
56-0.040613-0.31460.377084
57-0.036219-0.28060.39001
58-0.030398-0.23550.407327
59-0.016694-0.12930.448771
60NANANA

\begin{tabular}{lllllllll}
\hline
Autocorrelation Function \tabularnewline
Time lag k & ACF(k) & T-STAT & P-value \tabularnewline
1 & 0.862258 & 6.679 & 0 \tabularnewline
2 & 0.663711 & 5.1411 & 2e-06 \tabularnewline
3 & 0.489153 & 3.789 & 0.000176 \tabularnewline
4 & 0.3894 & 3.0163 & 0.001875 \tabularnewline
5 & 0.364379 & 2.8225 & 0.003228 \tabularnewline
6 & 0.339456 & 2.6294 & 0.005425 \tabularnewline
7 & 0.319894 & 2.4779 & 0.008024 \tabularnewline
8 & 0.289792 & 2.2447 & 0.014243 \tabularnewline
9 & 0.308293 & 2.388 & 0.010052 \tabularnewline
10 & 0.381396 & 2.9543 & 0.002236 \tabularnewline
11 & 0.480442 & 3.7215 & 0.000219 \tabularnewline
12 & 0.528373 & 4.0928 & 6.5e-05 \tabularnewline
13 & 0.396336 & 3.07 & 0.001607 \tabularnewline
14 & 0.231378 & 1.7922 & 0.039068 \tabularnewline
15 & 0.086009 & 0.6662 & 0.253911 \tabularnewline
16 & 0.006976 & 0.054 & 0.478542 \tabularnewline
17 & -0.017859 & -0.1383 & 0.445218 \tabularnewline
18 & -0.051976 & -0.4026 & 0.344334 \tabularnewline
19 & -0.07375 & -0.5713 & 0.284976 \tabularnewline
20 & -0.106438 & -0.8245 & 0.206471 \tabularnewline
21 & -0.097162 & -0.7526 & 0.227313 \tabularnewline
22 & -0.046131 & -0.3573 & 0.361048 \tabularnewline
23 & 0.023413 & 0.1814 & 0.42835 \tabularnewline
24 & 0.060195 & 0.4663 & 0.321355 \tabularnewline
25 & -0.0254 & -0.1967 & 0.422346 \tabularnewline
26 & -0.127749 & -0.9895 & 0.163187 \tabularnewline
27 & -0.209174 & -1.6203 & 0.055211 \tabularnewline
28 & -0.238172 & -1.8449 & 0.034997 \tabularnewline
29 & -0.237803 & -1.842 & 0.035208 \tabularnewline
30 & -0.254155 & -1.9687 & 0.026807 \tabularnewline
31 & -0.268369 & -2.0788 & 0.020961 \tabularnewline
32 & -0.295001 & -2.2851 & 0.012929 \tabularnewline
33 & -0.289872 & -2.2453 & 0.014222 \tabularnewline
34 & -0.260895 & -2.0209 & 0.023881 \tabularnewline
35 & -0.206379 & -1.5986 & 0.057581 \tabularnewline
36 & -0.16377 & -1.2686 & 0.104749 \tabularnewline
37 & -0.200478 & -1.5529 & 0.062853 \tabularnewline
38 & -0.250735 & -1.9422 & 0.028407 \tabularnewline
39 & -0.279973 & -2.1687 & 0.017042 \tabularnewline
40 & -0.275708 & -2.1356 & 0.0184 \tabularnewline
41 & -0.259594 & -2.0108 & 0.024423 \tabularnewline
42 & -0.263539 & -2.0414 & 0.02281 \tabularnewline
43 & -0.259322 & -2.0087 & 0.024538 \tabularnewline
44 & -0.269303 & -2.086 & 0.020619 \tabularnewline
45 & -0.260039 & -2.0143 & 0.024236 \tabularnewline
46 & -0.233585 & -1.8093 & 0.037704 \tabularnewline
47 & -0.18933 & -1.4665 & 0.073861 \tabularnewline
48 & -0.150283 & -1.1641 & 0.124499 \tabularnewline
49 & -0.151066 & -1.1702 & 0.123283 \tabularnewline
50 & -0.15231 & -1.1798 & 0.121371 \tabularnewline
51 & -0.140469 & -1.0881 & 0.140458 \tabularnewline
52 & -0.109216 & -0.846 & 0.200461 \tabularnewline
53 & -0.07804 & -0.6045 & 0.273898 \tabularnewline
54 & -0.061027 & -0.4727 & 0.319067 \tabularnewline
55 & -0.04286 & -0.332 & 0.370527 \tabularnewline
56 & -0.040613 & -0.3146 & 0.377084 \tabularnewline
57 & -0.036219 & -0.2806 & 0.39001 \tabularnewline
58 & -0.030398 & -0.2355 & 0.407327 \tabularnewline
59 & -0.016694 & -0.1293 & 0.448771 \tabularnewline
60 & NA & NA & NA \tabularnewline
\hline
\end{tabular}
%Source: https://freestatistics.org/blog/index.php?pk=36415&T=1

[TABLE]
[ROW][C]Autocorrelation Function[/C][/ROW]
[ROW][C]Time lag k[/C][C]ACF(k)[/C][C]T-STAT[/C][C]P-value[/C][/ROW]
[ROW][C]1[/C][C]0.862258[/C][C]6.679[/C][C]0[/C][/ROW]
[ROW][C]2[/C][C]0.663711[/C][C]5.1411[/C][C]2e-06[/C][/ROW]
[ROW][C]3[/C][C]0.489153[/C][C]3.789[/C][C]0.000176[/C][/ROW]
[ROW][C]4[/C][C]0.3894[/C][C]3.0163[/C][C]0.001875[/C][/ROW]
[ROW][C]5[/C][C]0.364379[/C][C]2.8225[/C][C]0.003228[/C][/ROW]
[ROW][C]6[/C][C]0.339456[/C][C]2.6294[/C][C]0.005425[/C][/ROW]
[ROW][C]7[/C][C]0.319894[/C][C]2.4779[/C][C]0.008024[/C][/ROW]
[ROW][C]8[/C][C]0.289792[/C][C]2.2447[/C][C]0.014243[/C][/ROW]
[ROW][C]9[/C][C]0.308293[/C][C]2.388[/C][C]0.010052[/C][/ROW]
[ROW][C]10[/C][C]0.381396[/C][C]2.9543[/C][C]0.002236[/C][/ROW]
[ROW][C]11[/C][C]0.480442[/C][C]3.7215[/C][C]0.000219[/C][/ROW]
[ROW][C]12[/C][C]0.528373[/C][C]4.0928[/C][C]6.5e-05[/C][/ROW]
[ROW][C]13[/C][C]0.396336[/C][C]3.07[/C][C]0.001607[/C][/ROW]
[ROW][C]14[/C][C]0.231378[/C][C]1.7922[/C][C]0.039068[/C][/ROW]
[ROW][C]15[/C][C]0.086009[/C][C]0.6662[/C][C]0.253911[/C][/ROW]
[ROW][C]16[/C][C]0.006976[/C][C]0.054[/C][C]0.478542[/C][/ROW]
[ROW][C]17[/C][C]-0.017859[/C][C]-0.1383[/C][C]0.445218[/C][/ROW]
[ROW][C]18[/C][C]-0.051976[/C][C]-0.4026[/C][C]0.344334[/C][/ROW]
[ROW][C]19[/C][C]-0.07375[/C][C]-0.5713[/C][C]0.284976[/C][/ROW]
[ROW][C]20[/C][C]-0.106438[/C][C]-0.8245[/C][C]0.206471[/C][/ROW]
[ROW][C]21[/C][C]-0.097162[/C][C]-0.7526[/C][C]0.227313[/C][/ROW]
[ROW][C]22[/C][C]-0.046131[/C][C]-0.3573[/C][C]0.361048[/C][/ROW]
[ROW][C]23[/C][C]0.023413[/C][C]0.1814[/C][C]0.42835[/C][/ROW]
[ROW][C]24[/C][C]0.060195[/C][C]0.4663[/C][C]0.321355[/C][/ROW]
[ROW][C]25[/C][C]-0.0254[/C][C]-0.1967[/C][C]0.422346[/C][/ROW]
[ROW][C]26[/C][C]-0.127749[/C][C]-0.9895[/C][C]0.163187[/C][/ROW]
[ROW][C]27[/C][C]-0.209174[/C][C]-1.6203[/C][C]0.055211[/C][/ROW]
[ROW][C]28[/C][C]-0.238172[/C][C]-1.8449[/C][C]0.034997[/C][/ROW]
[ROW][C]29[/C][C]-0.237803[/C][C]-1.842[/C][C]0.035208[/C][/ROW]
[ROW][C]30[/C][C]-0.254155[/C][C]-1.9687[/C][C]0.026807[/C][/ROW]
[ROW][C]31[/C][C]-0.268369[/C][C]-2.0788[/C][C]0.020961[/C][/ROW]
[ROW][C]32[/C][C]-0.295001[/C][C]-2.2851[/C][C]0.012929[/C][/ROW]
[ROW][C]33[/C][C]-0.289872[/C][C]-2.2453[/C][C]0.014222[/C][/ROW]
[ROW][C]34[/C][C]-0.260895[/C][C]-2.0209[/C][C]0.023881[/C][/ROW]
[ROW][C]35[/C][C]-0.206379[/C][C]-1.5986[/C][C]0.057581[/C][/ROW]
[ROW][C]36[/C][C]-0.16377[/C][C]-1.2686[/C][C]0.104749[/C][/ROW]
[ROW][C]37[/C][C]-0.200478[/C][C]-1.5529[/C][C]0.062853[/C][/ROW]
[ROW][C]38[/C][C]-0.250735[/C][C]-1.9422[/C][C]0.028407[/C][/ROW]
[ROW][C]39[/C][C]-0.279973[/C][C]-2.1687[/C][C]0.017042[/C][/ROW]
[ROW][C]40[/C][C]-0.275708[/C][C]-2.1356[/C][C]0.0184[/C][/ROW]
[ROW][C]41[/C][C]-0.259594[/C][C]-2.0108[/C][C]0.024423[/C][/ROW]
[ROW][C]42[/C][C]-0.263539[/C][C]-2.0414[/C][C]0.02281[/C][/ROW]
[ROW][C]43[/C][C]-0.259322[/C][C]-2.0087[/C][C]0.024538[/C][/ROW]
[ROW][C]44[/C][C]-0.269303[/C][C]-2.086[/C][C]0.020619[/C][/ROW]
[ROW][C]45[/C][C]-0.260039[/C][C]-2.0143[/C][C]0.024236[/C][/ROW]
[ROW][C]46[/C][C]-0.233585[/C][C]-1.8093[/C][C]0.037704[/C][/ROW]
[ROW][C]47[/C][C]-0.18933[/C][C]-1.4665[/C][C]0.073861[/C][/ROW]
[ROW][C]48[/C][C]-0.150283[/C][C]-1.1641[/C][C]0.124499[/C][/ROW]
[ROW][C]49[/C][C]-0.151066[/C][C]-1.1702[/C][C]0.123283[/C][/ROW]
[ROW][C]50[/C][C]-0.15231[/C][C]-1.1798[/C][C]0.121371[/C][/ROW]
[ROW][C]51[/C][C]-0.140469[/C][C]-1.0881[/C][C]0.140458[/C][/ROW]
[ROW][C]52[/C][C]-0.109216[/C][C]-0.846[/C][C]0.200461[/C][/ROW]
[ROW][C]53[/C][C]-0.07804[/C][C]-0.6045[/C][C]0.273898[/C][/ROW]
[ROW][C]54[/C][C]-0.061027[/C][C]-0.4727[/C][C]0.319067[/C][/ROW]
[ROW][C]55[/C][C]-0.04286[/C][C]-0.332[/C][C]0.370527[/C][/ROW]
[ROW][C]56[/C][C]-0.040613[/C][C]-0.3146[/C][C]0.377084[/C][/ROW]
[ROW][C]57[/C][C]-0.036219[/C][C]-0.2806[/C][C]0.39001[/C][/ROW]
[ROW][C]58[/C][C]-0.030398[/C][C]-0.2355[/C][C]0.407327[/C][/ROW]
[ROW][C]59[/C][C]-0.016694[/C][C]-0.1293[/C][C]0.448771[/C][/ROW]
[ROW][C]60[/C][C]NA[/C][C]NA[/C][C]NA[/C][/ROW]
[/TABLE]
Source: https://freestatistics.org/blog/index.php?pk=36415&T=1

Globally Unique Identifier (entire table): ba.freestatistics.org/blog/index.php?pk=36415&T=1

As an alternative you can also use a QR Code:  

The GUIDs for individual cells are displayed in the table below:

Autocorrelation Function
Time lag kACF(k)T-STATP-value
10.8622586.6790
20.6637115.14112e-06
30.4891533.7890.000176
40.38943.01630.001875
50.3643792.82250.003228
60.3394562.62940.005425
70.3198942.47790.008024
80.2897922.24470.014243
90.3082932.3880.010052
100.3813962.95430.002236
110.4804423.72150.000219
120.5283734.09286.5e-05
130.3963363.070.001607
140.2313781.79220.039068
150.0860090.66620.253911
160.0069760.0540.478542
17-0.017859-0.13830.445218
18-0.051976-0.40260.344334
19-0.07375-0.57130.284976
20-0.106438-0.82450.206471
21-0.097162-0.75260.227313
22-0.046131-0.35730.361048
230.0234130.18140.42835
240.0601950.46630.321355
25-0.0254-0.19670.422346
26-0.127749-0.98950.163187
27-0.209174-1.62030.055211
28-0.238172-1.84490.034997
29-0.237803-1.8420.035208
30-0.254155-1.96870.026807
31-0.268369-2.07880.020961
32-0.295001-2.28510.012929
33-0.289872-2.24530.014222
34-0.260895-2.02090.023881
35-0.206379-1.59860.057581
36-0.16377-1.26860.104749
37-0.200478-1.55290.062853
38-0.250735-1.94220.028407
39-0.279973-2.16870.017042
40-0.275708-2.13560.0184
41-0.259594-2.01080.024423
42-0.263539-2.04140.02281
43-0.259322-2.00870.024538
44-0.269303-2.0860.020619
45-0.260039-2.01430.024236
46-0.233585-1.80930.037704
47-0.18933-1.46650.073861
48-0.150283-1.16410.124499
49-0.151066-1.17020.123283
50-0.15231-1.17980.121371
51-0.140469-1.08810.140458
52-0.109216-0.8460.200461
53-0.07804-0.60450.273898
54-0.061027-0.47270.319067
55-0.04286-0.3320.370527
56-0.040613-0.31460.377084
57-0.036219-0.28060.39001
58-0.030398-0.23550.407327
59-0.016694-0.12930.448771
60NANANA


Partial Autocorrelation Function
Time lag kPACF(k)T-STATP-value
10.8622586.6790
2-0.311014-2.40910.009539
30.0304130.23560.40728
40.1504921.16570.124173
50.1313621.01750.156495
6-0.10783-0.83520.203446
70.0935480.72460.235752
8-0.003998-0.0310.4877
90.2426751.87980.0325
100.1697331.31470.096799
110.1669431.29310.10046
12-0.097063-0.75180.227542
13-0.548648-4.24983.8e-05
140.1503911.16490.12433
15-0.045391-0.35160.363187
16-0.06822-0.52840.299574
17-0.123015-0.95290.172239
18-0.075826-0.58730.279588
190.0559490.43340.333147
20-0.049224-0.38130.352169
210.0075370.05840.476818
22-0.036854-0.28550.388133
23-0.018819-0.14580.442295
240.0646680.50090.309132
25-0.045691-0.35390.362321
260.0105750.08190.467494
270.0362710.2810.389857
28-0.015768-0.12210.4516
29-0.039817-0.30840.379417
30-0.018746-0.14520.442517
31-0.059894-0.46390.322187
32-0.02341-0.18130.428359
33-0.066329-0.51380.304645
34-0.08322-0.64460.260817
350.0483280.37440.354732
360.0094080.07290.471075
37-0.008777-0.0680.473012
38-0.079861-0.61860.26926
390.0790550.61240.271308
40-0.039433-0.30540.380543
41-0.017769-0.13760.445493
42-0.013652-0.10580.458066
430.0779440.60370.274144
44-0.070255-0.54420.294163
45-0.004248-0.03290.486929
460.0294070.22780.410294
47-0.061036-0.47280.319043
48-0.025469-0.19730.422136
490.0987750.76510.223602
500.0171080.13250.447508
51-0.051563-0.39940.345507
520.0265080.20530.419005
530.0618360.4790.316846
540.0466420.36130.359578
55-0.047206-0.36570.357953
560.0208550.16150.436105
57-0.048515-0.37580.354197
58-0.031786-0.24620.403179
59-0.018825-0.14580.442278
60NANANA

\begin{tabular}{lllllllll}
\hline
Partial Autocorrelation Function \tabularnewline
Time lag k & PACF(k) & T-STAT & P-value \tabularnewline
1 & 0.862258 & 6.679 & 0 \tabularnewline
2 & -0.311014 & -2.4091 & 0.009539 \tabularnewline
3 & 0.030413 & 0.2356 & 0.40728 \tabularnewline
4 & 0.150492 & 1.1657 & 0.124173 \tabularnewline
5 & 0.131362 & 1.0175 & 0.156495 \tabularnewline
6 & -0.10783 & -0.8352 & 0.203446 \tabularnewline
7 & 0.093548 & 0.7246 & 0.235752 \tabularnewline
8 & -0.003998 & -0.031 & 0.4877 \tabularnewline
9 & 0.242675 & 1.8798 & 0.0325 \tabularnewline
10 & 0.169733 & 1.3147 & 0.096799 \tabularnewline
11 & 0.166943 & 1.2931 & 0.10046 \tabularnewline
12 & -0.097063 & -0.7518 & 0.227542 \tabularnewline
13 & -0.548648 & -4.2498 & 3.8e-05 \tabularnewline
14 & 0.150391 & 1.1649 & 0.12433 \tabularnewline
15 & -0.045391 & -0.3516 & 0.363187 \tabularnewline
16 & -0.06822 & -0.5284 & 0.299574 \tabularnewline
17 & -0.123015 & -0.9529 & 0.172239 \tabularnewline
18 & -0.075826 & -0.5873 & 0.279588 \tabularnewline
19 & 0.055949 & 0.4334 & 0.333147 \tabularnewline
20 & -0.049224 & -0.3813 & 0.352169 \tabularnewline
21 & 0.007537 & 0.0584 & 0.476818 \tabularnewline
22 & -0.036854 & -0.2855 & 0.388133 \tabularnewline
23 & -0.018819 & -0.1458 & 0.442295 \tabularnewline
24 & 0.064668 & 0.5009 & 0.309132 \tabularnewline
25 & -0.045691 & -0.3539 & 0.362321 \tabularnewline
26 & 0.010575 & 0.0819 & 0.467494 \tabularnewline
27 & 0.036271 & 0.281 & 0.389857 \tabularnewline
28 & -0.015768 & -0.1221 & 0.4516 \tabularnewline
29 & -0.039817 & -0.3084 & 0.379417 \tabularnewline
30 & -0.018746 & -0.1452 & 0.442517 \tabularnewline
31 & -0.059894 & -0.4639 & 0.322187 \tabularnewline
32 & -0.02341 & -0.1813 & 0.428359 \tabularnewline
33 & -0.066329 & -0.5138 & 0.304645 \tabularnewline
34 & -0.08322 & -0.6446 & 0.260817 \tabularnewline
35 & 0.048328 & 0.3744 & 0.354732 \tabularnewline
36 & 0.009408 & 0.0729 & 0.471075 \tabularnewline
37 & -0.008777 & -0.068 & 0.473012 \tabularnewline
38 & -0.079861 & -0.6186 & 0.26926 \tabularnewline
39 & 0.079055 & 0.6124 & 0.271308 \tabularnewline
40 & -0.039433 & -0.3054 & 0.380543 \tabularnewline
41 & -0.017769 & -0.1376 & 0.445493 \tabularnewline
42 & -0.013652 & -0.1058 & 0.458066 \tabularnewline
43 & 0.077944 & 0.6037 & 0.274144 \tabularnewline
44 & -0.070255 & -0.5442 & 0.294163 \tabularnewline
45 & -0.004248 & -0.0329 & 0.486929 \tabularnewline
46 & 0.029407 & 0.2278 & 0.410294 \tabularnewline
47 & -0.061036 & -0.4728 & 0.319043 \tabularnewline
48 & -0.025469 & -0.1973 & 0.422136 \tabularnewline
49 & 0.098775 & 0.7651 & 0.223602 \tabularnewline
50 & 0.017108 & 0.1325 & 0.447508 \tabularnewline
51 & -0.051563 & -0.3994 & 0.345507 \tabularnewline
52 & 0.026508 & 0.2053 & 0.419005 \tabularnewline
53 & 0.061836 & 0.479 & 0.316846 \tabularnewline
54 & 0.046642 & 0.3613 & 0.359578 \tabularnewline
55 & -0.047206 & -0.3657 & 0.357953 \tabularnewline
56 & 0.020855 & 0.1615 & 0.436105 \tabularnewline
57 & -0.048515 & -0.3758 & 0.354197 \tabularnewline
58 & -0.031786 & -0.2462 & 0.403179 \tabularnewline
59 & -0.018825 & -0.1458 & 0.442278 \tabularnewline
60 & NA & NA & NA \tabularnewline
\hline
\end{tabular}
%Source: https://freestatistics.org/blog/index.php?pk=36415&T=2

[TABLE]
[ROW][C]Partial Autocorrelation Function[/C][/ROW]
[ROW][C]Time lag k[/C][C]PACF(k)[/C][C]T-STAT[/C][C]P-value[/C][/ROW]
[ROW][C]1[/C][C]0.862258[/C][C]6.679[/C][C]0[/C][/ROW]
[ROW][C]2[/C][C]-0.311014[/C][C]-2.4091[/C][C]0.009539[/C][/ROW]
[ROW][C]3[/C][C]0.030413[/C][C]0.2356[/C][C]0.40728[/C][/ROW]
[ROW][C]4[/C][C]0.150492[/C][C]1.1657[/C][C]0.124173[/C][/ROW]
[ROW][C]5[/C][C]0.131362[/C][C]1.0175[/C][C]0.156495[/C][/ROW]
[ROW][C]6[/C][C]-0.10783[/C][C]-0.8352[/C][C]0.203446[/C][/ROW]
[ROW][C]7[/C][C]0.093548[/C][C]0.7246[/C][C]0.235752[/C][/ROW]
[ROW][C]8[/C][C]-0.003998[/C][C]-0.031[/C][C]0.4877[/C][/ROW]
[ROW][C]9[/C][C]0.242675[/C][C]1.8798[/C][C]0.0325[/C][/ROW]
[ROW][C]10[/C][C]0.169733[/C][C]1.3147[/C][C]0.096799[/C][/ROW]
[ROW][C]11[/C][C]0.166943[/C][C]1.2931[/C][C]0.10046[/C][/ROW]
[ROW][C]12[/C][C]-0.097063[/C][C]-0.7518[/C][C]0.227542[/C][/ROW]
[ROW][C]13[/C][C]-0.548648[/C][C]-4.2498[/C][C]3.8e-05[/C][/ROW]
[ROW][C]14[/C][C]0.150391[/C][C]1.1649[/C][C]0.12433[/C][/ROW]
[ROW][C]15[/C][C]-0.045391[/C][C]-0.3516[/C][C]0.363187[/C][/ROW]
[ROW][C]16[/C][C]-0.06822[/C][C]-0.5284[/C][C]0.299574[/C][/ROW]
[ROW][C]17[/C][C]-0.123015[/C][C]-0.9529[/C][C]0.172239[/C][/ROW]
[ROW][C]18[/C][C]-0.075826[/C][C]-0.5873[/C][C]0.279588[/C][/ROW]
[ROW][C]19[/C][C]0.055949[/C][C]0.4334[/C][C]0.333147[/C][/ROW]
[ROW][C]20[/C][C]-0.049224[/C][C]-0.3813[/C][C]0.352169[/C][/ROW]
[ROW][C]21[/C][C]0.007537[/C][C]0.0584[/C][C]0.476818[/C][/ROW]
[ROW][C]22[/C][C]-0.036854[/C][C]-0.2855[/C][C]0.388133[/C][/ROW]
[ROW][C]23[/C][C]-0.018819[/C][C]-0.1458[/C][C]0.442295[/C][/ROW]
[ROW][C]24[/C][C]0.064668[/C][C]0.5009[/C][C]0.309132[/C][/ROW]
[ROW][C]25[/C][C]-0.045691[/C][C]-0.3539[/C][C]0.362321[/C][/ROW]
[ROW][C]26[/C][C]0.010575[/C][C]0.0819[/C][C]0.467494[/C][/ROW]
[ROW][C]27[/C][C]0.036271[/C][C]0.281[/C][C]0.389857[/C][/ROW]
[ROW][C]28[/C][C]-0.015768[/C][C]-0.1221[/C][C]0.4516[/C][/ROW]
[ROW][C]29[/C][C]-0.039817[/C][C]-0.3084[/C][C]0.379417[/C][/ROW]
[ROW][C]30[/C][C]-0.018746[/C][C]-0.1452[/C][C]0.442517[/C][/ROW]
[ROW][C]31[/C][C]-0.059894[/C][C]-0.4639[/C][C]0.322187[/C][/ROW]
[ROW][C]32[/C][C]-0.02341[/C][C]-0.1813[/C][C]0.428359[/C][/ROW]
[ROW][C]33[/C][C]-0.066329[/C][C]-0.5138[/C][C]0.304645[/C][/ROW]
[ROW][C]34[/C][C]-0.08322[/C][C]-0.6446[/C][C]0.260817[/C][/ROW]
[ROW][C]35[/C][C]0.048328[/C][C]0.3744[/C][C]0.354732[/C][/ROW]
[ROW][C]36[/C][C]0.009408[/C][C]0.0729[/C][C]0.471075[/C][/ROW]
[ROW][C]37[/C][C]-0.008777[/C][C]-0.068[/C][C]0.473012[/C][/ROW]
[ROW][C]38[/C][C]-0.079861[/C][C]-0.6186[/C][C]0.26926[/C][/ROW]
[ROW][C]39[/C][C]0.079055[/C][C]0.6124[/C][C]0.271308[/C][/ROW]
[ROW][C]40[/C][C]-0.039433[/C][C]-0.3054[/C][C]0.380543[/C][/ROW]
[ROW][C]41[/C][C]-0.017769[/C][C]-0.1376[/C][C]0.445493[/C][/ROW]
[ROW][C]42[/C][C]-0.013652[/C][C]-0.1058[/C][C]0.458066[/C][/ROW]
[ROW][C]43[/C][C]0.077944[/C][C]0.6037[/C][C]0.274144[/C][/ROW]
[ROW][C]44[/C][C]-0.070255[/C][C]-0.5442[/C][C]0.294163[/C][/ROW]
[ROW][C]45[/C][C]-0.004248[/C][C]-0.0329[/C][C]0.486929[/C][/ROW]
[ROW][C]46[/C][C]0.029407[/C][C]0.2278[/C][C]0.410294[/C][/ROW]
[ROW][C]47[/C][C]-0.061036[/C][C]-0.4728[/C][C]0.319043[/C][/ROW]
[ROW][C]48[/C][C]-0.025469[/C][C]-0.1973[/C][C]0.422136[/C][/ROW]
[ROW][C]49[/C][C]0.098775[/C][C]0.7651[/C][C]0.223602[/C][/ROW]
[ROW][C]50[/C][C]0.017108[/C][C]0.1325[/C][C]0.447508[/C][/ROW]
[ROW][C]51[/C][C]-0.051563[/C][C]-0.3994[/C][C]0.345507[/C][/ROW]
[ROW][C]52[/C][C]0.026508[/C][C]0.2053[/C][C]0.419005[/C][/ROW]
[ROW][C]53[/C][C]0.061836[/C][C]0.479[/C][C]0.316846[/C][/ROW]
[ROW][C]54[/C][C]0.046642[/C][C]0.3613[/C][C]0.359578[/C][/ROW]
[ROW][C]55[/C][C]-0.047206[/C][C]-0.3657[/C][C]0.357953[/C][/ROW]
[ROW][C]56[/C][C]0.020855[/C][C]0.1615[/C][C]0.436105[/C][/ROW]
[ROW][C]57[/C][C]-0.048515[/C][C]-0.3758[/C][C]0.354197[/C][/ROW]
[ROW][C]58[/C][C]-0.031786[/C][C]-0.2462[/C][C]0.403179[/C][/ROW]
[ROW][C]59[/C][C]-0.018825[/C][C]-0.1458[/C][C]0.442278[/C][/ROW]
[ROW][C]60[/C][C]NA[/C][C]NA[/C][C]NA[/C][/ROW]
[/TABLE]
Source: https://freestatistics.org/blog/index.php?pk=36415&T=2

Globally Unique Identifier (entire table): ba.freestatistics.org/blog/index.php?pk=36415&T=2

As an alternative you can also use a QR Code:  

The GUIDs for individual cells are displayed in the table below:

Partial Autocorrelation Function
Time lag kPACF(k)T-STATP-value
10.8622586.6790
2-0.311014-2.40910.009539
30.0304130.23560.40728
40.1504921.16570.124173
50.1313621.01750.156495
6-0.10783-0.83520.203446
70.0935480.72460.235752
8-0.003998-0.0310.4877
90.2426751.87980.0325
100.1697331.31470.096799
110.1669431.29310.10046
12-0.097063-0.75180.227542
13-0.548648-4.24983.8e-05
140.1503911.16490.12433
15-0.045391-0.35160.363187
16-0.06822-0.52840.299574
17-0.123015-0.95290.172239
18-0.075826-0.58730.279588
190.0559490.43340.333147
20-0.049224-0.38130.352169
210.0075370.05840.476818
22-0.036854-0.28550.388133
23-0.018819-0.14580.442295
240.0646680.50090.309132
25-0.045691-0.35390.362321
260.0105750.08190.467494
270.0362710.2810.389857
28-0.015768-0.12210.4516
29-0.039817-0.30840.379417
30-0.018746-0.14520.442517
31-0.059894-0.46390.322187
32-0.02341-0.18130.428359
33-0.066329-0.51380.304645
34-0.08322-0.64460.260817
350.0483280.37440.354732
360.0094080.07290.471075
37-0.008777-0.0680.473012
38-0.079861-0.61860.26926
390.0790550.61240.271308
40-0.039433-0.30540.380543
41-0.017769-0.13760.445493
42-0.013652-0.10580.458066
430.0779440.60370.274144
44-0.070255-0.54420.294163
45-0.004248-0.03290.486929
460.0294070.22780.410294
47-0.061036-0.47280.319043
48-0.025469-0.19730.422136
490.0987750.76510.223602
500.0171080.13250.447508
51-0.051563-0.39940.345507
520.0265080.20530.419005
530.0618360.4790.316846
540.0466420.36130.359578
55-0.047206-0.36570.357953
560.0208550.16150.436105
57-0.048515-0.37580.354197
58-0.031786-0.24620.403179
59-0.018825-0.14580.442278
60NANANA


Parameters (Session):
par1 = 60 ; par2 = 1 ; par3 = 0 ; par4 = 0 ; par5 = 12 ;
Parameters (R input):
par1 = 60 ; par2 = 1 ; par3 = 0 ; par4 = 0 ; par5 = 12 ;
R code (references can be found in the software module):
if (par1 == 'Default') {
par1 = 10*log10(length(x))
} else {
par1 <- as.numeric(par1)
}
par2 <- as.numeric(par2)
par3 <- as.numeric(par3)
par4 <- as.numeric(par4)
par5 <- as.numeric(par5)
if (par2 == 0) {
x <- log(x)
} else {
x <- (x ^ par2 - 1) / par2
}
if (par3 > 0) x <- diff(x,lag=1,difference=par3)
if (par4 > 0) x <- diff(x,lag=par5,difference=par4)
bitmap(file='pic1.png')
racf <- acf(x,par1,main='Autocorrelation',xlab='lags',ylab='ACF')
dev.off()
bitmap(file='pic2.png')
rpacf <- pacf(x,par1,main='Partial Autocorrelation',xlab='lags',ylab='PACF')
dev.off()
(myacf <- c(racf$acf))
(mypacf <- c(rpacf$acf))
lengthx <- length(x)
sqrtn <- sqrt(lengthx)
load(file='createtable')
a<-table.start()
a<-table.row.start(a)
a<-table.element(a,'Autocorrelation Function',4,TRUE)
a<-table.row.end(a)
a<-table.row.start(a)
a<-table.element(a,'Time lag k',header=TRUE)
a<-table.element(a,hyperlink('basics.htm','ACF(k)','click here for more information about the Autocorrelation Function'),header=TRUE)
a<-table.element(a,'T-STAT',header=TRUE)
a<-table.element(a,'P-value',header=TRUE)
a<-table.row.end(a)
for (i in 2:(par1+1)) {
a<-table.row.start(a)
a<-table.element(a,i-1,header=TRUE)
a<-table.element(a,round(myacf[i],6))
mytstat <- myacf[i]*sqrtn
a<-table.element(a,round(mytstat,4))
a<-table.element(a,round(1-pt(abs(mytstat),lengthx),6))
a<-table.row.end(a)
}
a<-table.end(a)
table.save(a,file='mytable.tab')
a<-table.start()
a<-table.row.start(a)
a<-table.element(a,'Partial Autocorrelation Function',4,TRUE)
a<-table.row.end(a)
a<-table.row.start(a)
a<-table.element(a,'Time lag k',header=TRUE)
a<-table.element(a,hyperlink('basics.htm','PACF(k)','click here for more information about the Partial Autocorrelation Function'),header=TRUE)
a<-table.element(a,'T-STAT',header=TRUE)
a<-table.element(a,'P-value',header=TRUE)
a<-table.row.end(a)
for (i in 1:par1) {
a<-table.row.start(a)
a<-table.element(a,i,header=TRUE)
a<-table.element(a,round(mypacf[i],6))
mytstat <- mypacf[i]*sqrtn
a<-table.element(a,round(mytstat,4))
a<-table.element(a,round(1-pt(abs(mytstat),lengthx),6))
a<-table.row.end(a)
}
a<-table.end(a)
table.save(a,file='mytable1.tab')