Free Statistics
of Irreproducible Research!
Description of Statistical Computation | |||||||||||||||||||||||||||||||||||||||||
|---|---|---|---|---|---|---|---|---|---|---|---|---|---|---|---|---|---|---|---|---|---|---|---|---|---|---|---|---|---|---|---|---|---|---|---|---|---|---|---|---|---|
| Author's title | |||||||||||||||||||||||||||||||||||||||||
| Author | *Unverified author* | ||||||||||||||||||||||||||||||||||||||||
| R Software Module | rwasp_univariatedataseries.wasp | ||||||||||||||||||||||||||||||||||||||||
| Title produced by software | Univariate Data Series | ||||||||||||||||||||||||||||||||||||||||
| Date of computation | Sat, 05 Jan 2008 16:14:31 -0700 | ||||||||||||||||||||||||||||||||||||||||
| Cite this page as follows | Statistical Computations at FreeStatistics.org, Office for Research Development and Education, URL https://freestatistics.org/blog/index.php?v=date/2008/Jan/06/t1199574888xvrybp4pl7fyg1j.htm/, Retrieved Fri, 05 Jun 2026 18:31:56 +0000 | ||||||||||||||||||||||||||||||||||||||||
| Statistical Computations at FreeStatistics.org, Office for Research Development and Education, URL https://freestatistics.org/blog/index.php?pk=7780, Retrieved Fri, 05 Jun 2026 18:31:56 +0000 | |||||||||||||||||||||||||||||||||||||||||
| QR Codes: | |||||||||||||||||||||||||||||||||||||||||
|
| |||||||||||||||||||||||||||||||||||||||||
| Original text written by user: | |||||||||||||||||||||||||||||||||||||||||
| IsPrivate? | No (this computation is public) | ||||||||||||||||||||||||||||||||||||||||
| User-defined keywords | time series, arabica, colombia, tutorial | ||||||||||||||||||||||||||||||||||||||||
| Estimated Impact | 1934 | ||||||||||||||||||||||||||||||||||||||||
Tree of Dependent Computations | |||||||||||||||||||||||||||||||||||||||||
| Family? (F = Feedback message, R = changed R code, M = changed R Module, P = changed Parameters, D = changed Data) | |||||||||||||||||||||||||||||||||||||||||
| - [Univariate Data Series] [Arabica Price in ...] [2008-01-05 23:14:31] [d41d8cd98f00b204e9800998ecf8427e] [Current] - RMPD [Harrell-Davis Quantiles] [my better solution] [2008-04-17 17:46:15] [74be16979710d4c4e7c6647856088456] - RMPD [Harrell-Davis Quantiles] [my better solution 2] [2008-04-17 17:50:23] [74be16979710d4c4e7c6647856088456] F RMPD [Bivariate Kernel Density Estimation] [vraag 5] [2008-11-24 09:18:48] [c45c87b96bbf32ffc2144fc37d767b2e] - [Bivariate Kernel Density Estimation] [Extra toevoeging ...] [2008-12-01 16:52:07] [33f4701c7363e8b81858dafbf0350eed] - RMPD [Multiple Regression] [Toon Wouters] [2008-11-25 11:18:32] [6610d6fd8f463fb18a844c14dc2c3579] - RMPD [Multiple Regression] [Tutorial] [2008-11-26 19:51:36] [3548296885df7a66ea8efc200c4aca50] - PD [Univariate Data Series] [Tijdreeks 1 Buite...] [2008-12-11 16:10:45] [2d4aec5ed1856c4828162be37be304d9] - RMP [Central Tendency] [Central tendency ...] [2008-12-11 17:39:13] [2d4aec5ed1856c4828162be37be304d9] - RMP [Blocked Bootstrap Plot - Central Tendency] [Blocked Bootstrap...] [2008-12-12 08:11:26] [2d4aec5ed1856c4828162be37be304d9] - RMP [Histogram] [Histogram tijdree...] [2008-12-11 17:59:11] [2d4aec5ed1856c4828162be37be304d9] - R PD [Univariate Data Series] [Central Tendency ...] [2008-12-15 16:00:10] [7458e879e85b911182071700fff19fbd] - R PD [Univariate Data Series] [Central Tendency ...] [2008-12-15 16:00:10] [7458e879e85b911182071700fff19fbd] - PD [Univariate Data Series] [Bouwaanvragen] [2008-12-15 16:33:37] [7458e879e85b911182071700fff19fbd] - PD [Univariate Data Series] [Bouwaanvragen 31/...] [2008-12-15 16:05:32] [74be16979710d4c4e7c6647856088456] - PD [Univariate Data Series] [Sequency-plot Bou...] [2008-12-15 16:39:01] [74be16979710d4c4e7c6647856088456] - PD [Univariate Data Series] [Gemiddelde maande...] [2008-12-15 16:45:56] [74be16979710d4c4e7c6647856088456] - PD [Univariate Data Series] [Productie metaal ...] [2008-12-15 17:02:44] [74be16979710d4c4e7c6647856088456] - PD [Univariate Data Series] [werkloosheid] [2008-12-16 21:07:19] [c45c87b96bbf32ffc2144fc37d767b2e] - PD [Univariate Data Series] [Aantal bouwvergun...] [2008-12-16 21:13:02] [c45c87b96bbf32ffc2144fc37d767b2e] - RMPD [Standard Deviation-Mean Plot] [Paper ARIMA Forec...] [2008-12-16 22:31:46] [74be16979710d4c4e7c6647856088456] - RMPD [Variance Reduction Matrix] [Paper ARIMA Forec...] [2008-12-16 23:32:22] [74be16979710d4c4e7c6647856088456] - PD [Univariate Data Series] [werkloosheid vrouwen] [2008-12-18 10:06:48] [fe7291e888d31b8c4db0b24d6c0f75c6] - PD [Univariate Data Series] [werkloosheid vrouwen] [2008-12-18 10:11:30] [fe7291e888d31b8c4db0b24d6c0f75c6] - PD [Univariate Data Series] [werkloosheid totaal] [2008-12-18 10:14:01] [fe7291e888d31b8c4db0b24d6c0f75c6] - PD [Univariate Data Series] [werkloosheid mannen] [2008-12-18 10:17:26] [fe7291e888d31b8c4db0b24d6c0f75c6] - PD [Univariate Data Series] [economische toestand] [2008-12-18 10:22:07] [fe7291e888d31b8c4db0b24d6c0f75c6] - PD [Univariate Data Series] [totaal werkloosheid] [2008-12-18 11:08:18] [fe7291e888d31b8c4db0b24d6c0f75c6] - PD [Univariate Data Series] [werkloosheid vrouwen] [2008-12-18 11:15:34] [fe7291e888d31b8c4db0b24d6c0f75c6] - PD [Univariate Data Series] [werkloosheid mannen] [2008-12-18 11:19:04] [fe7291e888d31b8c4db0b24d6c0f75c6] - PD [Univariate Data Series] [Economische situatie] [2008-12-18 11:42:49] [fe7291e888d31b8c4db0b24d6c0f75c6] - R PD [Univariate Data Series] [Prod van metaal] [2008-12-19 09:14:42] [b187fac1a1b0cb3920f54366df47fea3] - PD [Univariate Data Series] [xxx] [2008-12-19 09:24:36] [b187fac1a1b0cb3920f54366df47fea3] - R PD [Univariate Data Series] [RSP - Machines ve...] [2008-12-20 13:25:29] [33f4701c7363e8b81858dafbf0350eed] - PD [Univariate Data Series] [RSP - Transportmi...] [2008-12-20 13:40:13] [33f4701c7363e8b81858dafbf0350eed] - D [Univariate Data Series] [RSP - Transportmi...] [2008-12-22 20:00:43] [b187fac1a1b0cb3920f54366df47fea3] - D [Univariate Data Series] [RSP - transportmi...] [2008-12-22 20:02:48] [b641c14ac36cb6fee377f3b099dcac19] - PD [Univariate Data Series] [RSP - Transportmi...] [2008-12-22 20:47:35] [b187fac1a1b0cb3920f54366df47fea3] - PD [Univariate Data Series] [RSP - Transportmi...] [2008-12-22 20:59:46] [33f4701c7363e8b81858dafbf0350eed] - D [Univariate Data Series] [RSP - Machines ve...] [2008-12-22 19:56:52] [b187fac1a1b0cb3920f54366df47fea3] - D [Univariate Data Series] [RSP - machines ve...] [2008-12-22 19:59:35] [b641c14ac36cb6fee377f3b099dcac19] - PD [Univariate Data Series] [RSP - Machines ve...] [2008-12-22 20:39:46] [b187fac1a1b0cb3920f54366df47fea3] - PD [Univariate Data Series] [Machines vervaard...] [2008-12-22 20:42:05] [b187fac1a1b0cb3920f54366df47fea3] - PD [Univariate Data Series] [RSP - Machines ve...] [2008-12-22 20:55:24] [33f4701c7363e8b81858dafbf0350eed] - RMPD [Univariate Data Series] [US Car sales] [2010-11-06 12:59:49] [97ad38b1c3b35a5feca8b85f7bc7b3ff] - PD [Univariate Data Series] [US Gasoline Sales] [2010-11-06 13:09:53] [97ad38b1c3b35a5feca8b85f7bc7b3ff] - R P [Univariate Data Series] [] [2011-11-15 18:58:09] [9401a40688cf36283be626153bc5a38b] - R P [Univariate Data Series] [] [2011-11-15 20:57:02] [ec2187f7727da5d5d939740b21b8b68a] - R P [Univariate Data Series] [Paper - Toetsen v...] [2011-12-11 12:41:52] [69d59b79aaf660457acc70a0ef0bfdab] [Truncated] | |||||||||||||||||||||||||||||||||||||||||
| Feedback Forum | |||||||||||||||||||||||||||||||||||||||||
Post a new message | |||||||||||||||||||||||||||||||||||||||||
Dataset | |||||||||||||||||||||||||||||||||||||||||
| Dataseries X: | |||||||||||||||||||||||||||||||||||||||||
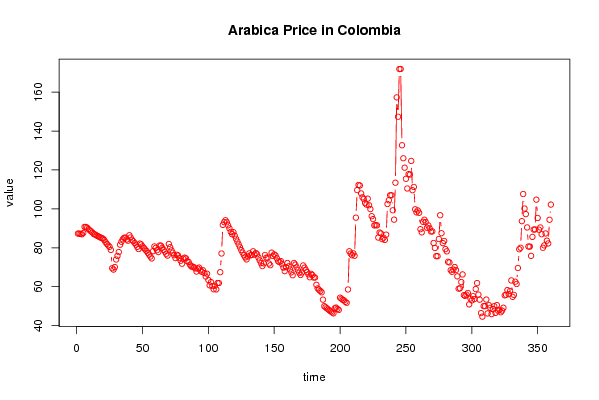
87.28 87.28 87.09 86.92 87.59 90.72 90.69 90.3 89.55 88.94 88.41 87.82 87.07 86.82 86.4 86.02 85.66 85.32 85 84.67 83.94 82.83 81.95 81.19 80.48 78.86 69.47 68.77 70.06 73.95 75.8 77.79 81.57 83.07 84.34 85.1 85.25 84.26 83.63 86.44 85.3 84.1 83.36 82.48 81.58 80.47 79.34 82.13 81.69 80.7 79.88 79.16 78.38 77.42 76.47 75.46 74.48 78.27 80.7 79.91 78.75 77.78 81.14 81.08 80.03 78.91 78.01 76.9 75.97 81.93 80.27 78.67 77.42 76.16 74.7 76.39 76.04 74.65 73.29 71.79 74.39 74.91 74.54 73.08 72.75 71.32 70.38 70.35 70.01 69.36 67.77 69.26 69.8 68.38 67.62 68.39 66.95 65.21 66.64 63.45 60.66 62.34 60.32 58.64 60.46 58.59 61.87 61.85 67.44 77.06 91.74 93.15 94.15 93.11 91.51 89.96 88.16 86.98 88.03 86.24 84.65 83.23 81.7 80.25 78.8 77.51 76.2 75.04 74 75.49 77.14 76.15 76.27 78.19 76.49 77.31 76.65 74.99 73.51 72.07 70.59 71.96 76.29 74.86 74.93 71.9 71.01 77.47 75.78 76.6 76.07 74.57 73.02 72.65 73.16 71.53 69.78 67.98 69.96 72.16 70.47 68.86 67.37 65.87 72.16 71.34 69.93 68.44 67.16 66.01 67.25 70.91 69.75 68.59 67.48 66.31 64.81 66.58 65.97 64.7 64.7 60.94 59.08 58.42 57.77 57.11 53.31 49.96 49.4 48.84 48.3 47.74 47.24 46.76 46.29 48.9 49.23 48.53 48.03 54.34 53.79 53.24 52.96 52.17 51.7 58.55 78.2 77.03 76.19 77.15 75.87 95.47 109.67 112.28 112.01 107.93 105.96 105.06 102.98 102.2 105.23 101.85 99.89 96.23 94.76 91.51 91.63 91.54 85.23 87.83 87.38 84.44 85.19 84.03 86.73 102.52 104.45 106.98 107.02 99.26 94.45 113.44 157.33 147.38 171.89 171.95 132.71 126.02 121.18 115.45 110.48 117.85 117.63 124.65 109.59 111.27 99.78 98.21 99.2 97.97 89.55 87.91 93.34 94.42 93.2 90.29 91.46 89.98 88.35 88.41 82.44 79.89 75.69 75.66 84.5 96.73 87.48 82.39 83.48 79.31 78.16 72.77 72.45 68.46 67.62 68.76 70.07 68.55 65.3 58.96 59.17 62.37 66.28 55.62 55.23 55.85 56.75 50.89 53.88 52.95 55.08 53.61 58.78 61.85 55.91 53.32 46.41 44.57 50 50 53.36 46.23 50.45 49.07 45.85 48.45 49.96 46.53 50.51 47.58 48.05 46.84 47.67 49.16 55.54 55.82 58.22 56.19 57.77 63.19 54.76 55.74 62.54 61.39 69.6 79.23 80 93.68 107.63 100.18 97.3 90.45 80.64 80.58 75.82 85.59 89.35 89.42 104.73 95.32 89.27 90.44 86.97 79.98 81.22 87.35 83.64 82.22 94.4 102.18 | |||||||||||||||||||||||||||||||||||||||||
Tables (Output of Computation) | |||||||||||||||||||||||||||||||||||||||||
| |||||||||||||||||||||||||||||||||||||||||
Figures (Output of Computation) | |||||||||||||||||||||||||||||||||||||||||
Input Parameters & R Code | |||||||||||||||||||||||||||||||||||||||||
| Parameters (Session): | |||||||||||||||||||||||||||||||||||||||||
| par1 = colombia ; par2 = www.ico.org ; par3 = Prices paid to growers in exporting Member countries in US cents per lb (Arabica, 1977/1 - 2006/12) ; | |||||||||||||||||||||||||||||||||||||||||
| Parameters (R input): | |||||||||||||||||||||||||||||||||||||||||
| par1 = colombia ; par2 = www.ico.org ; par3 = Prices paid to growers in exporting Member countries in US cents per lb (Arabica, 1977/1 - 2006/12) ; | |||||||||||||||||||||||||||||||||||||||||
| R code (references can be found in the software module): | |||||||||||||||||||||||||||||||||||||||||
bitmap(file='test1.png') | |||||||||||||||||||||||||||||||||||||||||