Free Statistics

of Irreproducible Research!

Author's title

Author*The author of this computation has been verified*
R Software Modulerwasp_multipleregression.wasp
Title produced by softwareMultiple Regression
Date of computationSun, 23 Nov 2008 11:24:38 -0700
Cite this page as followsStatistical Computations at FreeStatistics.org, Office for Research Development and Education, URL https://freestatistics.org/blog/index.php?v=date/2008/Nov/23/t1227464728uejufk2ikf4tgdv.htm/, Retrieved Sat, 25 May 2024 01:46:51 +0000
Statistical Computations at FreeStatistics.org, Office for Research Development and Education, URL https://freestatistics.org/blog/index.php?pk=25314, Retrieved Sat, 25 May 2024 01:46:51 +0000
QR Codes:

Original text written by user:
IsPrivate?No (this computation is public)
User-defined keywords
Estimated Impact144
Family? (F = Feedback message, R = changed R code, M = changed R Module, P = changed Parameters, D = changed Data)
-     [Multiple Regression] [q3] [2008-11-23 15:48:09] [c5a66f1c8528a963efc2b82a8519f117]
-   P   [Multiple Regression] [q3a] [2008-11-23 15:53:10] [c5a66f1c8528a963efc2b82a8519f117]
-   P     [Multiple Regression] [q3a] [2008-11-23 16:20:20] [c5a66f1c8528a963efc2b82a8519f117]
-    D      [Multiple Regression] [Q3 - a] [2008-11-23 18:07:18] [c5a66f1c8528a963efc2b82a8519f117]
F               [Multiple Regression] [Q3 - 5 peaks] [2008-11-23 18:24:38] [5f3e73ccf1ddc75508eed47fa51813d3] [Current]
- RMPD            [Central Tendency] [vraag 3] [2008-12-01 19:13:42] [c45c87b96bbf32ffc2144fc37d767b2e]
-    D            [Multiple Regression] [verbetering Q3 - ...] [2008-12-01 19:40:33] [a0d819c22534897f04a2f0b92f1eb36a]
Feedback Forum
2008-12-01 19:18:50 [Michaël De Kuyer] [reply
Het is een vrij goede analyse van de tijdreeks. Spijtig genoeg heb je geen verklaring voor de outliers. Hieronder volgen enkele opmerkingen:

- Je had nog kunnen vermelden dat het gemiddeld bouwvergunningen per maand 1527, + of - 87,53.
- Je zegt dat met de analyse van R-squared 54,06% duidt op een goed model. Naar mijn menig is dit percentage vrij laag.
- Ook hier dient opgemerkt te worden dat er een deterministische trend is, die steeds wil doorgaan. Dit is niet realistisch.
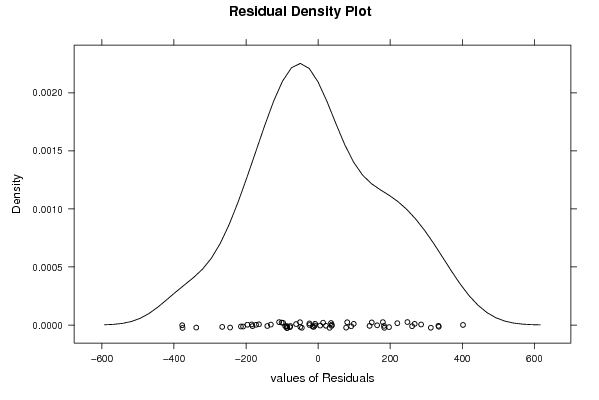
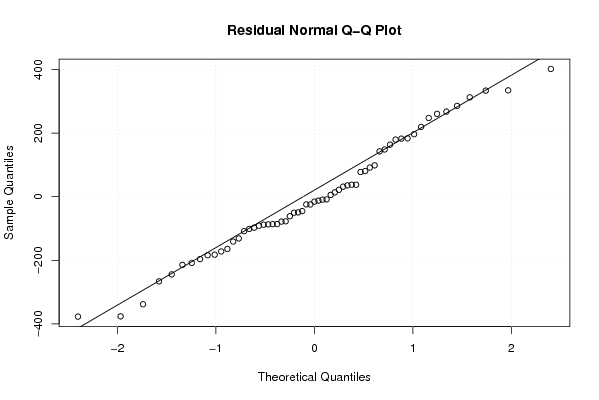
- De analyse van vaste component kon je nog kracht bijzetten door een analyse te doen van de residuals via central tendency: http://www.freestatistics.org/blog/date/2008/Dec/01/t1228158873d5hhk0wu1jac2fg.htm Aan de hand hiervan had je kunnen vaststellen dat bij de winsorized mean de nullijn niet volledig binnen het betrouwbaarheidsinterval ligt. Dit is ook zo bij de trimmed mean. We kunnen besluiten dat het gemiddelde van de residu's signifact verschillend zijn van nul. Bijgevolg is er geen sprake van een vaste component.
- De analyse van vaste verdeling is correct.
- Er is niet vermeld over vaste variantie.
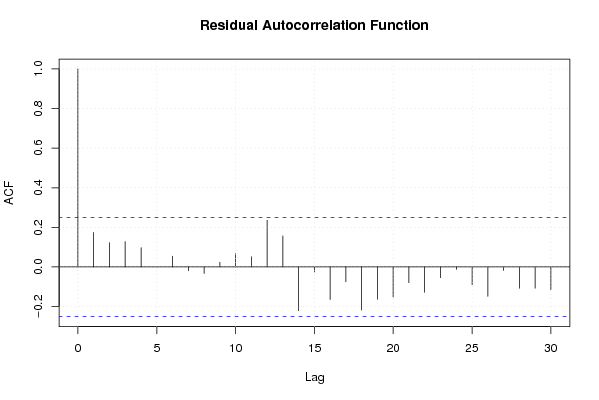
- De analyse van autocorrelatie is correct.
2008-12-01 19:38:45 [Micha Vromant] [reply
Volgens mij zijn de 0 en de 1 waarden niet correct gekozen. Eerst wist ik niet zo goed hoe deze gekozen moesten worden, en heb ik gewoon de hoogste 5, dus deze met een waarde hoger als 2000 op 1 gezet. Achteraf bekeken had ik beter andere tijdreeksen genomen, want hier gok ik eiglijk maar. Beter is dan dat er tijdreeksen gekozen worden waarvan de gebeurtenis bekend is.

Zo had bv. bij deze tijdreeks ook slechts 1 piek, nl. 2570 gekozen kunnen worden als gebeurtenis, en dan krijg je een totaal andere Multiple Regression!
2008-12-01 19:46:01 [Micha Vromant] [reply
Toch blijkt dat ik nog geluk heb gehad bij de keuze van mijn gebeurtenissen, want als ik slechts 1 piek (gebeurtenis) neem, nl. 2570, dan krijg je volgende Multiple Regression:

http://www.freestatistics.org/blog/index.phpv=date/2008/Dec/01/t1228160540wzhsxthogjxmlh4.htm

Hier blijkt dan dat de Adjusted R-square slechts 0.26 is, wat dus lager is dan de 0.54 die ik eerst had.
2008-12-01 19:50:27 [Micha Vromant] [reply
Nog een opmerking: bij de Adjusted R-squared bedoel ik niet 0.52, maar 0.42.

Ook in verband met voorspellingen (Foorspellingen :p )is het beter om een gekende gebeurtenis te hebben. Nu zal je een vrij vreemd model krijgen omdat de gebeurtenissen random gekozen (of toch bijna).

Post a new message
Dataseries X:
1515	0
1510	0
1225	0
1577	0
1417	0
1224	0
1693	0
1633	0
1639	0
1914	0
1586	0
1552	0
2081	1
1500	0
1437	0
1470	0
1849	0
1387	0
1592	0
1589	0
1798	0
1935	0
1887	0
2027	1
2080	1
1556	0
1682	0
1785	0
1869	0
1781	0
2082	1
2570	1
1862	0
1936	0
1504	0
1765	0
1607	0
1577	0
1493	0
1615	0
1700	0
1335	0
1523	0
1623	0
1540	0
1637	0
1524	0
1419	0
1821	0
1593	0
1357	0
1263	0
1750	0
1405	0
1393	0
1639	0
1679	0
1551	0
1744	0
1429	0
1784	0


Summary of computational transaction
Raw Inputview raw input (R code)
Raw Outputview raw output of R engine
Computing time3 seconds
R Server'Gwilym Jenkins' @ 72.249.127.135

\begin{tabular}{lllllllll}
\hline
Summary of computational transaction \tabularnewline
Raw Input & view raw input (R code)  \tabularnewline
Raw Output & view raw output of R engine  \tabularnewline
Computing time & 3 seconds \tabularnewline
R Server & 'Gwilym Jenkins' @ 72.249.127.135 \tabularnewline
\hline
\end{tabular}
%Source: https://freestatistics.org/blog/index.php?pk=25314&T=0

[TABLE]
[ROW][C]Summary of computational transaction[/C][/ROW]
[ROW][C]Raw Input[/C][C]view raw input (R code) [/C][/ROW]
[ROW][C]Raw Output[/C][C]view raw output of R engine [/C][/ROW]
[ROW][C]Computing time[/C][C]3 seconds[/C][/ROW]
[ROW][C]R Server[/C][C]'Gwilym Jenkins' @ 72.249.127.135[/C][/ROW]
[/TABLE]
Source: https://freestatistics.org/blog/index.php?pk=25314&T=0

Globally Unique Identifier (entire table): ba.freestatistics.org/blog/index.php?pk=25314&T=0

As an alternative you can also use a QR Code:  

The GUIDs for individual cells are displayed in the table below:

Summary of computational transaction
Raw Inputview raw input (R code)
Raw Outputview raw output of R engine
Computing time3 seconds
R Server'Gwilym Jenkins' @ 72.249.127.135


Multiple Linear Regression - Estimated Regression Equation
Gebouwen[t] = + 1601.25 + 566.749999999999Dummy[t] + e[t]

\begin{tabular}{lllllllll}
\hline
Multiple Linear Regression - Estimated Regression Equation \tabularnewline
Gebouwen[t] =  +  1601.25 +  566.749999999999Dummy[t]  + e[t] \tabularnewline
\hline
\end{tabular}
%Source: https://freestatistics.org/blog/index.php?pk=25314&T=1

[TABLE]
[ROW][C]Multiple Linear Regression - Estimated Regression Equation[/C][/ROW]
[ROW][C]Gebouwen[t] =  +  1601.25 +  566.749999999999Dummy[t]  + e[t][/C][/ROW]
[/TABLE]
Source: https://freestatistics.org/blog/index.php?pk=25314&T=1

Globally Unique Identifier (entire table): ba.freestatistics.org/blog/index.php?pk=25314&T=1

As an alternative you can also use a QR Code:  

The GUIDs for individual cells are displayed in the table below:

Multiple Linear Regression - Estimated Regression Equation
Gebouwen[t] = + 1601.25 + 566.749999999999Dummy[t] + e[t]


Multiple Linear Regression - Ordinary Least Squares
VariableParameterS.D.T-STATH0: parameter = 02-tail p-value1-tail p-value
(Intercept)1601.2524.41776365.577300
Dummy566.74999999999985.2875796.645200

\begin{tabular}{lllllllll}
\hline
Multiple Linear Regression - Ordinary Least Squares \tabularnewline
Variable & Parameter & S.D. & T-STATH0: parameter = 0 & 2-tail p-value & 1-tail p-value \tabularnewline
(Intercept) & 1601.25 & 24.417763 & 65.5773 & 0 & 0 \tabularnewline
Dummy & 566.749999999999 & 85.287579 & 6.6452 & 0 & 0 \tabularnewline
\hline
\end{tabular}
%Source: https://freestatistics.org/blog/index.php?pk=25314&T=2

[TABLE]
[ROW][C]Multiple Linear Regression - Ordinary Least Squares[/C][/ROW]
[ROW][C]Variable[/C][C]Parameter[/C][C]S.D.[/C][C]T-STATH0: parameter = 0[/C][C]2-tail p-value[/C][C]1-tail p-value[/C][/ROW]
[ROW][C](Intercept)[/C][C]1601.25[/C][C]24.417763[/C][C]65.5773[/C][C]0[/C][C]0[/C][/ROW]
[ROW][C]Dummy[/C][C]566.749999999999[/C][C]85.287579[/C][C]6.6452[/C][C]0[/C][C]0[/C][/ROW]
[/TABLE]
Source: https://freestatistics.org/blog/index.php?pk=25314&T=2

Globally Unique Identifier (entire table): ba.freestatistics.org/blog/index.php?pk=25314&T=2

As an alternative you can also use a QR Code:  

The GUIDs for individual cells are displayed in the table below:

Multiple Linear Regression - Ordinary Least Squares
VariableParameterS.D.T-STATH0: parameter = 02-tail p-value1-tail p-value
(Intercept)1601.2524.41776365.577300
Dummy566.74999999999985.2875796.645200


Multiple Linear Regression - Regression Statistics
Multiple R0.6542652237847
R-squared0.428062983054043
Adjusted R-squared0.418369135309196
F-TEST (value)44.158211921742
F-TEST (DF numerator)1
F-TEST (DF denominator)59
p-value1.07556417106025e-08
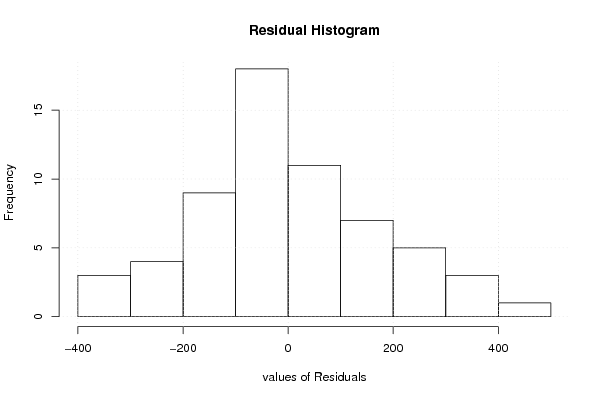
Multiple Linear Regression - Residual Statistics
Residual Standard Deviation182.725806439548
Sum Squared Residuals1969934.50000000

\begin{tabular}{lllllllll}
\hline
Multiple Linear Regression - Regression Statistics \tabularnewline
Multiple R & 0.6542652237847 \tabularnewline
R-squared & 0.428062983054043 \tabularnewline
Adjusted R-squared & 0.418369135309196 \tabularnewline
F-TEST (value) & 44.158211921742 \tabularnewline
F-TEST (DF numerator) & 1 \tabularnewline
F-TEST (DF denominator) & 59 \tabularnewline
p-value & 1.07556417106025e-08 \tabularnewline
Multiple Linear Regression - Residual Statistics \tabularnewline
Residual Standard Deviation & 182.725806439548 \tabularnewline
Sum Squared Residuals & 1969934.50000000 \tabularnewline
\hline
\end{tabular}
%Source: https://freestatistics.org/blog/index.php?pk=25314&T=3

[TABLE]
[ROW][C]Multiple Linear Regression - Regression Statistics[/C][/ROW]
[ROW][C]Multiple R[/C][C]0.6542652237847[/C][/ROW]
[ROW][C]R-squared[/C][C]0.428062983054043[/C][/ROW]
[ROW][C]Adjusted R-squared[/C][C]0.418369135309196[/C][/ROW]
[ROW][C]F-TEST (value)[/C][C]44.158211921742[/C][/ROW]
[ROW][C]F-TEST (DF numerator)[/C][C]1[/C][/ROW]
[ROW][C]F-TEST (DF denominator)[/C][C]59[/C][/ROW]
[ROW][C]p-value[/C][C]1.07556417106025e-08[/C][/ROW]
[ROW][C]Multiple Linear Regression - Residual Statistics[/C][/ROW]
[ROW][C]Residual Standard Deviation[/C][C]182.725806439548[/C][/ROW]
[ROW][C]Sum Squared Residuals[/C][C]1969934.50000000[/C][/ROW]
[/TABLE]
Source: https://freestatistics.org/blog/index.php?pk=25314&T=3

Globally Unique Identifier (entire table): ba.freestatistics.org/blog/index.php?pk=25314&T=3

As an alternative you can also use a QR Code:  

The GUIDs for individual cells are displayed in the table below:

Multiple Linear Regression - Regression Statistics
Multiple R0.6542652237847
R-squared0.428062983054043
Adjusted R-squared0.418369135309196
F-TEST (value)44.158211921742
F-TEST (DF numerator)1
F-TEST (DF denominator)59
p-value1.07556417106025e-08
Multiple Linear Regression - Residual Statistics
Residual Standard Deviation182.725806439548
Sum Squared Residuals1969934.50000000


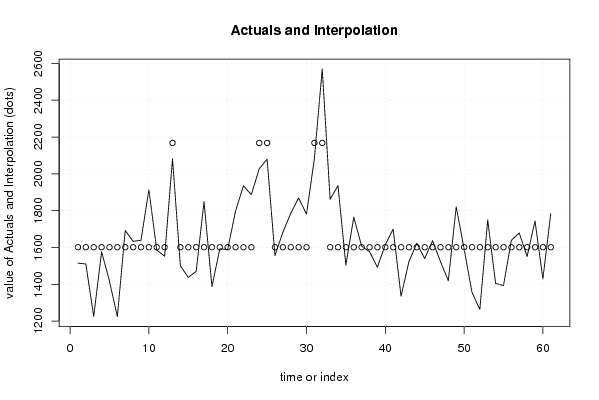
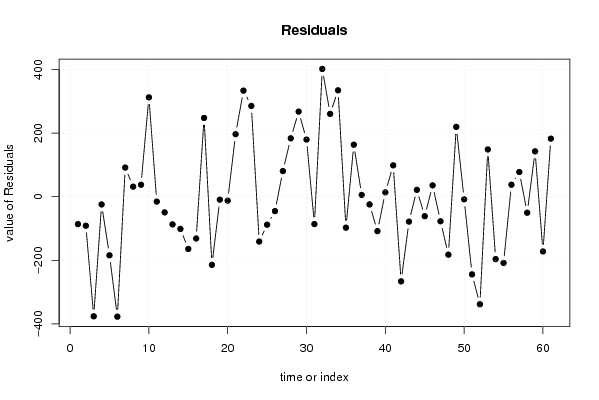
Multiple Linear Regression - Actuals, Interpolation, and Residuals
Time or IndexActualsInterpolationForecastResidualsPrediction Error
115151601.24999999999-86.2499999999933
215101601.25000000000-91.2499999999971
312251601.25-376.25
415771601.25-24.2500000000002
514171601.25-184.25
612241601.25-377.25
716931601.2591.7499999999998
816331601.2531.7499999999998
916391601.2537.7499999999998
1019141601.25312.75
1115861601.25-15.2500000000002
1215521601.25-49.2500000000002
1320812168-87
1415001601.25-101.250000000000
1514371601.25-164.25
1614701601.25-131.250000000000
1718491601.25247.75
1813871601.25-214.25
1915921601.25-9.25000000000017
2015891601.25-12.2500000000002
2117981601.25196.75
2219351601.25333.75
2318871601.25285.75
2420272168-141
2520802168-88
2615561601.25-45.2500000000002
2716821601.2580.7499999999998
2817851601.25183.75
2918691601.25267.75
3017811601.25179.750
3120822168-86
3225702168402
3318621601.25260.75
3419361601.25334.75
3515041601.25-97.2500000000002
3617651601.25163.75
3716071601.255.74999999999983
3815771601.25-24.2500000000002
3914931601.25-108.250000000000
4016151601.2513.7499999999998
4117001601.2598.7499999999998
4213351601.25-266.25
4315231601.25-78.2500000000002
4416231601.2521.7499999999998
4515401601.25-61.2500000000002
4616371601.2535.7499999999998
4715241601.25-77.2500000000002
4814191601.25-182.250000000000
4918211601.25219.75
5015931601.25-8.25000000000017
5113571601.25-244.25
5212631601.25-338.25
5317501601.25148.750000000000
5414051601.25-196.25
5513931601.25-208.25
5616391601.2537.7499999999998
5716791601.2577.7499999999998
5815511601.25-50.2500000000002
5917441601.25142.750000000000
6014291601.25-172.250000000000
6117841601.25182.75

\begin{tabular}{lllllllll}
\hline
Multiple Linear Regression - Actuals, Interpolation, and Residuals \tabularnewline
Time or Index & Actuals & InterpolationForecast & ResidualsPrediction Error \tabularnewline
1 & 1515 & 1601.24999999999 & -86.2499999999933 \tabularnewline
2 & 1510 & 1601.25000000000 & -91.2499999999971 \tabularnewline
3 & 1225 & 1601.25 & -376.25 \tabularnewline
4 & 1577 & 1601.25 & -24.2500000000002 \tabularnewline
5 & 1417 & 1601.25 & -184.25 \tabularnewline
6 & 1224 & 1601.25 & -377.25 \tabularnewline
7 & 1693 & 1601.25 & 91.7499999999998 \tabularnewline
8 & 1633 & 1601.25 & 31.7499999999998 \tabularnewline
9 & 1639 & 1601.25 & 37.7499999999998 \tabularnewline
10 & 1914 & 1601.25 & 312.75 \tabularnewline
11 & 1586 & 1601.25 & -15.2500000000002 \tabularnewline
12 & 1552 & 1601.25 & -49.2500000000002 \tabularnewline
13 & 2081 & 2168 & -87 \tabularnewline
14 & 1500 & 1601.25 & -101.250000000000 \tabularnewline
15 & 1437 & 1601.25 & -164.25 \tabularnewline
16 & 1470 & 1601.25 & -131.250000000000 \tabularnewline
17 & 1849 & 1601.25 & 247.75 \tabularnewline
18 & 1387 & 1601.25 & -214.25 \tabularnewline
19 & 1592 & 1601.25 & -9.25000000000017 \tabularnewline
20 & 1589 & 1601.25 & -12.2500000000002 \tabularnewline
21 & 1798 & 1601.25 & 196.75 \tabularnewline
22 & 1935 & 1601.25 & 333.75 \tabularnewline
23 & 1887 & 1601.25 & 285.75 \tabularnewline
24 & 2027 & 2168 & -141 \tabularnewline
25 & 2080 & 2168 & -88 \tabularnewline
26 & 1556 & 1601.25 & -45.2500000000002 \tabularnewline
27 & 1682 & 1601.25 & 80.7499999999998 \tabularnewline
28 & 1785 & 1601.25 & 183.75 \tabularnewline
29 & 1869 & 1601.25 & 267.75 \tabularnewline
30 & 1781 & 1601.25 & 179.750 \tabularnewline
31 & 2082 & 2168 & -86 \tabularnewline
32 & 2570 & 2168 & 402 \tabularnewline
33 & 1862 & 1601.25 & 260.75 \tabularnewline
34 & 1936 & 1601.25 & 334.75 \tabularnewline
35 & 1504 & 1601.25 & -97.2500000000002 \tabularnewline
36 & 1765 & 1601.25 & 163.75 \tabularnewline
37 & 1607 & 1601.25 & 5.74999999999983 \tabularnewline
38 & 1577 & 1601.25 & -24.2500000000002 \tabularnewline
39 & 1493 & 1601.25 & -108.250000000000 \tabularnewline
40 & 1615 & 1601.25 & 13.7499999999998 \tabularnewline
41 & 1700 & 1601.25 & 98.7499999999998 \tabularnewline
42 & 1335 & 1601.25 & -266.25 \tabularnewline
43 & 1523 & 1601.25 & -78.2500000000002 \tabularnewline
44 & 1623 & 1601.25 & 21.7499999999998 \tabularnewline
45 & 1540 & 1601.25 & -61.2500000000002 \tabularnewline
46 & 1637 & 1601.25 & 35.7499999999998 \tabularnewline
47 & 1524 & 1601.25 & -77.2500000000002 \tabularnewline
48 & 1419 & 1601.25 & -182.250000000000 \tabularnewline
49 & 1821 & 1601.25 & 219.75 \tabularnewline
50 & 1593 & 1601.25 & -8.25000000000017 \tabularnewline
51 & 1357 & 1601.25 & -244.25 \tabularnewline
52 & 1263 & 1601.25 & -338.25 \tabularnewline
53 & 1750 & 1601.25 & 148.750000000000 \tabularnewline
54 & 1405 & 1601.25 & -196.25 \tabularnewline
55 & 1393 & 1601.25 & -208.25 \tabularnewline
56 & 1639 & 1601.25 & 37.7499999999998 \tabularnewline
57 & 1679 & 1601.25 & 77.7499999999998 \tabularnewline
58 & 1551 & 1601.25 & -50.2500000000002 \tabularnewline
59 & 1744 & 1601.25 & 142.750000000000 \tabularnewline
60 & 1429 & 1601.25 & -172.250000000000 \tabularnewline
61 & 1784 & 1601.25 & 182.75 \tabularnewline
\hline
\end{tabular}
%Source: https://freestatistics.org/blog/index.php?pk=25314&T=4

[TABLE]
[ROW][C]Multiple Linear Regression - Actuals, Interpolation, and Residuals[/C][/ROW]
[ROW][C]Time or Index[/C][C]Actuals[/C][C]InterpolationForecast[/C][C]ResidualsPrediction Error[/C][/ROW]
[ROW][C]1[/C][C]1515[/C][C]1601.24999999999[/C][C]-86.2499999999933[/C][/ROW]
[ROW][C]2[/C][C]1510[/C][C]1601.25000000000[/C][C]-91.2499999999971[/C][/ROW]
[ROW][C]3[/C][C]1225[/C][C]1601.25[/C][C]-376.25[/C][/ROW]
[ROW][C]4[/C][C]1577[/C][C]1601.25[/C][C]-24.2500000000002[/C][/ROW]
[ROW][C]5[/C][C]1417[/C][C]1601.25[/C][C]-184.25[/C][/ROW]
[ROW][C]6[/C][C]1224[/C][C]1601.25[/C][C]-377.25[/C][/ROW]
[ROW][C]7[/C][C]1693[/C][C]1601.25[/C][C]91.7499999999998[/C][/ROW]
[ROW][C]8[/C][C]1633[/C][C]1601.25[/C][C]31.7499999999998[/C][/ROW]
[ROW][C]9[/C][C]1639[/C][C]1601.25[/C][C]37.7499999999998[/C][/ROW]
[ROW][C]10[/C][C]1914[/C][C]1601.25[/C][C]312.75[/C][/ROW]
[ROW][C]11[/C][C]1586[/C][C]1601.25[/C][C]-15.2500000000002[/C][/ROW]
[ROW][C]12[/C][C]1552[/C][C]1601.25[/C][C]-49.2500000000002[/C][/ROW]
[ROW][C]13[/C][C]2081[/C][C]2168[/C][C]-87[/C][/ROW]
[ROW][C]14[/C][C]1500[/C][C]1601.25[/C][C]-101.250000000000[/C][/ROW]
[ROW][C]15[/C][C]1437[/C][C]1601.25[/C][C]-164.25[/C][/ROW]
[ROW][C]16[/C][C]1470[/C][C]1601.25[/C][C]-131.250000000000[/C][/ROW]
[ROW][C]17[/C][C]1849[/C][C]1601.25[/C][C]247.75[/C][/ROW]
[ROW][C]18[/C][C]1387[/C][C]1601.25[/C][C]-214.25[/C][/ROW]
[ROW][C]19[/C][C]1592[/C][C]1601.25[/C][C]-9.25000000000017[/C][/ROW]
[ROW][C]20[/C][C]1589[/C][C]1601.25[/C][C]-12.2500000000002[/C][/ROW]
[ROW][C]21[/C][C]1798[/C][C]1601.25[/C][C]196.75[/C][/ROW]
[ROW][C]22[/C][C]1935[/C][C]1601.25[/C][C]333.75[/C][/ROW]
[ROW][C]23[/C][C]1887[/C][C]1601.25[/C][C]285.75[/C][/ROW]
[ROW][C]24[/C][C]2027[/C][C]2168[/C][C]-141[/C][/ROW]
[ROW][C]25[/C][C]2080[/C][C]2168[/C][C]-88[/C][/ROW]
[ROW][C]26[/C][C]1556[/C][C]1601.25[/C][C]-45.2500000000002[/C][/ROW]
[ROW][C]27[/C][C]1682[/C][C]1601.25[/C][C]80.7499999999998[/C][/ROW]
[ROW][C]28[/C][C]1785[/C][C]1601.25[/C][C]183.75[/C][/ROW]
[ROW][C]29[/C][C]1869[/C][C]1601.25[/C][C]267.75[/C][/ROW]
[ROW][C]30[/C][C]1781[/C][C]1601.25[/C][C]179.750[/C][/ROW]
[ROW][C]31[/C][C]2082[/C][C]2168[/C][C]-86[/C][/ROW]
[ROW][C]32[/C][C]2570[/C][C]2168[/C][C]402[/C][/ROW]
[ROW][C]33[/C][C]1862[/C][C]1601.25[/C][C]260.75[/C][/ROW]
[ROW][C]34[/C][C]1936[/C][C]1601.25[/C][C]334.75[/C][/ROW]
[ROW][C]35[/C][C]1504[/C][C]1601.25[/C][C]-97.2500000000002[/C][/ROW]
[ROW][C]36[/C][C]1765[/C][C]1601.25[/C][C]163.75[/C][/ROW]
[ROW][C]37[/C][C]1607[/C][C]1601.25[/C][C]5.74999999999983[/C][/ROW]
[ROW][C]38[/C][C]1577[/C][C]1601.25[/C][C]-24.2500000000002[/C][/ROW]
[ROW][C]39[/C][C]1493[/C][C]1601.25[/C][C]-108.250000000000[/C][/ROW]
[ROW][C]40[/C][C]1615[/C][C]1601.25[/C][C]13.7499999999998[/C][/ROW]
[ROW][C]41[/C][C]1700[/C][C]1601.25[/C][C]98.7499999999998[/C][/ROW]
[ROW][C]42[/C][C]1335[/C][C]1601.25[/C][C]-266.25[/C][/ROW]
[ROW][C]43[/C][C]1523[/C][C]1601.25[/C][C]-78.2500000000002[/C][/ROW]
[ROW][C]44[/C][C]1623[/C][C]1601.25[/C][C]21.7499999999998[/C][/ROW]
[ROW][C]45[/C][C]1540[/C][C]1601.25[/C][C]-61.2500000000002[/C][/ROW]
[ROW][C]46[/C][C]1637[/C][C]1601.25[/C][C]35.7499999999998[/C][/ROW]
[ROW][C]47[/C][C]1524[/C][C]1601.25[/C][C]-77.2500000000002[/C][/ROW]
[ROW][C]48[/C][C]1419[/C][C]1601.25[/C][C]-182.250000000000[/C][/ROW]
[ROW][C]49[/C][C]1821[/C][C]1601.25[/C][C]219.75[/C][/ROW]
[ROW][C]50[/C][C]1593[/C][C]1601.25[/C][C]-8.25000000000017[/C][/ROW]
[ROW][C]51[/C][C]1357[/C][C]1601.25[/C][C]-244.25[/C][/ROW]
[ROW][C]52[/C][C]1263[/C][C]1601.25[/C][C]-338.25[/C][/ROW]
[ROW][C]53[/C][C]1750[/C][C]1601.25[/C][C]148.750000000000[/C][/ROW]
[ROW][C]54[/C][C]1405[/C][C]1601.25[/C][C]-196.25[/C][/ROW]
[ROW][C]55[/C][C]1393[/C][C]1601.25[/C][C]-208.25[/C][/ROW]
[ROW][C]56[/C][C]1639[/C][C]1601.25[/C][C]37.7499999999998[/C][/ROW]
[ROW][C]57[/C][C]1679[/C][C]1601.25[/C][C]77.7499999999998[/C][/ROW]
[ROW][C]58[/C][C]1551[/C][C]1601.25[/C][C]-50.2500000000002[/C][/ROW]
[ROW][C]59[/C][C]1744[/C][C]1601.25[/C][C]142.750000000000[/C][/ROW]
[ROW][C]60[/C][C]1429[/C][C]1601.25[/C][C]-172.250000000000[/C][/ROW]
[ROW][C]61[/C][C]1784[/C][C]1601.25[/C][C]182.75[/C][/ROW]
[/TABLE]
Source: https://freestatistics.org/blog/index.php?pk=25314&T=4

Globally Unique Identifier (entire table): ba.freestatistics.org/blog/index.php?pk=25314&T=4

As an alternative you can also use a QR Code:  

The GUIDs for individual cells are displayed in the table below:

Multiple Linear Regression - Actuals, Interpolation, and Residuals
Time or IndexActualsInterpolationForecastResidualsPrediction Error
115151601.24999999999-86.2499999999933
215101601.25000000000-91.2499999999971
312251601.25-376.25
415771601.25-24.2500000000002
514171601.25-184.25
612241601.25-377.25
716931601.2591.7499999999998
816331601.2531.7499999999998
916391601.2537.7499999999998
1019141601.25312.75
1115861601.25-15.2500000000002
1215521601.25-49.2500000000002
1320812168-87
1415001601.25-101.250000000000
1514371601.25-164.25
1614701601.25-131.250000000000
1718491601.25247.75
1813871601.25-214.25
1915921601.25-9.25000000000017
2015891601.25-12.2500000000002
2117981601.25196.75
2219351601.25333.75
2318871601.25285.75
2420272168-141
2520802168-88
2615561601.25-45.2500000000002
2716821601.2580.7499999999998
2817851601.25183.75
2918691601.25267.75
3017811601.25179.750
3120822168-86
3225702168402
3318621601.25260.75
3419361601.25334.75
3515041601.25-97.2500000000002
3617651601.25163.75
3716071601.255.74999999999983
3815771601.25-24.2500000000002
3914931601.25-108.250000000000
4016151601.2513.7499999999998
4117001601.2598.7499999999998
4213351601.25-266.25
4315231601.25-78.2500000000002
4416231601.2521.7499999999998
4515401601.25-61.2500000000002
4616371601.2535.7499999999998
4715241601.25-77.2500000000002
4814191601.25-182.250000000000
4918211601.25219.75
5015931601.25-8.25000000000017
5113571601.25-244.25
5212631601.25-338.25
5317501601.25148.750000000000
5414051601.25-196.25
5513931601.25-208.25
5616391601.2537.7499999999998
5716791601.2577.7499999999998
5815511601.25-50.2500000000002
5917441601.25142.750000000000
6014291601.25-172.250000000000
6117841601.25182.75


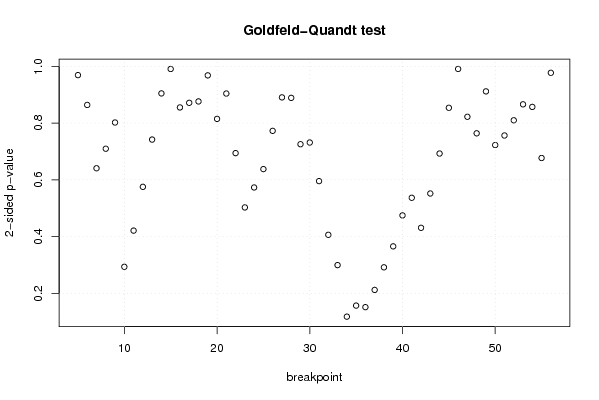
Goldfeld-Quandt test for Heteroskedasticity
p-valuesAlternative Hypothesis
breakpoint indexgreater2-sidedless
50.4846419609336960.9692839218673920.515358039066304
60.5679242181359720.8641515637280570.432075781864028
70.6795713040998270.6408573918003470.320428695900173
80.6451109978668450.7097780042663090.354889002133155
90.5989076952458980.8021846095082030.401092304754102
100.8532972422919480.2934055154161030.146702757708051
110.7895162232820860.4209675534358280.210483776717914
120.712299871014980.5754002579700380.287700128985019
130.6289958654701590.7420082690596820.371004134529841
140.5476070564975960.9047858870048090.452392943502404
150.4954528987301260.9909057974602520.504547101269874
160.427644137422170.855288274844340.57235586257783
170.5642053051629190.8715893896741620.435794694837081
180.5617730998207120.8764538003585770.438226900179288
190.4841785206729210.9683570413458420.515821479327079
200.4074299251352870.8148598502705740.592570074864713
210.4521556470128070.9043112940256140.547844352987193
220.6529018053964090.6941963892071830.347098194603591
230.748622334285570.5027553314288610.251377665714430
240.7134640017334360.5730719965331280.286535998266564
250.681077161884510.637845676230980.31892283811549
260.613629223835030.7727415523299390.386370776164970
270.5546166886786770.8907666226426470.445383311321324
280.5554416080032610.8891167839934780.444558391996739
290.6371976342837440.7256047314325120.362802365716256
300.6341835599570530.7316328800858950.365816440042947
310.7022025967243360.5955948065513280.297797403275664
320.7969122237398880.4061755525202240.203087776260112
330.8503361454266720.2993277091466560.149663854573328
340.9411733900278730.1176532199442550.0588266099721273
350.921713775497880.156572449004240.07828622450212
360.924453771266640.1510924574667180.075546228733359
370.894054274090110.2118914518197820.105945725909891
380.8542132194022570.2915735611954860.145786780597743
390.8172324551523030.3655350896953930.182767544847697
400.7627005487200520.4745989025598970.237299451279948
410.7316370724404680.5367258551190650.268362927559532
420.7845772596161290.4308454807677420.215422740383871
430.7240427091078690.5519145817842620.275957290892131
440.6536152215373290.6927695569253430.346384778462671
450.5729666889396590.8540666221206810.427033311060341
460.4955044100134360.9910088200268720.504495589986564
470.4112028316442020.8224056632884050.588797168355798
480.3820424834845030.7640849669690060.617957516515497
490.4559617219567230.9119234439134460.544038278043277
500.3613424152073820.7226848304147640.638657584792618
510.3782118621845540.7564237243691080.621788137815446
520.5949888994199190.8100222011601610.405011100580081
530.5668491574886470.8663016850227070.433150842511353
540.5714176388507280.8571647222985440.428582361149272
550.6615083103018460.6769833793963080.338491689698154
560.4887127178088120.9774254356176240.511287282191188

\begin{tabular}{lllllllll}
\hline
Goldfeld-Quandt test for Heteroskedasticity \tabularnewline
p-values & Alternative Hypothesis \tabularnewline
breakpoint index & greater & 2-sided & less \tabularnewline
5 & 0.484641960933696 & 0.969283921867392 & 0.515358039066304 \tabularnewline
6 & 0.567924218135972 & 0.864151563728057 & 0.432075781864028 \tabularnewline
7 & 0.679571304099827 & 0.640857391800347 & 0.320428695900173 \tabularnewline
8 & 0.645110997866845 & 0.709778004266309 & 0.354889002133155 \tabularnewline
9 & 0.598907695245898 & 0.802184609508203 & 0.401092304754102 \tabularnewline
10 & 0.853297242291948 & 0.293405515416103 & 0.146702757708051 \tabularnewline
11 & 0.789516223282086 & 0.420967553435828 & 0.210483776717914 \tabularnewline
12 & 0.71229987101498 & 0.575400257970038 & 0.287700128985019 \tabularnewline
13 & 0.628995865470159 & 0.742008269059682 & 0.371004134529841 \tabularnewline
14 & 0.547607056497596 & 0.904785887004809 & 0.452392943502404 \tabularnewline
15 & 0.495452898730126 & 0.990905797460252 & 0.504547101269874 \tabularnewline
16 & 0.42764413742217 & 0.85528827484434 & 0.57235586257783 \tabularnewline
17 & 0.564205305162919 & 0.871589389674162 & 0.435794694837081 \tabularnewline
18 & 0.561773099820712 & 0.876453800358577 & 0.438226900179288 \tabularnewline
19 & 0.484178520672921 & 0.968357041345842 & 0.515821479327079 \tabularnewline
20 & 0.407429925135287 & 0.814859850270574 & 0.592570074864713 \tabularnewline
21 & 0.452155647012807 & 0.904311294025614 & 0.547844352987193 \tabularnewline
22 & 0.652901805396409 & 0.694196389207183 & 0.347098194603591 \tabularnewline
23 & 0.74862233428557 & 0.502755331428861 & 0.251377665714430 \tabularnewline
24 & 0.713464001733436 & 0.573071996533128 & 0.286535998266564 \tabularnewline
25 & 0.68107716188451 & 0.63784567623098 & 0.31892283811549 \tabularnewline
26 & 0.61362922383503 & 0.772741552329939 & 0.386370776164970 \tabularnewline
27 & 0.554616688678677 & 0.890766622642647 & 0.445383311321324 \tabularnewline
28 & 0.555441608003261 & 0.889116783993478 & 0.444558391996739 \tabularnewline
29 & 0.637197634283744 & 0.725604731432512 & 0.362802365716256 \tabularnewline
30 & 0.634183559957053 & 0.731632880085895 & 0.365816440042947 \tabularnewline
31 & 0.702202596724336 & 0.595594806551328 & 0.297797403275664 \tabularnewline
32 & 0.796912223739888 & 0.406175552520224 & 0.203087776260112 \tabularnewline
33 & 0.850336145426672 & 0.299327709146656 & 0.149663854573328 \tabularnewline
34 & 0.941173390027873 & 0.117653219944255 & 0.0588266099721273 \tabularnewline
35 & 0.92171377549788 & 0.15657244900424 & 0.07828622450212 \tabularnewline
36 & 0.92445377126664 & 0.151092457466718 & 0.075546228733359 \tabularnewline
37 & 0.89405427409011 & 0.211891451819782 & 0.105945725909891 \tabularnewline
38 & 0.854213219402257 & 0.291573561195486 & 0.145786780597743 \tabularnewline
39 & 0.817232455152303 & 0.365535089695393 & 0.182767544847697 \tabularnewline
40 & 0.762700548720052 & 0.474598902559897 & 0.237299451279948 \tabularnewline
41 & 0.731637072440468 & 0.536725855119065 & 0.268362927559532 \tabularnewline
42 & 0.784577259616129 & 0.430845480767742 & 0.215422740383871 \tabularnewline
43 & 0.724042709107869 & 0.551914581784262 & 0.275957290892131 \tabularnewline
44 & 0.653615221537329 & 0.692769556925343 & 0.346384778462671 \tabularnewline
45 & 0.572966688939659 & 0.854066622120681 & 0.427033311060341 \tabularnewline
46 & 0.495504410013436 & 0.991008820026872 & 0.504495589986564 \tabularnewline
47 & 0.411202831644202 & 0.822405663288405 & 0.588797168355798 \tabularnewline
48 & 0.382042483484503 & 0.764084966969006 & 0.617957516515497 \tabularnewline
49 & 0.455961721956723 & 0.911923443913446 & 0.544038278043277 \tabularnewline
50 & 0.361342415207382 & 0.722684830414764 & 0.638657584792618 \tabularnewline
51 & 0.378211862184554 & 0.756423724369108 & 0.621788137815446 \tabularnewline
52 & 0.594988899419919 & 0.810022201160161 & 0.405011100580081 \tabularnewline
53 & 0.566849157488647 & 0.866301685022707 & 0.433150842511353 \tabularnewline
54 & 0.571417638850728 & 0.857164722298544 & 0.428582361149272 \tabularnewline
55 & 0.661508310301846 & 0.676983379396308 & 0.338491689698154 \tabularnewline
56 & 0.488712717808812 & 0.977425435617624 & 0.511287282191188 \tabularnewline
\hline
\end{tabular}
%Source: https://freestatistics.org/blog/index.php?pk=25314&T=5

[TABLE]
[ROW][C]Goldfeld-Quandt test for Heteroskedasticity[/C][/ROW]
[ROW][C]p-values[/C][C]Alternative Hypothesis[/C][/ROW]
[ROW][C]breakpoint index[/C][C]greater[/C][C]2-sided[/C][C]less[/C][/ROW]
[ROW][C]5[/C][C]0.484641960933696[/C][C]0.969283921867392[/C][C]0.515358039066304[/C][/ROW]
[ROW][C]6[/C][C]0.567924218135972[/C][C]0.864151563728057[/C][C]0.432075781864028[/C][/ROW]
[ROW][C]7[/C][C]0.679571304099827[/C][C]0.640857391800347[/C][C]0.320428695900173[/C][/ROW]
[ROW][C]8[/C][C]0.645110997866845[/C][C]0.709778004266309[/C][C]0.354889002133155[/C][/ROW]
[ROW][C]9[/C][C]0.598907695245898[/C][C]0.802184609508203[/C][C]0.401092304754102[/C][/ROW]
[ROW][C]10[/C][C]0.853297242291948[/C][C]0.293405515416103[/C][C]0.146702757708051[/C][/ROW]
[ROW][C]11[/C][C]0.789516223282086[/C][C]0.420967553435828[/C][C]0.210483776717914[/C][/ROW]
[ROW][C]12[/C][C]0.71229987101498[/C][C]0.575400257970038[/C][C]0.287700128985019[/C][/ROW]
[ROW][C]13[/C][C]0.628995865470159[/C][C]0.742008269059682[/C][C]0.371004134529841[/C][/ROW]
[ROW][C]14[/C][C]0.547607056497596[/C][C]0.904785887004809[/C][C]0.452392943502404[/C][/ROW]
[ROW][C]15[/C][C]0.495452898730126[/C][C]0.990905797460252[/C][C]0.504547101269874[/C][/ROW]
[ROW][C]16[/C][C]0.42764413742217[/C][C]0.85528827484434[/C][C]0.57235586257783[/C][/ROW]
[ROW][C]17[/C][C]0.564205305162919[/C][C]0.871589389674162[/C][C]0.435794694837081[/C][/ROW]
[ROW][C]18[/C][C]0.561773099820712[/C][C]0.876453800358577[/C][C]0.438226900179288[/C][/ROW]
[ROW][C]19[/C][C]0.484178520672921[/C][C]0.968357041345842[/C][C]0.515821479327079[/C][/ROW]
[ROW][C]20[/C][C]0.407429925135287[/C][C]0.814859850270574[/C][C]0.592570074864713[/C][/ROW]
[ROW][C]21[/C][C]0.452155647012807[/C][C]0.904311294025614[/C][C]0.547844352987193[/C][/ROW]
[ROW][C]22[/C][C]0.652901805396409[/C][C]0.694196389207183[/C][C]0.347098194603591[/C][/ROW]
[ROW][C]23[/C][C]0.74862233428557[/C][C]0.502755331428861[/C][C]0.251377665714430[/C][/ROW]
[ROW][C]24[/C][C]0.713464001733436[/C][C]0.573071996533128[/C][C]0.286535998266564[/C][/ROW]
[ROW][C]25[/C][C]0.68107716188451[/C][C]0.63784567623098[/C][C]0.31892283811549[/C][/ROW]
[ROW][C]26[/C][C]0.61362922383503[/C][C]0.772741552329939[/C][C]0.386370776164970[/C][/ROW]
[ROW][C]27[/C][C]0.554616688678677[/C][C]0.890766622642647[/C][C]0.445383311321324[/C][/ROW]
[ROW][C]28[/C][C]0.555441608003261[/C][C]0.889116783993478[/C][C]0.444558391996739[/C][/ROW]
[ROW][C]29[/C][C]0.637197634283744[/C][C]0.725604731432512[/C][C]0.362802365716256[/C][/ROW]
[ROW][C]30[/C][C]0.634183559957053[/C][C]0.731632880085895[/C][C]0.365816440042947[/C][/ROW]
[ROW][C]31[/C][C]0.702202596724336[/C][C]0.595594806551328[/C][C]0.297797403275664[/C][/ROW]
[ROW][C]32[/C][C]0.796912223739888[/C][C]0.406175552520224[/C][C]0.203087776260112[/C][/ROW]
[ROW][C]33[/C][C]0.850336145426672[/C][C]0.299327709146656[/C][C]0.149663854573328[/C][/ROW]
[ROW][C]34[/C][C]0.941173390027873[/C][C]0.117653219944255[/C][C]0.0588266099721273[/C][/ROW]
[ROW][C]35[/C][C]0.92171377549788[/C][C]0.15657244900424[/C][C]0.07828622450212[/C][/ROW]
[ROW][C]36[/C][C]0.92445377126664[/C][C]0.151092457466718[/C][C]0.075546228733359[/C][/ROW]
[ROW][C]37[/C][C]0.89405427409011[/C][C]0.211891451819782[/C][C]0.105945725909891[/C][/ROW]
[ROW][C]38[/C][C]0.854213219402257[/C][C]0.291573561195486[/C][C]0.145786780597743[/C][/ROW]
[ROW][C]39[/C][C]0.817232455152303[/C][C]0.365535089695393[/C][C]0.182767544847697[/C][/ROW]
[ROW][C]40[/C][C]0.762700548720052[/C][C]0.474598902559897[/C][C]0.237299451279948[/C][/ROW]
[ROW][C]41[/C][C]0.731637072440468[/C][C]0.536725855119065[/C][C]0.268362927559532[/C][/ROW]
[ROW][C]42[/C][C]0.784577259616129[/C][C]0.430845480767742[/C][C]0.215422740383871[/C][/ROW]
[ROW][C]43[/C][C]0.724042709107869[/C][C]0.551914581784262[/C][C]0.275957290892131[/C][/ROW]
[ROW][C]44[/C][C]0.653615221537329[/C][C]0.692769556925343[/C][C]0.346384778462671[/C][/ROW]
[ROW][C]45[/C][C]0.572966688939659[/C][C]0.854066622120681[/C][C]0.427033311060341[/C][/ROW]
[ROW][C]46[/C][C]0.495504410013436[/C][C]0.991008820026872[/C][C]0.504495589986564[/C][/ROW]
[ROW][C]47[/C][C]0.411202831644202[/C][C]0.822405663288405[/C][C]0.588797168355798[/C][/ROW]
[ROW][C]48[/C][C]0.382042483484503[/C][C]0.764084966969006[/C][C]0.617957516515497[/C][/ROW]
[ROW][C]49[/C][C]0.455961721956723[/C][C]0.911923443913446[/C][C]0.544038278043277[/C][/ROW]
[ROW][C]50[/C][C]0.361342415207382[/C][C]0.722684830414764[/C][C]0.638657584792618[/C][/ROW]
[ROW][C]51[/C][C]0.378211862184554[/C][C]0.756423724369108[/C][C]0.621788137815446[/C][/ROW]
[ROW][C]52[/C][C]0.594988899419919[/C][C]0.810022201160161[/C][C]0.405011100580081[/C][/ROW]
[ROW][C]53[/C][C]0.566849157488647[/C][C]0.866301685022707[/C][C]0.433150842511353[/C][/ROW]
[ROW][C]54[/C][C]0.571417638850728[/C][C]0.857164722298544[/C][C]0.428582361149272[/C][/ROW]
[ROW][C]55[/C][C]0.661508310301846[/C][C]0.676983379396308[/C][C]0.338491689698154[/C][/ROW]
[ROW][C]56[/C][C]0.488712717808812[/C][C]0.977425435617624[/C][C]0.511287282191188[/C][/ROW]
[/TABLE]
Source: https://freestatistics.org/blog/index.php?pk=25314&T=5

Globally Unique Identifier (entire table): ba.freestatistics.org/blog/index.php?pk=25314&T=5

As an alternative you can also use a QR Code:  

The GUIDs for individual cells are displayed in the table below:

Goldfeld-Quandt test for Heteroskedasticity
p-valuesAlternative Hypothesis
breakpoint indexgreater2-sidedless
50.4846419609336960.9692839218673920.515358039066304
60.5679242181359720.8641515637280570.432075781864028
70.6795713040998270.6408573918003470.320428695900173
80.6451109978668450.7097780042663090.354889002133155
90.5989076952458980.8021846095082030.401092304754102
100.8532972422919480.2934055154161030.146702757708051
110.7895162232820860.4209675534358280.210483776717914
120.712299871014980.5754002579700380.287700128985019
130.6289958654701590.7420082690596820.371004134529841
140.5476070564975960.9047858870048090.452392943502404
150.4954528987301260.9909057974602520.504547101269874
160.427644137422170.855288274844340.57235586257783
170.5642053051629190.8715893896741620.435794694837081
180.5617730998207120.8764538003585770.438226900179288
190.4841785206729210.9683570413458420.515821479327079
200.4074299251352870.8148598502705740.592570074864713
210.4521556470128070.9043112940256140.547844352987193
220.6529018053964090.6941963892071830.347098194603591
230.748622334285570.5027553314288610.251377665714430
240.7134640017334360.5730719965331280.286535998266564
250.681077161884510.637845676230980.31892283811549
260.613629223835030.7727415523299390.386370776164970
270.5546166886786770.8907666226426470.445383311321324
280.5554416080032610.8891167839934780.444558391996739
290.6371976342837440.7256047314325120.362802365716256
300.6341835599570530.7316328800858950.365816440042947
310.7022025967243360.5955948065513280.297797403275664
320.7969122237398880.4061755525202240.203087776260112
330.8503361454266720.2993277091466560.149663854573328
340.9411733900278730.1176532199442550.0588266099721273
350.921713775497880.156572449004240.07828622450212
360.924453771266640.1510924574667180.075546228733359
370.894054274090110.2118914518197820.105945725909891
380.8542132194022570.2915735611954860.145786780597743
390.8172324551523030.3655350896953930.182767544847697
400.7627005487200520.4745989025598970.237299451279948
410.7316370724404680.5367258551190650.268362927559532
420.7845772596161290.4308454807677420.215422740383871
430.7240427091078690.5519145817842620.275957290892131
440.6536152215373290.6927695569253430.346384778462671
450.5729666889396590.8540666221206810.427033311060341
460.4955044100134360.9910088200268720.504495589986564
470.4112028316442020.8224056632884050.588797168355798
480.3820424834845030.7640849669690060.617957516515497
490.4559617219567230.9119234439134460.544038278043277
500.3613424152073820.7226848304147640.638657584792618
510.3782118621845540.7564237243691080.621788137815446
520.5949888994199190.8100222011601610.405011100580081
530.5668491574886470.8663016850227070.433150842511353
540.5714176388507280.8571647222985440.428582361149272
550.6615083103018460.6769833793963080.338491689698154
560.4887127178088120.9774254356176240.511287282191188


Meta Analysis of Goldfeld-Quandt test for Heteroskedasticity
Description# significant tests% significant testsOK/NOK
1% type I error level00OK
5% type I error level00OK
10% type I error level00OK

\begin{tabular}{lllllllll}
\hline
Meta Analysis of Goldfeld-Quandt test for Heteroskedasticity \tabularnewline
Description & # significant tests & % significant tests & OK/NOK \tabularnewline
1% type I error level & 0 & 0 & OK \tabularnewline
5% type I error level & 0 & 0 & OK \tabularnewline
10% type I error level & 0 & 0 & OK \tabularnewline
\hline
\end{tabular}
%Source: https://freestatistics.org/blog/index.php?pk=25314&T=6

[TABLE]
[ROW][C]Meta Analysis of Goldfeld-Quandt test for Heteroskedasticity[/C][/ROW]
[ROW][C]Description[/C][C]# significant tests[/C][C]% significant tests[/C][C]OK/NOK[/C][/ROW]
[ROW][C]1% type I error level[/C][C]0[/C][C]0[/C][C]OK[/C][/ROW]
[ROW][C]5% type I error level[/C][C]0[/C][C]0[/C][C]OK[/C][/ROW]
[ROW][C]10% type I error level[/C][C]0[/C][C]0[/C][C]OK[/C][/ROW]
[/TABLE]
Source: https://freestatistics.org/blog/index.php?pk=25314&T=6

Globally Unique Identifier (entire table): ba.freestatistics.org/blog/index.php?pk=25314&T=6

As an alternative you can also use a QR Code:  

The GUIDs for individual cells are displayed in the table below:

Meta Analysis of Goldfeld-Quandt test for Heteroskedasticity
Description# significant tests% significant testsOK/NOK
1% type I error level00OK
5% type I error level00OK
10% type I error level00OK


Parameters (Session):
par1 = 1 ; par2 = Do not include Seasonal Dummies ; par3 = No Linear Trend ;
Parameters (R input):
par1 = 1 ; par2 = Do not include Seasonal Dummies ; par3 = No Linear Trend ; par4 = ; par5 = ; par6 = ; par7 = ; par8 = ; par9 = ; par10 = ; par11 = ; par12 = ; par13 = ; par14 = ; par15 = ; par16 = ; par17 = ; par18 = ; par19 = ; par20 = ;
R code (references can be found in the software module):
library(lattice)
library(lmtest)
n25 <- 25 #minimum number of obs. for Goldfeld-Quandt test
par1 <- as.numeric(par1)
x <- t(y)
k <- length(x[1,])
n <- length(x[,1])
x1 <- cbind(x[,par1], x[,1:k!=par1])
mycolnames <- c(colnames(x)[par1], colnames(x)[1:k!=par1])
colnames(x1) <- mycolnames #colnames(x)[par1]
x <- x1
if (par3 == 'First Differences'){
x2 <- array(0, dim=c(n-1,k), dimnames=list(1:(n-1), paste('(1-B)',colnames(x),sep='')))
for (i in 1:n-1) {
for (j in 1:k) {
x2[i,j] <- x[i+1,j] - x[i,j]
}
}
x <- x2
}
if (par2 == 'Include Monthly Dummies'){
x2 <- array(0, dim=c(n,11), dimnames=list(1:n, paste('M', seq(1:11), sep ='')))
for (i in 1:11){
x2[seq(i,n,12),i] <- 1
}
x <- cbind(x, x2)
}
if (par2 == 'Include Quarterly Dummies'){
x2 <- array(0, dim=c(n,3), dimnames=list(1:n, paste('Q', seq(1:3), sep ='')))
for (i in 1:3){
x2[seq(i,n,4),i] <- 1
}
x <- cbind(x, x2)
}
k <- length(x[1,])
if (par3 == 'Linear Trend'){
x <- cbind(x, c(1:n))
colnames(x)[k+1] <- 't'
}
x
k <- length(x[1,])
df <- as.data.frame(x)
(mylm <- lm(df))
(mysum <- summary(mylm))
if (n > n25) {
kp3 <- k + 3
nmkm3 <- n - k - 3
gqarr <- array(NA, dim=c(nmkm3-kp3+1,3))
numgqtests <- 0
numsignificant1 <- 0
numsignificant5 <- 0
numsignificant10 <- 0
for (mypoint in kp3:nmkm3) {
j <- 0
numgqtests <- numgqtests + 1
for (myalt in c('greater', 'two.sided', 'less')) {
j <- j + 1
gqarr[mypoint-kp3+1,j] <- gqtest(mylm, point=mypoint, alternative=myalt)$p.value
}
if (gqarr[mypoint-kp3+1,2] < 0.01) numsignificant1 <- numsignificant1 + 1
if (gqarr[mypoint-kp3+1,2] < 0.05) numsignificant5 <- numsignificant5 + 1
if (gqarr[mypoint-kp3+1,2] < 0.10) numsignificant10 <- numsignificant10 + 1
}
gqarr
}
bitmap(file='test0.png')
plot(x[,1], type='l', main='Actuals and Interpolation', ylab='value of Actuals and Interpolation (dots)', xlab='time or index')
points(x[,1]-mysum$resid)
grid()
dev.off()
bitmap(file='test1.png')
plot(mysum$resid, type='b', pch=19, main='Residuals', ylab='value of Residuals', xlab='time or index')
grid()
dev.off()
bitmap(file='test2.png')
hist(mysum$resid, main='Residual Histogram', xlab='values of Residuals')
grid()
dev.off()
bitmap(file='test3.png')
densityplot(~mysum$resid,col='black',main='Residual Density Plot', xlab='values of Residuals')
dev.off()
bitmap(file='test4.png')
qqnorm(mysum$resid, main='Residual Normal Q-Q Plot')
qqline(mysum$resid)
grid()
dev.off()
(myerror <- as.ts(mysum$resid))
bitmap(file='test5.png')
dum <- cbind(lag(myerror,k=1),myerror)
dum
dum1 <- dum[2:length(myerror),]
dum1
z <- as.data.frame(dum1)
z
plot(z,main=paste('Residual Lag plot, lowess, and regression line'), ylab='values of Residuals', xlab='lagged values of Residuals')
lines(lowess(z))
abline(lm(z))
grid()
dev.off()
bitmap(file='test6.png')
acf(mysum$resid, lag.max=length(mysum$resid)/2, main='Residual Autocorrelation Function')
grid()
dev.off()
bitmap(file='test7.png')
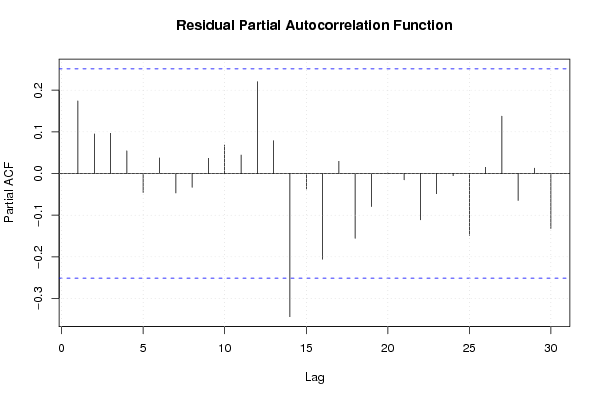
pacf(mysum$resid, lag.max=length(mysum$resid)/2, main='Residual Partial Autocorrelation Function')
grid()
dev.off()
bitmap(file='test8.png')
opar <- par(mfrow = c(2,2), oma = c(0, 0, 1.1, 0))
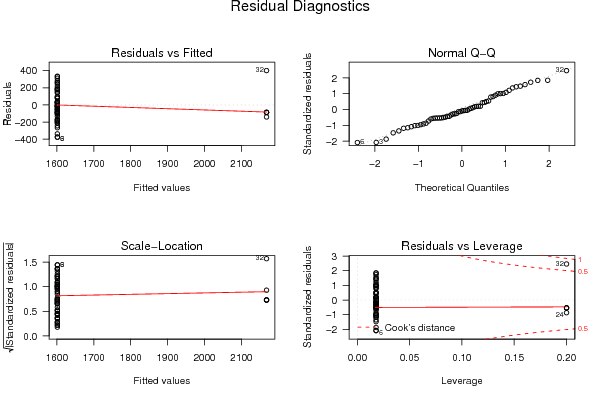
plot(mylm, las = 1, sub='Residual Diagnostics')
par(opar)
dev.off()
if (n > n25) {
bitmap(file='test9.png')
plot(kp3:nmkm3,gqarr[,2], main='Goldfeld-Quandt test',ylab='2-sided p-value',xlab='breakpoint')
grid()
dev.off()
}
load(file='createtable')
a<-table.start()
a<-table.row.start(a)
a<-table.element(a, 'Multiple Linear Regression - Estimated Regression Equation', 1, TRUE)
a<-table.row.end(a)
myeq <- colnames(x)[1]
myeq <- paste(myeq, '[t] = ', sep='')
for (i in 1:k){
if (mysum$coefficients[i,1] > 0) myeq <- paste(myeq, '+', '')
myeq <- paste(myeq, mysum$coefficients[i,1], sep=' ')
if (rownames(mysum$coefficients)[i] != '(Intercept)') {
myeq <- paste(myeq, rownames(mysum$coefficients)[i], sep='')
if (rownames(mysum$coefficients)[i] != 't') myeq <- paste(myeq, '[t]', sep='')
}
}
myeq <- paste(myeq, ' + e[t]')
a<-table.row.start(a)
a<-table.element(a, myeq)
a<-table.row.end(a)
a<-table.end(a)
table.save(a,file='mytable1.tab')
a<-table.start()
a<-table.row.start(a)
a<-table.element(a,hyperlink('ols1.htm','Multiple Linear Regression - Ordinary Least Squares',''), 6, TRUE)
a<-table.row.end(a)
a<-table.row.start(a)
a<-table.element(a,'Variable',header=TRUE)
a<-table.element(a,'Parameter',header=TRUE)
a<-table.element(a,'S.D.',header=TRUE)
a<-table.element(a,'T-STAT
H0: parameter = 0',header=TRUE)
a<-table.element(a,'2-tail p-value',header=TRUE)
a<-table.element(a,'1-tail p-value',header=TRUE)
a<-table.row.end(a)
for (i in 1:k){
a<-table.row.start(a)
a<-table.element(a,rownames(mysum$coefficients)[i],header=TRUE)
a<-table.element(a,mysum$coefficients[i,1])
a<-table.element(a, round(mysum$coefficients[i,2],6))
a<-table.element(a, round(mysum$coefficients[i,3],4))
a<-table.element(a, round(mysum$coefficients[i,4],6))
a<-table.element(a, round(mysum$coefficients[i,4]/2,6))
a<-table.row.end(a)
}
a<-table.end(a)
table.save(a,file='mytable2.tab')
a<-table.start()
a<-table.row.start(a)
a<-table.element(a, 'Multiple Linear Regression - Regression Statistics', 2, TRUE)
a<-table.row.end(a)
a<-table.row.start(a)
a<-table.element(a, 'Multiple R',1,TRUE)
a<-table.element(a, sqrt(mysum$r.squared))
a<-table.row.end(a)
a<-table.row.start(a)
a<-table.element(a, 'R-squared',1,TRUE)
a<-table.element(a, mysum$r.squared)
a<-table.row.end(a)
a<-table.row.start(a)
a<-table.element(a, 'Adjusted R-squared',1,TRUE)
a<-table.element(a, mysum$adj.r.squared)
a<-table.row.end(a)
a<-table.row.start(a)
a<-table.element(a, 'F-TEST (value)',1,TRUE)
a<-table.element(a, mysum$fstatistic[1])
a<-table.row.end(a)
a<-table.row.start(a)
a<-table.element(a, 'F-TEST (DF numerator)',1,TRUE)
a<-table.element(a, mysum$fstatistic[2])
a<-table.row.end(a)
a<-table.row.start(a)
a<-table.element(a, 'F-TEST (DF denominator)',1,TRUE)
a<-table.element(a, mysum$fstatistic[3])
a<-table.row.end(a)
a<-table.row.start(a)
a<-table.element(a, 'p-value',1,TRUE)
a<-table.element(a, 1-pf(mysum$fstatistic[1],mysum$fstatistic[2],mysum$fstatistic[3]))
a<-table.row.end(a)
a<-table.row.start(a)
a<-table.element(a, 'Multiple Linear Regression - Residual Statistics', 2, TRUE)
a<-table.row.end(a)
a<-table.row.start(a)
a<-table.element(a, 'Residual Standard Deviation',1,TRUE)
a<-table.element(a, mysum$sigma)
a<-table.row.end(a)
a<-table.row.start(a)
a<-table.element(a, 'Sum Squared Residuals',1,TRUE)
a<-table.element(a, sum(myerror*myerror))
a<-table.row.end(a)
a<-table.end(a)
table.save(a,file='mytable3.tab')
a<-table.start()
a<-table.row.start(a)
a<-table.element(a, 'Multiple Linear Regression - Actuals, Interpolation, and Residuals', 4, TRUE)
a<-table.row.end(a)
a<-table.row.start(a)
a<-table.element(a, 'Time or Index', 1, TRUE)
a<-table.element(a, 'Actuals', 1, TRUE)
a<-table.element(a, 'Interpolation
Forecast', 1, TRUE)
a<-table.element(a, 'Residuals
Prediction Error', 1, TRUE)
a<-table.row.end(a)
for (i in 1:n) {
a<-table.row.start(a)
a<-table.element(a,i, 1, TRUE)
a<-table.element(a,x[i])
a<-table.element(a,x[i]-mysum$resid[i])
a<-table.element(a,mysum$resid[i])
a<-table.row.end(a)
}
a<-table.end(a)
table.save(a,file='mytable4.tab')
if (n > n25) {
a<-table.start()
a<-table.row.start(a)
a<-table.element(a,'Goldfeld-Quandt test for Heteroskedasticity',4,TRUE)
a<-table.row.end(a)
a<-table.row.start(a)
a<-table.element(a,'p-values',header=TRUE)
a<-table.element(a,'Alternative Hypothesis',3,header=TRUE)
a<-table.row.end(a)
a<-table.row.start(a)
a<-table.element(a,'breakpoint index',header=TRUE)
a<-table.element(a,'greater',header=TRUE)
a<-table.element(a,'2-sided',header=TRUE)
a<-table.element(a,'less',header=TRUE)
a<-table.row.end(a)
for (mypoint in kp3:nmkm3) {
a<-table.row.start(a)
a<-table.element(a,mypoint,header=TRUE)
a<-table.element(a,gqarr[mypoint-kp3+1,1])
a<-table.element(a,gqarr[mypoint-kp3+1,2])
a<-table.element(a,gqarr[mypoint-kp3+1,3])
a<-table.row.end(a)
}
a<-table.end(a)
table.save(a,file='mytable5.tab')
a<-table.start()
a<-table.row.start(a)
a<-table.element(a,'Meta Analysis of Goldfeld-Quandt test for Heteroskedasticity',4,TRUE)
a<-table.row.end(a)
a<-table.row.start(a)
a<-table.element(a,'Description',header=TRUE)
a<-table.element(a,'# significant tests',header=TRUE)
a<-table.element(a,'% significant tests',header=TRUE)
a<-table.element(a,'OK/NOK',header=TRUE)
a<-table.row.end(a)
a<-table.row.start(a)
a<-table.element(a,'1% type I error level',header=TRUE)
a<-table.element(a,numsignificant1)
a<-table.element(a,numsignificant1/numgqtests)
if (numsignificant1/numgqtests < 0.01) dum <- 'OK' else dum <- 'NOK'
a<-table.element(a,dum)
a<-table.row.end(a)
a<-table.row.start(a)
a<-table.element(a,'5% type I error level',header=TRUE)
a<-table.element(a,numsignificant5)
a<-table.element(a,numsignificant5/numgqtests)
if (numsignificant5/numgqtests < 0.05) dum <- 'OK' else dum <- 'NOK'
a<-table.element(a,dum)
a<-table.row.end(a)
a<-table.row.start(a)
a<-table.element(a,'10% type I error level',header=TRUE)
a<-table.element(a,numsignificant10)
a<-table.element(a,numsignificant10/numgqtests)
if (numsignificant10/numgqtests < 0.1) dum <- 'OK' else dum <- 'NOK'
a<-table.element(a,dum)
a<-table.row.end(a)
a<-table.end(a)
table.save(a,file='mytable6.tab')
}