Free Statistics

of Irreproducible Research!

Author's title

Author*The author of this computation has been verified*
R Software Modulerwasp_multipleregression.wasp
Title produced by softwareMultiple Regression
Date of computationWed, 26 Nov 2008 13:46:12 -0700
Cite this page as followsStatistical Computations at FreeStatistics.org, Office for Research Development and Education, URL https://freestatistics.org/blog/index.php?v=date/2008/Nov/26/t1227733339w9rfwwc2pfyhxha.htm/, Retrieved Sat, 18 May 2024 19:10:13 +0000
Statistical Computations at FreeStatistics.org, Office for Research Development and Education, URL https://freestatistics.org/blog/index.php?pk=25716, Retrieved Sat, 18 May 2024 19:10:13 +0000
QR Codes:

Original text written by user:
IsPrivate?No (this computation is public)
User-defined keywordsQ3: with dummies
Estimated Impact161
Family? (F = Feedback message, R = changed R code, M = changed R Module, P = changed Parameters, D = changed Data)
F       [Multiple Regression] [Seatbelt Law] [2008-11-26 20:46:12] [da22167fec87ac24b182b1311f73761c] [Current]
-  M      [Multiple Regression] [] [2009-11-18 12:33:37] [072df11bdb18ed8d65d8164df87f26f2]
Feedback Forum
2008-12-01 11:24:52 [Li Tang Hu] [reply
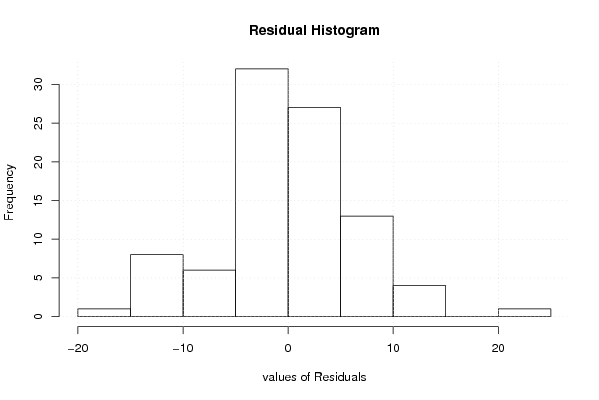
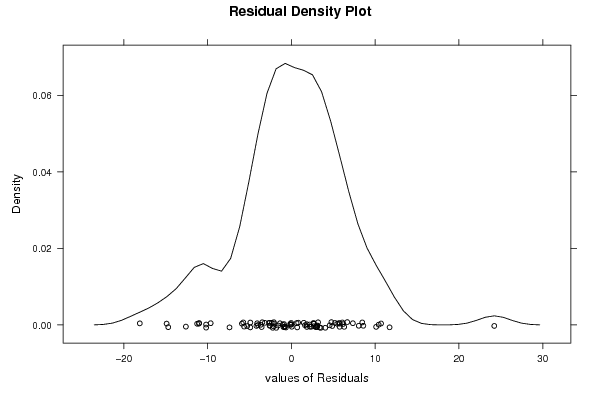
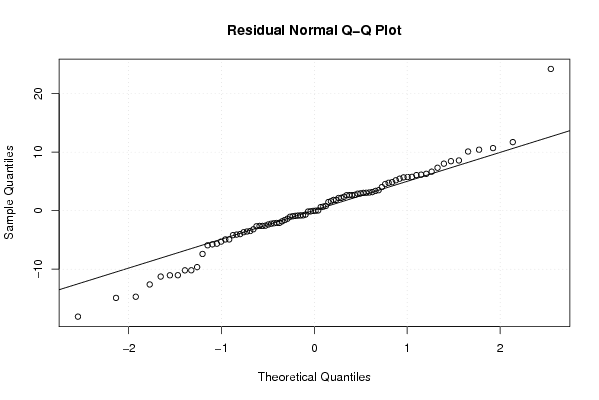
student heeft hier q3 opgelost, met toevoeging van dummy-variabele en lineaire trend.
er zijn tegenstellingen in de analyse van de student...het ene moment zegt hij dat er geen significant verschil is en de gebeurtenis aan toeval kan worden geschreven,net eronder zegt hij dan dat het NIET aan toeval kan worden beschreven...
bovendien is het nog niet een heel goed model, want er wordt niet aan alle aasumpties voldaan.

Post a new message
Dataseries X:
98,5	0
96,7	0
113,1	0
100	0
104,7	0
108,5	0
90,5	0
88,6	0
105,4	0
119,9	0
107,2	0
84,1	0
101,4	0
105,1	0
118,7	0
113,8	0
113,8	0
118,9	0
98,5	0
91	0
120,7	0
127,9	0
112,4	0
93,1	0
107,5	0
107,3	0
114,8	0
120,8	0
112,2	0
123,3	0
100,6	0
86,7	0
123,6	0
125,3	0
111,1	0
98,4	0
102,3	0
105	0
128,2	0
124,7	0
116,1	0
131,2	0
97,7	0
88,8	0
132,8	0
113,9	0
112,6	1
104,3	1
107,5	1
106	1
117,3	1
123,1	1
114,3	1
132	1
92,3	1
93,7	1
121,3	1
113,6	1
116,3	1
98,3	1
111,9	1
109,3	1
133,2	1
118	1
131,6	1
134,1	1
96,7	1
99,8	1
128,3	1
134,9	1
130,7	1
107,3	1
121,6	1
120,6	1
140,5	1
124,8	1
129,9	1
159,4	1
111	1
110,1	1
132,7	1
135	1
118,6	1
94	1
117,9	1
114,7	1
113,6	1
130,6	1
117,1	1
123,2	1
106,1	1
87,9	1


Summary of computational transaction
Raw Inputview raw input (R code)
Raw Outputview raw output of R engine
Computing time8 seconds
R Server'Herman Ole Andreas Wold' @ 193.190.124.10:1001

\begin{tabular}{lllllllll}
\hline
Summary of computational transaction \tabularnewline
Raw Input & view raw input (R code)  \tabularnewline
Raw Output & view raw output of R engine  \tabularnewline
Computing time & 8 seconds \tabularnewline
R Server & 'Herman Ole Andreas Wold' @ 193.190.124.10:1001 \tabularnewline
\hline
\end{tabular}
%Source: https://freestatistics.org/blog/index.php?pk=25716&T=0

[TABLE]
[ROW][C]Summary of computational transaction[/C][/ROW]
[ROW][C]Raw Input[/C][C]view raw input (R code) [/C][/ROW]
[ROW][C]Raw Output[/C][C]view raw output of R engine [/C][/ROW]
[ROW][C]Computing time[/C][C]8 seconds[/C][/ROW]
[ROW][C]R Server[/C][C]'Herman Ole Andreas Wold' @ 193.190.124.10:1001[/C][/ROW]
[/TABLE]
Source: https://freestatistics.org/blog/index.php?pk=25716&T=0

Globally Unique Identifier (entire table): ba.freestatistics.org/blog/index.php?pk=25716&T=0

As an alternative you can also use a QR Code:  

The GUIDs for individual cells are displayed in the table below:

Summary of computational transaction
Raw Inputview raw input (R code)
Raw Outputview raw output of R engine
Computing time8 seconds
R Server'Herman Ole Andreas Wold' @ 193.190.124.10:1001


Multiple Linear Regression - Estimated Regression Equation
Y[t] = + 86.4631868131868 -1.87596153846154X[t] + 12.5862637362637M1[t] + 11.8554258241758M2[t] + 25.9495879120879M3[t] + 22.75625M4[t] + 20.5004120879121M5[t] + 31.6195741758242M6[t] + 1.72623626373626M7[t] -4.36710164835165M8[t] + 26.9334478021978M9[t] + 27.5043956043956M10[t] + 18.7290521978022M11[t] + 0.243337912087912t + e[t]

\begin{tabular}{lllllllll}
\hline
Multiple Linear Regression - Estimated Regression Equation \tabularnewline
Y[t] =  +  86.4631868131868 -1.87596153846154X[t] +  12.5862637362637M1[t] +  11.8554258241758M2[t] +  25.9495879120879M3[t] +  22.75625M4[t] +  20.5004120879121M5[t] +  31.6195741758242M6[t] +  1.72623626373626M7[t] -4.36710164835165M8[t] +  26.9334478021978M9[t] +  27.5043956043956M10[t] +  18.7290521978022M11[t] +  0.243337912087912t  + e[t] \tabularnewline
\hline
\end{tabular}
%Source: https://freestatistics.org/blog/index.php?pk=25716&T=1

[TABLE]
[ROW][C]Multiple Linear Regression - Estimated Regression Equation[/C][/ROW]
[ROW][C]Y[t] =  +  86.4631868131868 -1.87596153846154X[t] +  12.5862637362637M1[t] +  11.8554258241758M2[t] +  25.9495879120879M3[t] +  22.75625M4[t] +  20.5004120879121M5[t] +  31.6195741758242M6[t] +  1.72623626373626M7[t] -4.36710164835165M8[t] +  26.9334478021978M9[t] +  27.5043956043956M10[t] +  18.7290521978022M11[t] +  0.243337912087912t  + e[t][/C][/ROW]
[/TABLE]
Source: https://freestatistics.org/blog/index.php?pk=25716&T=1

Globally Unique Identifier (entire table): ba.freestatistics.org/blog/index.php?pk=25716&T=1

As an alternative you can also use a QR Code:  

The GUIDs for individual cells are displayed in the table below:

Multiple Linear Regression - Estimated Regression Equation
Y[t] = + 86.4631868131868 -1.87596153846154X[t] + 12.5862637362637M1[t] + 11.8554258241758M2[t] + 25.9495879120879M3[t] + 22.75625M4[t] + 20.5004120879121M5[t] + 31.6195741758242M6[t] + 1.72623626373626M7[t] -4.36710164835165M8[t] + 26.9334478021978M9[t] + 27.5043956043956M10[t] + 18.7290521978022M11[t] + 0.243337912087912t + e[t]


Multiple Linear Regression - Ordinary Least Squares
VariableParameterS.D.T-STATH0: parameter = 02-tail p-value1-tail p-value
(Intercept)86.46318681318683.0308128.528100
X-1.875961538461542.970788-0.63150.529580.26479
M112.58626373626373.631923.46550.0008640.000432
M211.85542582417583.6308863.26520.0016260.000813
M325.94958791208793.6307147.147200
M422.756253.6314036.266500
M520.50041208791213.6329535.642900
M631.61957417582423.6353628.697800
M71.726236263736263.6386290.47440.6365260.318263
M8-4.367101648351653.642752-1.19880.2342170.117109
M926.93344780219783.759437.164200
M1027.50439560439563.7628387.309500
M1118.72905219780223.7486014.99633e-062e-06
t0.2433379120879120.0559194.35164.1e-052e-05

\begin{tabular}{lllllllll}
\hline
Multiple Linear Regression - Ordinary Least Squares \tabularnewline
Variable & Parameter & S.D. & T-STATH0: parameter = 0 & 2-tail p-value & 1-tail p-value \tabularnewline
(Intercept) & 86.4631868131868 & 3.03081 & 28.5281 & 0 & 0 \tabularnewline
X & -1.87596153846154 & 2.970788 & -0.6315 & 0.52958 & 0.26479 \tabularnewline
M1 & 12.5862637362637 & 3.63192 & 3.4655 & 0.000864 & 0.000432 \tabularnewline
M2 & 11.8554258241758 & 3.630886 & 3.2652 & 0.001626 & 0.000813 \tabularnewline
M3 & 25.9495879120879 & 3.630714 & 7.1472 & 0 & 0 \tabularnewline
M4 & 22.75625 & 3.631403 & 6.2665 & 0 & 0 \tabularnewline
M5 & 20.5004120879121 & 3.632953 & 5.6429 & 0 & 0 \tabularnewline
M6 & 31.6195741758242 & 3.635362 & 8.6978 & 0 & 0 \tabularnewline
M7 & 1.72623626373626 & 3.638629 & 0.4744 & 0.636526 & 0.318263 \tabularnewline
M8 & -4.36710164835165 & 3.642752 & -1.1988 & 0.234217 & 0.117109 \tabularnewline
M9 & 26.9334478021978 & 3.75943 & 7.1642 & 0 & 0 \tabularnewline
M10 & 27.5043956043956 & 3.762838 & 7.3095 & 0 & 0 \tabularnewline
M11 & 18.7290521978022 & 3.748601 & 4.9963 & 3e-06 & 2e-06 \tabularnewline
t & 0.243337912087912 & 0.055919 & 4.3516 & 4.1e-05 & 2e-05 \tabularnewline
\hline
\end{tabular}
%Source: https://freestatistics.org/blog/index.php?pk=25716&T=2

[TABLE]
[ROW][C]Multiple Linear Regression - Ordinary Least Squares[/C][/ROW]
[ROW][C]Variable[/C][C]Parameter[/C][C]S.D.[/C][C]T-STATH0: parameter = 0[/C][C]2-tail p-value[/C][C]1-tail p-value[/C][/ROW]
[ROW][C](Intercept)[/C][C]86.4631868131868[/C][C]3.03081[/C][C]28.5281[/C][C]0[/C][C]0[/C][/ROW]
[ROW][C]X[/C][C]-1.87596153846154[/C][C]2.970788[/C][C]-0.6315[/C][C]0.52958[/C][C]0.26479[/C][/ROW]
[ROW][C]M1[/C][C]12.5862637362637[/C][C]3.63192[/C][C]3.4655[/C][C]0.000864[/C][C]0.000432[/C][/ROW]
[ROW][C]M2[/C][C]11.8554258241758[/C][C]3.630886[/C][C]3.2652[/C][C]0.001626[/C][C]0.000813[/C][/ROW]
[ROW][C]M3[/C][C]25.9495879120879[/C][C]3.630714[/C][C]7.1472[/C][C]0[/C][C]0[/C][/ROW]
[ROW][C]M4[/C][C]22.75625[/C][C]3.631403[/C][C]6.2665[/C][C]0[/C][C]0[/C][/ROW]
[ROW][C]M5[/C][C]20.5004120879121[/C][C]3.632953[/C][C]5.6429[/C][C]0[/C][C]0[/C][/ROW]
[ROW][C]M6[/C][C]31.6195741758242[/C][C]3.635362[/C][C]8.6978[/C][C]0[/C][C]0[/C][/ROW]
[ROW][C]M7[/C][C]1.72623626373626[/C][C]3.638629[/C][C]0.4744[/C][C]0.636526[/C][C]0.318263[/C][/ROW]
[ROW][C]M8[/C][C]-4.36710164835165[/C][C]3.642752[/C][C]-1.1988[/C][C]0.234217[/C][C]0.117109[/C][/ROW]
[ROW][C]M9[/C][C]26.9334478021978[/C][C]3.75943[/C][C]7.1642[/C][C]0[/C][C]0[/C][/ROW]
[ROW][C]M10[/C][C]27.5043956043956[/C][C]3.762838[/C][C]7.3095[/C][C]0[/C][C]0[/C][/ROW]
[ROW][C]M11[/C][C]18.7290521978022[/C][C]3.748601[/C][C]4.9963[/C][C]3e-06[/C][C]2e-06[/C][/ROW]
[ROW][C]t[/C][C]0.243337912087912[/C][C]0.055919[/C][C]4.3516[/C][C]4.1e-05[/C][C]2e-05[/C][/ROW]
[/TABLE]
Source: https://freestatistics.org/blog/index.php?pk=25716&T=2

Globally Unique Identifier (entire table): ba.freestatistics.org/blog/index.php?pk=25716&T=2

As an alternative you can also use a QR Code:  

The GUIDs for individual cells are displayed in the table below:

Multiple Linear Regression - Ordinary Least Squares
VariableParameterS.D.T-STATH0: parameter = 02-tail p-value1-tail p-value
(Intercept)86.46318681318683.0308128.528100
X-1.875961538461542.970788-0.63150.529580.26479
M112.58626373626373.631923.46550.0008640.000432
M211.85542582417583.6308863.26520.0016260.000813
M325.94958791208793.6307147.147200
M422.756253.6314036.266500
M520.50041208791213.6329535.642900
M631.61957417582423.6353628.697800
M71.726236263736263.6386290.47440.6365260.318263
M8-4.367101648351653.642752-1.19880.2342170.117109
M926.93344780219783.759437.164200
M1027.50439560439563.7628387.309500
M1118.72905219780223.7486014.99633e-062e-06
t0.2433379120879120.0559194.35164.1e-052e-05


Multiple Linear Regression - Regression Statistics
Multiple R0.89006531777351
R-squared0.79221626990326
Adjusted R-squared0.75758564822047
F-TEST (value)22.8761781165759
F-TEST (DF numerator)13
F-TEST (DF denominator)78
p-value0
Multiple Linear Regression - Residual Statistics
Residual Standard Deviation7.0122100219102
Sum Squared Residuals3835.34497252747

\begin{tabular}{lllllllll}
\hline
Multiple Linear Regression - Regression Statistics \tabularnewline
Multiple R & 0.89006531777351 \tabularnewline
R-squared & 0.79221626990326 \tabularnewline
Adjusted R-squared & 0.75758564822047 \tabularnewline
F-TEST (value) & 22.8761781165759 \tabularnewline
F-TEST (DF numerator) & 13 \tabularnewline
F-TEST (DF denominator) & 78 \tabularnewline
p-value & 0 \tabularnewline
Multiple Linear Regression - Residual Statistics \tabularnewline
Residual Standard Deviation & 7.0122100219102 \tabularnewline
Sum Squared Residuals & 3835.34497252747 \tabularnewline
\hline
\end{tabular}
%Source: https://freestatistics.org/blog/index.php?pk=25716&T=3

[TABLE]
[ROW][C]Multiple Linear Regression - Regression Statistics[/C][/ROW]
[ROW][C]Multiple R[/C][C]0.89006531777351[/C][/ROW]
[ROW][C]R-squared[/C][C]0.79221626990326[/C][/ROW]
[ROW][C]Adjusted R-squared[/C][C]0.75758564822047[/C][/ROW]
[ROW][C]F-TEST (value)[/C][C]22.8761781165759[/C][/ROW]
[ROW][C]F-TEST (DF numerator)[/C][C]13[/C][/ROW]
[ROW][C]F-TEST (DF denominator)[/C][C]78[/C][/ROW]
[ROW][C]p-value[/C][C]0[/C][/ROW]
[ROW][C]Multiple Linear Regression - Residual Statistics[/C][/ROW]
[ROW][C]Residual Standard Deviation[/C][C]7.0122100219102[/C][/ROW]
[ROW][C]Sum Squared Residuals[/C][C]3835.34497252747[/C][/ROW]
[/TABLE]
Source: https://freestatistics.org/blog/index.php?pk=25716&T=3

Globally Unique Identifier (entire table): ba.freestatistics.org/blog/index.php?pk=25716&T=3

As an alternative you can also use a QR Code:  

The GUIDs for individual cells are displayed in the table below:

Multiple Linear Regression - Regression Statistics
Multiple R0.89006531777351
R-squared0.79221626990326
Adjusted R-squared0.75758564822047
F-TEST (value)22.8761781165759
F-TEST (DF numerator)13
F-TEST (DF denominator)78
p-value0
Multiple Linear Regression - Residual Statistics
Residual Standard Deviation7.0122100219102
Sum Squared Residuals3835.34497252747


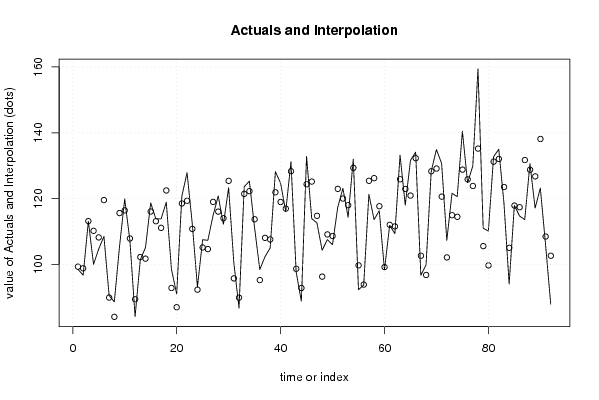
Multiple Linear Regression - Actuals, Interpolation, and Residuals
Time or IndexActualsInterpolationForecastResidualsPrediction Error
198.599.2927884615385-0.792788461538534
296.798.8052884615385-2.10528846153846
3113.1113.142788461538-0.0427884615384666
4100110.192788461538-10.1927884615385
5104.7108.180288461538-3.48028846153846
6108.5119.542788461538-11.0427884615385
790.589.89278846153850.607211538461545
888.684.04278846153854.55721153846154
9105.4115.586675824176-10.1866758241758
10119.9116.4009615384623.49903846153846
11107.2107.868956043956-0.668956043956028
1284.189.3832417582418-5.28324175824176
13101.4102.212843406593-0.812843406593395
14105.1101.7253434065933.37465659340658
15118.7116.0628434065932.6371565934066
16113.8113.1128434065930.687156593406594
17113.8111.1003434065932.69965659340659
18118.9122.462843406593-3.56284340659340
1998.592.81284340659345.68715659340659
209186.96284340659344.0371565934066
21120.7118.5067307692312.19326923076923
22127.9119.3210164835168.57898351648352
23112.4110.7890109890111.61098901098902
2493.192.30329670329670.796703296703296
25107.5105.1328983516482.36710164835166
26107.3104.6453983516482.65460164835165
27114.8118.982898351648-4.18289835164835
28120.8116.0328983516484.76710164835165
29112.2114.020398351648-1.82039835164835
30123.3125.382898351648-2.08289835164835
31100.695.73289835164834.86710164835165
3286.789.8828983516484-3.18289835164835
33123.6121.4267857142862.17321428571427
34125.3122.2410714285713.05892857142856
35111.1113.709065934066-2.60906593406594
3698.495.22335164835173.17664835164836
37102.3108.052953296703-5.75295329670329
38105107.565453296703-2.56545329670330
39128.2121.9029532967036.2970467032967
40124.7118.9529532967035.74704670329671
41116.1116.940453296703-0.8404532967033
42131.2128.3029532967032.8970467032967
4397.798.6529532967033-0.952953296703295
4488.892.8029532967033-4.0029532967033
45132.8124.3468406593418.45315934065935
46113.9125.161126373626-11.2611263736264
47112.6114.753159340659-2.15315934065935
48104.396.2674450549458.03255494505495
49107.5109.097046703297-1.59704670329669
50106108.609546703297-2.6095467032967
51117.3122.947046703297-5.6470467032967
52123.1119.9970467032973.10295329670330
53114.3117.984546703297-3.6845467032967
54132129.3470467032972.6529532967033
5592.399.6970467032967-7.3970467032967
5693.793.8470467032967-0.1470467032967
57121.3125.390934065934-4.09093406593407
58113.6126.205219780220-12.6052197802198
59116.3117.673214285714-1.37321428571429
6098.399.1875-0.887500000000006
61111.9112.017101648352-0.117101648351631
62109.3111.529601648352-2.22960164835165
63133.2125.8671016483527.33289835164835
64118122.917101648352-4.91710164835164
65131.6120.90460164835210.6953983516483
66134.1132.2671016483521.83289835164834
6796.7102.617101648352-5.91710164835165
6899.896.76710164835173.03289835164834
69128.3128.310989010989-0.0109890109889980
70134.9129.1252747252755.77472527472528
71130.7120.59326923076910.1067307692308
72107.3102.1075549450555.19244505494506
73121.6114.9371565934076.66284340659341
74120.6114.4496565934076.1503434065934
75140.5128.78715659340711.7128434065934
76124.8125.837156593407-1.03715659340659
77129.9123.8246565934076.07534340659341
78159.4135.18715659340724.2128434065934
79111105.5371565934075.46284340659341
80110.199.687156593406610.4128434065934
81132.7131.2310439560441.46895604395603
82135132.0453296703302.95467032967033
83118.6123.513324175824-4.91332417582418
8494105.027609890110-11.0276098901099
85117.9117.8572115384620.0427884615384749
86114.7117.369711538462-2.66971153846153
87113.6131.707211538462-18.1072115384615
88130.6128.7572115384621.84278846153846
89117.1126.744711538462-9.64471153846155
90123.2138.107211538462-14.9072115384615
91106.1108.457211538462-2.35721153846155
9287.9102.607211538462-14.7072115384615

\begin{tabular}{lllllllll}
\hline
Multiple Linear Regression - Actuals, Interpolation, and Residuals \tabularnewline
Time or Index & Actuals & InterpolationForecast & ResidualsPrediction Error \tabularnewline
1 & 98.5 & 99.2927884615385 & -0.792788461538534 \tabularnewline
2 & 96.7 & 98.8052884615385 & -2.10528846153846 \tabularnewline
3 & 113.1 & 113.142788461538 & -0.0427884615384666 \tabularnewline
4 & 100 & 110.192788461538 & -10.1927884615385 \tabularnewline
5 & 104.7 & 108.180288461538 & -3.48028846153846 \tabularnewline
6 & 108.5 & 119.542788461538 & -11.0427884615385 \tabularnewline
7 & 90.5 & 89.8927884615385 & 0.607211538461545 \tabularnewline
8 & 88.6 & 84.0427884615385 & 4.55721153846154 \tabularnewline
9 & 105.4 & 115.586675824176 & -10.1866758241758 \tabularnewline
10 & 119.9 & 116.400961538462 & 3.49903846153846 \tabularnewline
11 & 107.2 & 107.868956043956 & -0.668956043956028 \tabularnewline
12 & 84.1 & 89.3832417582418 & -5.28324175824176 \tabularnewline
13 & 101.4 & 102.212843406593 & -0.812843406593395 \tabularnewline
14 & 105.1 & 101.725343406593 & 3.37465659340658 \tabularnewline
15 & 118.7 & 116.062843406593 & 2.6371565934066 \tabularnewline
16 & 113.8 & 113.112843406593 & 0.687156593406594 \tabularnewline
17 & 113.8 & 111.100343406593 & 2.69965659340659 \tabularnewline
18 & 118.9 & 122.462843406593 & -3.56284340659340 \tabularnewline
19 & 98.5 & 92.8128434065934 & 5.68715659340659 \tabularnewline
20 & 91 & 86.9628434065934 & 4.0371565934066 \tabularnewline
21 & 120.7 & 118.506730769231 & 2.19326923076923 \tabularnewline
22 & 127.9 & 119.321016483516 & 8.57898351648352 \tabularnewline
23 & 112.4 & 110.789010989011 & 1.61098901098902 \tabularnewline
24 & 93.1 & 92.3032967032967 & 0.796703296703296 \tabularnewline
25 & 107.5 & 105.132898351648 & 2.36710164835166 \tabularnewline
26 & 107.3 & 104.645398351648 & 2.65460164835165 \tabularnewline
27 & 114.8 & 118.982898351648 & -4.18289835164835 \tabularnewline
28 & 120.8 & 116.032898351648 & 4.76710164835165 \tabularnewline
29 & 112.2 & 114.020398351648 & -1.82039835164835 \tabularnewline
30 & 123.3 & 125.382898351648 & -2.08289835164835 \tabularnewline
31 & 100.6 & 95.7328983516483 & 4.86710164835165 \tabularnewline
32 & 86.7 & 89.8828983516484 & -3.18289835164835 \tabularnewline
33 & 123.6 & 121.426785714286 & 2.17321428571427 \tabularnewline
34 & 125.3 & 122.241071428571 & 3.05892857142856 \tabularnewline
35 & 111.1 & 113.709065934066 & -2.60906593406594 \tabularnewline
36 & 98.4 & 95.2233516483517 & 3.17664835164836 \tabularnewline
37 & 102.3 & 108.052953296703 & -5.75295329670329 \tabularnewline
38 & 105 & 107.565453296703 & -2.56545329670330 \tabularnewline
39 & 128.2 & 121.902953296703 & 6.2970467032967 \tabularnewline
40 & 124.7 & 118.952953296703 & 5.74704670329671 \tabularnewline
41 & 116.1 & 116.940453296703 & -0.8404532967033 \tabularnewline
42 & 131.2 & 128.302953296703 & 2.8970467032967 \tabularnewline
43 & 97.7 & 98.6529532967033 & -0.952953296703295 \tabularnewline
44 & 88.8 & 92.8029532967033 & -4.0029532967033 \tabularnewline
45 & 132.8 & 124.346840659341 & 8.45315934065935 \tabularnewline
46 & 113.9 & 125.161126373626 & -11.2611263736264 \tabularnewline
47 & 112.6 & 114.753159340659 & -2.15315934065935 \tabularnewline
48 & 104.3 & 96.267445054945 & 8.03255494505495 \tabularnewline
49 & 107.5 & 109.097046703297 & -1.59704670329669 \tabularnewline
50 & 106 & 108.609546703297 & -2.6095467032967 \tabularnewline
51 & 117.3 & 122.947046703297 & -5.6470467032967 \tabularnewline
52 & 123.1 & 119.997046703297 & 3.10295329670330 \tabularnewline
53 & 114.3 & 117.984546703297 & -3.6845467032967 \tabularnewline
54 & 132 & 129.347046703297 & 2.6529532967033 \tabularnewline
55 & 92.3 & 99.6970467032967 & -7.3970467032967 \tabularnewline
56 & 93.7 & 93.8470467032967 & -0.1470467032967 \tabularnewline
57 & 121.3 & 125.390934065934 & -4.09093406593407 \tabularnewline
58 & 113.6 & 126.205219780220 & -12.6052197802198 \tabularnewline
59 & 116.3 & 117.673214285714 & -1.37321428571429 \tabularnewline
60 & 98.3 & 99.1875 & -0.887500000000006 \tabularnewline
61 & 111.9 & 112.017101648352 & -0.117101648351631 \tabularnewline
62 & 109.3 & 111.529601648352 & -2.22960164835165 \tabularnewline
63 & 133.2 & 125.867101648352 & 7.33289835164835 \tabularnewline
64 & 118 & 122.917101648352 & -4.91710164835164 \tabularnewline
65 & 131.6 & 120.904601648352 & 10.6953983516483 \tabularnewline
66 & 134.1 & 132.267101648352 & 1.83289835164834 \tabularnewline
67 & 96.7 & 102.617101648352 & -5.91710164835165 \tabularnewline
68 & 99.8 & 96.7671016483517 & 3.03289835164834 \tabularnewline
69 & 128.3 & 128.310989010989 & -0.0109890109889980 \tabularnewline
70 & 134.9 & 129.125274725275 & 5.77472527472528 \tabularnewline
71 & 130.7 & 120.593269230769 & 10.1067307692308 \tabularnewline
72 & 107.3 & 102.107554945055 & 5.19244505494506 \tabularnewline
73 & 121.6 & 114.937156593407 & 6.66284340659341 \tabularnewline
74 & 120.6 & 114.449656593407 & 6.1503434065934 \tabularnewline
75 & 140.5 & 128.787156593407 & 11.7128434065934 \tabularnewline
76 & 124.8 & 125.837156593407 & -1.03715659340659 \tabularnewline
77 & 129.9 & 123.824656593407 & 6.07534340659341 \tabularnewline
78 & 159.4 & 135.187156593407 & 24.2128434065934 \tabularnewline
79 & 111 & 105.537156593407 & 5.46284340659341 \tabularnewline
80 & 110.1 & 99.6871565934066 & 10.4128434065934 \tabularnewline
81 & 132.7 & 131.231043956044 & 1.46895604395603 \tabularnewline
82 & 135 & 132.045329670330 & 2.95467032967033 \tabularnewline
83 & 118.6 & 123.513324175824 & -4.91332417582418 \tabularnewline
84 & 94 & 105.027609890110 & -11.0276098901099 \tabularnewline
85 & 117.9 & 117.857211538462 & 0.0427884615384749 \tabularnewline
86 & 114.7 & 117.369711538462 & -2.66971153846153 \tabularnewline
87 & 113.6 & 131.707211538462 & -18.1072115384615 \tabularnewline
88 & 130.6 & 128.757211538462 & 1.84278846153846 \tabularnewline
89 & 117.1 & 126.744711538462 & -9.64471153846155 \tabularnewline
90 & 123.2 & 138.107211538462 & -14.9072115384615 \tabularnewline
91 & 106.1 & 108.457211538462 & -2.35721153846155 \tabularnewline
92 & 87.9 & 102.607211538462 & -14.7072115384615 \tabularnewline
\hline
\end{tabular}
%Source: https://freestatistics.org/blog/index.php?pk=25716&T=4

[TABLE]
[ROW][C]Multiple Linear Regression - Actuals, Interpolation, and Residuals[/C][/ROW]
[ROW][C]Time or Index[/C][C]Actuals[/C][C]InterpolationForecast[/C][C]ResidualsPrediction Error[/C][/ROW]
[ROW][C]1[/C][C]98.5[/C][C]99.2927884615385[/C][C]-0.792788461538534[/C][/ROW]
[ROW][C]2[/C][C]96.7[/C][C]98.8052884615385[/C][C]-2.10528846153846[/C][/ROW]
[ROW][C]3[/C][C]113.1[/C][C]113.142788461538[/C][C]-0.0427884615384666[/C][/ROW]
[ROW][C]4[/C][C]100[/C][C]110.192788461538[/C][C]-10.1927884615385[/C][/ROW]
[ROW][C]5[/C][C]104.7[/C][C]108.180288461538[/C][C]-3.48028846153846[/C][/ROW]
[ROW][C]6[/C][C]108.5[/C][C]119.542788461538[/C][C]-11.0427884615385[/C][/ROW]
[ROW][C]7[/C][C]90.5[/C][C]89.8927884615385[/C][C]0.607211538461545[/C][/ROW]
[ROW][C]8[/C][C]88.6[/C][C]84.0427884615385[/C][C]4.55721153846154[/C][/ROW]
[ROW][C]9[/C][C]105.4[/C][C]115.586675824176[/C][C]-10.1866758241758[/C][/ROW]
[ROW][C]10[/C][C]119.9[/C][C]116.400961538462[/C][C]3.49903846153846[/C][/ROW]
[ROW][C]11[/C][C]107.2[/C][C]107.868956043956[/C][C]-0.668956043956028[/C][/ROW]
[ROW][C]12[/C][C]84.1[/C][C]89.3832417582418[/C][C]-5.28324175824176[/C][/ROW]
[ROW][C]13[/C][C]101.4[/C][C]102.212843406593[/C][C]-0.812843406593395[/C][/ROW]
[ROW][C]14[/C][C]105.1[/C][C]101.725343406593[/C][C]3.37465659340658[/C][/ROW]
[ROW][C]15[/C][C]118.7[/C][C]116.062843406593[/C][C]2.6371565934066[/C][/ROW]
[ROW][C]16[/C][C]113.8[/C][C]113.112843406593[/C][C]0.687156593406594[/C][/ROW]
[ROW][C]17[/C][C]113.8[/C][C]111.100343406593[/C][C]2.69965659340659[/C][/ROW]
[ROW][C]18[/C][C]118.9[/C][C]122.462843406593[/C][C]-3.56284340659340[/C][/ROW]
[ROW][C]19[/C][C]98.5[/C][C]92.8128434065934[/C][C]5.68715659340659[/C][/ROW]
[ROW][C]20[/C][C]91[/C][C]86.9628434065934[/C][C]4.0371565934066[/C][/ROW]
[ROW][C]21[/C][C]120.7[/C][C]118.506730769231[/C][C]2.19326923076923[/C][/ROW]
[ROW][C]22[/C][C]127.9[/C][C]119.321016483516[/C][C]8.57898351648352[/C][/ROW]
[ROW][C]23[/C][C]112.4[/C][C]110.789010989011[/C][C]1.61098901098902[/C][/ROW]
[ROW][C]24[/C][C]93.1[/C][C]92.3032967032967[/C][C]0.796703296703296[/C][/ROW]
[ROW][C]25[/C][C]107.5[/C][C]105.132898351648[/C][C]2.36710164835166[/C][/ROW]
[ROW][C]26[/C][C]107.3[/C][C]104.645398351648[/C][C]2.65460164835165[/C][/ROW]
[ROW][C]27[/C][C]114.8[/C][C]118.982898351648[/C][C]-4.18289835164835[/C][/ROW]
[ROW][C]28[/C][C]120.8[/C][C]116.032898351648[/C][C]4.76710164835165[/C][/ROW]
[ROW][C]29[/C][C]112.2[/C][C]114.020398351648[/C][C]-1.82039835164835[/C][/ROW]
[ROW][C]30[/C][C]123.3[/C][C]125.382898351648[/C][C]-2.08289835164835[/C][/ROW]
[ROW][C]31[/C][C]100.6[/C][C]95.7328983516483[/C][C]4.86710164835165[/C][/ROW]
[ROW][C]32[/C][C]86.7[/C][C]89.8828983516484[/C][C]-3.18289835164835[/C][/ROW]
[ROW][C]33[/C][C]123.6[/C][C]121.426785714286[/C][C]2.17321428571427[/C][/ROW]
[ROW][C]34[/C][C]125.3[/C][C]122.241071428571[/C][C]3.05892857142856[/C][/ROW]
[ROW][C]35[/C][C]111.1[/C][C]113.709065934066[/C][C]-2.60906593406594[/C][/ROW]
[ROW][C]36[/C][C]98.4[/C][C]95.2233516483517[/C][C]3.17664835164836[/C][/ROW]
[ROW][C]37[/C][C]102.3[/C][C]108.052953296703[/C][C]-5.75295329670329[/C][/ROW]
[ROW][C]38[/C][C]105[/C][C]107.565453296703[/C][C]-2.56545329670330[/C][/ROW]
[ROW][C]39[/C][C]128.2[/C][C]121.902953296703[/C][C]6.2970467032967[/C][/ROW]
[ROW][C]40[/C][C]124.7[/C][C]118.952953296703[/C][C]5.74704670329671[/C][/ROW]
[ROW][C]41[/C][C]116.1[/C][C]116.940453296703[/C][C]-0.8404532967033[/C][/ROW]
[ROW][C]42[/C][C]131.2[/C][C]128.302953296703[/C][C]2.8970467032967[/C][/ROW]
[ROW][C]43[/C][C]97.7[/C][C]98.6529532967033[/C][C]-0.952953296703295[/C][/ROW]
[ROW][C]44[/C][C]88.8[/C][C]92.8029532967033[/C][C]-4.0029532967033[/C][/ROW]
[ROW][C]45[/C][C]132.8[/C][C]124.346840659341[/C][C]8.45315934065935[/C][/ROW]
[ROW][C]46[/C][C]113.9[/C][C]125.161126373626[/C][C]-11.2611263736264[/C][/ROW]
[ROW][C]47[/C][C]112.6[/C][C]114.753159340659[/C][C]-2.15315934065935[/C][/ROW]
[ROW][C]48[/C][C]104.3[/C][C]96.267445054945[/C][C]8.03255494505495[/C][/ROW]
[ROW][C]49[/C][C]107.5[/C][C]109.097046703297[/C][C]-1.59704670329669[/C][/ROW]
[ROW][C]50[/C][C]106[/C][C]108.609546703297[/C][C]-2.6095467032967[/C][/ROW]
[ROW][C]51[/C][C]117.3[/C][C]122.947046703297[/C][C]-5.6470467032967[/C][/ROW]
[ROW][C]52[/C][C]123.1[/C][C]119.997046703297[/C][C]3.10295329670330[/C][/ROW]
[ROW][C]53[/C][C]114.3[/C][C]117.984546703297[/C][C]-3.6845467032967[/C][/ROW]
[ROW][C]54[/C][C]132[/C][C]129.347046703297[/C][C]2.6529532967033[/C][/ROW]
[ROW][C]55[/C][C]92.3[/C][C]99.6970467032967[/C][C]-7.3970467032967[/C][/ROW]
[ROW][C]56[/C][C]93.7[/C][C]93.8470467032967[/C][C]-0.1470467032967[/C][/ROW]
[ROW][C]57[/C][C]121.3[/C][C]125.390934065934[/C][C]-4.09093406593407[/C][/ROW]
[ROW][C]58[/C][C]113.6[/C][C]126.205219780220[/C][C]-12.6052197802198[/C][/ROW]
[ROW][C]59[/C][C]116.3[/C][C]117.673214285714[/C][C]-1.37321428571429[/C][/ROW]
[ROW][C]60[/C][C]98.3[/C][C]99.1875[/C][C]-0.887500000000006[/C][/ROW]
[ROW][C]61[/C][C]111.9[/C][C]112.017101648352[/C][C]-0.117101648351631[/C][/ROW]
[ROW][C]62[/C][C]109.3[/C][C]111.529601648352[/C][C]-2.22960164835165[/C][/ROW]
[ROW][C]63[/C][C]133.2[/C][C]125.867101648352[/C][C]7.33289835164835[/C][/ROW]
[ROW][C]64[/C][C]118[/C][C]122.917101648352[/C][C]-4.91710164835164[/C][/ROW]
[ROW][C]65[/C][C]131.6[/C][C]120.904601648352[/C][C]10.6953983516483[/C][/ROW]
[ROW][C]66[/C][C]134.1[/C][C]132.267101648352[/C][C]1.83289835164834[/C][/ROW]
[ROW][C]67[/C][C]96.7[/C][C]102.617101648352[/C][C]-5.91710164835165[/C][/ROW]
[ROW][C]68[/C][C]99.8[/C][C]96.7671016483517[/C][C]3.03289835164834[/C][/ROW]
[ROW][C]69[/C][C]128.3[/C][C]128.310989010989[/C][C]-0.0109890109889980[/C][/ROW]
[ROW][C]70[/C][C]134.9[/C][C]129.125274725275[/C][C]5.77472527472528[/C][/ROW]
[ROW][C]71[/C][C]130.7[/C][C]120.593269230769[/C][C]10.1067307692308[/C][/ROW]
[ROW][C]72[/C][C]107.3[/C][C]102.107554945055[/C][C]5.19244505494506[/C][/ROW]
[ROW][C]73[/C][C]121.6[/C][C]114.937156593407[/C][C]6.66284340659341[/C][/ROW]
[ROW][C]74[/C][C]120.6[/C][C]114.449656593407[/C][C]6.1503434065934[/C][/ROW]
[ROW][C]75[/C][C]140.5[/C][C]128.787156593407[/C][C]11.7128434065934[/C][/ROW]
[ROW][C]76[/C][C]124.8[/C][C]125.837156593407[/C][C]-1.03715659340659[/C][/ROW]
[ROW][C]77[/C][C]129.9[/C][C]123.824656593407[/C][C]6.07534340659341[/C][/ROW]
[ROW][C]78[/C][C]159.4[/C][C]135.187156593407[/C][C]24.2128434065934[/C][/ROW]
[ROW][C]79[/C][C]111[/C][C]105.537156593407[/C][C]5.46284340659341[/C][/ROW]
[ROW][C]80[/C][C]110.1[/C][C]99.6871565934066[/C][C]10.4128434065934[/C][/ROW]
[ROW][C]81[/C][C]132.7[/C][C]131.231043956044[/C][C]1.46895604395603[/C][/ROW]
[ROW][C]82[/C][C]135[/C][C]132.045329670330[/C][C]2.95467032967033[/C][/ROW]
[ROW][C]83[/C][C]118.6[/C][C]123.513324175824[/C][C]-4.91332417582418[/C][/ROW]
[ROW][C]84[/C][C]94[/C][C]105.027609890110[/C][C]-11.0276098901099[/C][/ROW]
[ROW][C]85[/C][C]117.9[/C][C]117.857211538462[/C][C]0.0427884615384749[/C][/ROW]
[ROW][C]86[/C][C]114.7[/C][C]117.369711538462[/C][C]-2.66971153846153[/C][/ROW]
[ROW][C]87[/C][C]113.6[/C][C]131.707211538462[/C][C]-18.1072115384615[/C][/ROW]
[ROW][C]88[/C][C]130.6[/C][C]128.757211538462[/C][C]1.84278846153846[/C][/ROW]
[ROW][C]89[/C][C]117.1[/C][C]126.744711538462[/C][C]-9.64471153846155[/C][/ROW]
[ROW][C]90[/C][C]123.2[/C][C]138.107211538462[/C][C]-14.9072115384615[/C][/ROW]
[ROW][C]91[/C][C]106.1[/C][C]108.457211538462[/C][C]-2.35721153846155[/C][/ROW]
[ROW][C]92[/C][C]87.9[/C][C]102.607211538462[/C][C]-14.7072115384615[/C][/ROW]
[/TABLE]
Source: https://freestatistics.org/blog/index.php?pk=25716&T=4

Globally Unique Identifier (entire table): ba.freestatistics.org/blog/index.php?pk=25716&T=4

As an alternative you can also use a QR Code:  

The GUIDs for individual cells are displayed in the table below:

Multiple Linear Regression - Actuals, Interpolation, and Residuals
Time or IndexActualsInterpolationForecastResidualsPrediction Error
198.599.2927884615385-0.792788461538534
296.798.8052884615385-2.10528846153846
3113.1113.142788461538-0.0427884615384666
4100110.192788461538-10.1927884615385
5104.7108.180288461538-3.48028846153846
6108.5119.542788461538-11.0427884615385
790.589.89278846153850.607211538461545
888.684.04278846153854.55721153846154
9105.4115.586675824176-10.1866758241758
10119.9116.4009615384623.49903846153846
11107.2107.868956043956-0.668956043956028
1284.189.3832417582418-5.28324175824176
13101.4102.212843406593-0.812843406593395
14105.1101.7253434065933.37465659340658
15118.7116.0628434065932.6371565934066
16113.8113.1128434065930.687156593406594
17113.8111.1003434065932.69965659340659
18118.9122.462843406593-3.56284340659340
1998.592.81284340659345.68715659340659
209186.96284340659344.0371565934066
21120.7118.5067307692312.19326923076923
22127.9119.3210164835168.57898351648352
23112.4110.7890109890111.61098901098902
2493.192.30329670329670.796703296703296
25107.5105.1328983516482.36710164835166
26107.3104.6453983516482.65460164835165
27114.8118.982898351648-4.18289835164835
28120.8116.0328983516484.76710164835165
29112.2114.020398351648-1.82039835164835
30123.3125.382898351648-2.08289835164835
31100.695.73289835164834.86710164835165
3286.789.8828983516484-3.18289835164835
33123.6121.4267857142862.17321428571427
34125.3122.2410714285713.05892857142856
35111.1113.709065934066-2.60906593406594
3698.495.22335164835173.17664835164836
37102.3108.052953296703-5.75295329670329
38105107.565453296703-2.56545329670330
39128.2121.9029532967036.2970467032967
40124.7118.9529532967035.74704670329671
41116.1116.940453296703-0.8404532967033
42131.2128.3029532967032.8970467032967
4397.798.6529532967033-0.952953296703295
4488.892.8029532967033-4.0029532967033
45132.8124.3468406593418.45315934065935
46113.9125.161126373626-11.2611263736264
47112.6114.753159340659-2.15315934065935
48104.396.2674450549458.03255494505495
49107.5109.097046703297-1.59704670329669
50106108.609546703297-2.6095467032967
51117.3122.947046703297-5.6470467032967
52123.1119.9970467032973.10295329670330
53114.3117.984546703297-3.6845467032967
54132129.3470467032972.6529532967033
5592.399.6970467032967-7.3970467032967
5693.793.8470467032967-0.1470467032967
57121.3125.390934065934-4.09093406593407
58113.6126.205219780220-12.6052197802198
59116.3117.673214285714-1.37321428571429
6098.399.1875-0.887500000000006
61111.9112.017101648352-0.117101648351631
62109.3111.529601648352-2.22960164835165
63133.2125.8671016483527.33289835164835
64118122.917101648352-4.91710164835164
65131.6120.90460164835210.6953983516483
66134.1132.2671016483521.83289835164834
6796.7102.617101648352-5.91710164835165
6899.896.76710164835173.03289835164834
69128.3128.310989010989-0.0109890109889980
70134.9129.1252747252755.77472527472528
71130.7120.59326923076910.1067307692308
72107.3102.1075549450555.19244505494506
73121.6114.9371565934076.66284340659341
74120.6114.4496565934076.1503434065934
75140.5128.78715659340711.7128434065934
76124.8125.837156593407-1.03715659340659
77129.9123.8246565934076.07534340659341
78159.4135.18715659340724.2128434065934
79111105.5371565934075.46284340659341
80110.199.687156593406610.4128434065934
81132.7131.2310439560441.46895604395603
82135132.0453296703302.95467032967033
83118.6123.513324175824-4.91332417582418
8494105.027609890110-11.0276098901099
85117.9117.8572115384620.0427884615384749
86114.7117.369711538462-2.66971153846153
87113.6131.707211538462-18.1072115384615
88130.6128.7572115384621.84278846153846
89117.1126.744711538462-9.64471153846155
90123.2138.107211538462-14.9072115384615
91106.1108.457211538462-2.35721153846155
9287.9102.607211538462-14.7072115384615


Goldfeld-Quandt test for Heteroskedasticity
p-valuesAlternative Hypothesis
breakpoint indexgreater2-sidedless
170.1093441658770230.2186883317540460.890655834122977
180.04590352102346320.09180704204692640.954096478976537
190.01576829391572730.03153658783145450.984231706084273
200.01282813285799450.02565626571598910.987171867142005
210.01553455264242840.03106910528485680.984465447357572
220.006637771092101430.01327554218420290.993362228907899
230.00309679252787020.00619358505574040.99690320747213
240.001146186428907300.002292372857814590.998853813571093
250.0007495524701859090.001499104940371820.999250447529814
260.0005257372624862140.001051474524972430.999474262737514
270.003358680426490250.006717360852980510.99664131957351
280.002300612618540980.004601225237081960.99769938738146
290.002044452844717660.004088905689435320.997955547155282
300.001004201496263540.002008402992527080.998995798503736
310.0005349564872164930.001069912974432990.999465043512784
320.001836115819661360.003672231639322720.998163884180339
330.0009889786917518810.001977957383503760.999011021308248
340.0008662256045874720.001732451209174940.999133774395413
350.0006734351728690510.001346870345738100.999326564827131
360.0003583955476596750.000716791095319350.99964160445234
370.0006445608176068520.001289121635213700.999355439182393
380.0005326621540669420.001065324308133880.999467337845933
390.0003817776795178560.0007635553590357120.999618222320482
400.0002709858014978550.000541971602995710.999729014198502
410.0001425985849684160.0002851971699368320.999857401415032
420.0001026864120902730.0002053728241805460.99989731358791
430.0001003324418097280.0002006648836194550.99989966755819
440.0001072771333951120.0002145542667902240.999892722866605
450.0001795799653510600.0003591599307021210.999820420034649
460.00167885202291570.00335770404583140.998321147977084
470.0009784221992823550.001956844398564710.999021577800718
480.0009248978591039070.001849795718207810.999075102140896
490.0005789643922033130.001157928784406630.999421035607797
500.0003804546512118640.0007609093024237280.999619545348788
510.0003494952933868150.000698990586773630.999650504706613
520.0001951848877204130.0003903697754408260.99980481511228
530.0001312902161416490.0002625804322832980.999868709783858
549.31377158575369e-050.0001862754317150740.999906862284142
550.0001399041265738180.0002798082531476370.999860095873426
567.35407161435815e-050.0001470814322871630.999926459283856
575.10374520836822e-050.0001020749041673640.999948962547916
580.0003698381290852360.0007396762581704730.999630161870915
590.0002765558577228120.0005531117154456240.999723444142277
600.0001517509565397130.0003035019130794260.99984824904346
610.0001240171819033890.0002480343638067790.999875982818097
620.0001174451597116960.0002348903194233920.999882554840288
638.96686079923559e-050.0001793372159847120.999910331392008
640.0001466100729414240.0002932201458828480.999853389927059
650.0001844676298098610.0003689352596197220.99981553237019
660.0002682015177035770.0005364030354071540.999731798482296
670.002200131842609430.004400263685218860.99779986815739
680.003227512428994480.006455024857988950.996772487571006
690.004956200384759070.009912400769518140.99504379961524
700.006649143316729650.01329828663345930.99335085668327
710.004689654056594230.009379308113188460.995310345943406
720.00220277086334880.00440554172669760.997797229136651
730.001870398600310860.003740797200621720.99812960139969
740.001311966678641510.002623933357283030.998688033321358
750.001309474681268670.002618949362537350.998690525318731

\begin{tabular}{lllllllll}
\hline
Goldfeld-Quandt test for Heteroskedasticity \tabularnewline
p-values & Alternative Hypothesis \tabularnewline
breakpoint index & greater & 2-sided & less \tabularnewline
17 & 0.109344165877023 & 0.218688331754046 & 0.890655834122977 \tabularnewline
18 & 0.0459035210234632 & 0.0918070420469264 & 0.954096478976537 \tabularnewline
19 & 0.0157682939157273 & 0.0315365878314545 & 0.984231706084273 \tabularnewline
20 & 0.0128281328579945 & 0.0256562657159891 & 0.987171867142005 \tabularnewline
21 & 0.0155345526424284 & 0.0310691052848568 & 0.984465447357572 \tabularnewline
22 & 0.00663777109210143 & 0.0132755421842029 & 0.993362228907899 \tabularnewline
23 & 0.0030967925278702 & 0.0061935850557404 & 0.99690320747213 \tabularnewline
24 & 0.00114618642890730 & 0.00229237285781459 & 0.998853813571093 \tabularnewline
25 & 0.000749552470185909 & 0.00149910494037182 & 0.999250447529814 \tabularnewline
26 & 0.000525737262486214 & 0.00105147452497243 & 0.999474262737514 \tabularnewline
27 & 0.00335868042649025 & 0.00671736085298051 & 0.99664131957351 \tabularnewline
28 & 0.00230061261854098 & 0.00460122523708196 & 0.99769938738146 \tabularnewline
29 & 0.00204445284471766 & 0.00408890568943532 & 0.997955547155282 \tabularnewline
30 & 0.00100420149626354 & 0.00200840299252708 & 0.998995798503736 \tabularnewline
31 & 0.000534956487216493 & 0.00106991297443299 & 0.999465043512784 \tabularnewline
32 & 0.00183611581966136 & 0.00367223163932272 & 0.998163884180339 \tabularnewline
33 & 0.000988978691751881 & 0.00197795738350376 & 0.999011021308248 \tabularnewline
34 & 0.000866225604587472 & 0.00173245120917494 & 0.999133774395413 \tabularnewline
35 & 0.000673435172869051 & 0.00134687034573810 & 0.999326564827131 \tabularnewline
36 & 0.000358395547659675 & 0.00071679109531935 & 0.99964160445234 \tabularnewline
37 & 0.000644560817606852 & 0.00128912163521370 & 0.999355439182393 \tabularnewline
38 & 0.000532662154066942 & 0.00106532430813388 & 0.999467337845933 \tabularnewline
39 & 0.000381777679517856 & 0.000763555359035712 & 0.999618222320482 \tabularnewline
40 & 0.000270985801497855 & 0.00054197160299571 & 0.999729014198502 \tabularnewline
41 & 0.000142598584968416 & 0.000285197169936832 & 0.999857401415032 \tabularnewline
42 & 0.000102686412090273 & 0.000205372824180546 & 0.99989731358791 \tabularnewline
43 & 0.000100332441809728 & 0.000200664883619455 & 0.99989966755819 \tabularnewline
44 & 0.000107277133395112 & 0.000214554266790224 & 0.999892722866605 \tabularnewline
45 & 0.000179579965351060 & 0.000359159930702121 & 0.999820420034649 \tabularnewline
46 & 0.0016788520229157 & 0.0033577040458314 & 0.998321147977084 \tabularnewline
47 & 0.000978422199282355 & 0.00195684439856471 & 0.999021577800718 \tabularnewline
48 & 0.000924897859103907 & 0.00184979571820781 & 0.999075102140896 \tabularnewline
49 & 0.000578964392203313 & 0.00115792878440663 & 0.999421035607797 \tabularnewline
50 & 0.000380454651211864 & 0.000760909302423728 & 0.999619545348788 \tabularnewline
51 & 0.000349495293386815 & 0.00069899058677363 & 0.999650504706613 \tabularnewline
52 & 0.000195184887720413 & 0.000390369775440826 & 0.99980481511228 \tabularnewline
53 & 0.000131290216141649 & 0.000262580432283298 & 0.999868709783858 \tabularnewline
54 & 9.31377158575369e-05 & 0.000186275431715074 & 0.999906862284142 \tabularnewline
55 & 0.000139904126573818 & 0.000279808253147637 & 0.999860095873426 \tabularnewline
56 & 7.35407161435815e-05 & 0.000147081432287163 & 0.999926459283856 \tabularnewline
57 & 5.10374520836822e-05 & 0.000102074904167364 & 0.999948962547916 \tabularnewline
58 & 0.000369838129085236 & 0.000739676258170473 & 0.999630161870915 \tabularnewline
59 & 0.000276555857722812 & 0.000553111715445624 & 0.999723444142277 \tabularnewline
60 & 0.000151750956539713 & 0.000303501913079426 & 0.99984824904346 \tabularnewline
61 & 0.000124017181903389 & 0.000248034363806779 & 0.999875982818097 \tabularnewline
62 & 0.000117445159711696 & 0.000234890319423392 & 0.999882554840288 \tabularnewline
63 & 8.96686079923559e-05 & 0.000179337215984712 & 0.999910331392008 \tabularnewline
64 & 0.000146610072941424 & 0.000293220145882848 & 0.999853389927059 \tabularnewline
65 & 0.000184467629809861 & 0.000368935259619722 & 0.99981553237019 \tabularnewline
66 & 0.000268201517703577 & 0.000536403035407154 & 0.999731798482296 \tabularnewline
67 & 0.00220013184260943 & 0.00440026368521886 & 0.99779986815739 \tabularnewline
68 & 0.00322751242899448 & 0.00645502485798895 & 0.996772487571006 \tabularnewline
69 & 0.00495620038475907 & 0.00991240076951814 & 0.99504379961524 \tabularnewline
70 & 0.00664914331672965 & 0.0132982866334593 & 0.99335085668327 \tabularnewline
71 & 0.00468965405659423 & 0.00937930811318846 & 0.995310345943406 \tabularnewline
72 & 0.0022027708633488 & 0.0044055417266976 & 0.997797229136651 \tabularnewline
73 & 0.00187039860031086 & 0.00374079720062172 & 0.99812960139969 \tabularnewline
74 & 0.00131196667864151 & 0.00262393335728303 & 0.998688033321358 \tabularnewline
75 & 0.00130947468126867 & 0.00261894936253735 & 0.998690525318731 \tabularnewline
\hline
\end{tabular}
%Source: https://freestatistics.org/blog/index.php?pk=25716&T=5

[TABLE]
[ROW][C]Goldfeld-Quandt test for Heteroskedasticity[/C][/ROW]
[ROW][C]p-values[/C][C]Alternative Hypothesis[/C][/ROW]
[ROW][C]breakpoint index[/C][C]greater[/C][C]2-sided[/C][C]less[/C][/ROW]
[ROW][C]17[/C][C]0.109344165877023[/C][C]0.218688331754046[/C][C]0.890655834122977[/C][/ROW]
[ROW][C]18[/C][C]0.0459035210234632[/C][C]0.0918070420469264[/C][C]0.954096478976537[/C][/ROW]
[ROW][C]19[/C][C]0.0157682939157273[/C][C]0.0315365878314545[/C][C]0.984231706084273[/C][/ROW]
[ROW][C]20[/C][C]0.0128281328579945[/C][C]0.0256562657159891[/C][C]0.987171867142005[/C][/ROW]
[ROW][C]21[/C][C]0.0155345526424284[/C][C]0.0310691052848568[/C][C]0.984465447357572[/C][/ROW]
[ROW][C]22[/C][C]0.00663777109210143[/C][C]0.0132755421842029[/C][C]0.993362228907899[/C][/ROW]
[ROW][C]23[/C][C]0.0030967925278702[/C][C]0.0061935850557404[/C][C]0.99690320747213[/C][/ROW]
[ROW][C]24[/C][C]0.00114618642890730[/C][C]0.00229237285781459[/C][C]0.998853813571093[/C][/ROW]
[ROW][C]25[/C][C]0.000749552470185909[/C][C]0.00149910494037182[/C][C]0.999250447529814[/C][/ROW]
[ROW][C]26[/C][C]0.000525737262486214[/C][C]0.00105147452497243[/C][C]0.999474262737514[/C][/ROW]
[ROW][C]27[/C][C]0.00335868042649025[/C][C]0.00671736085298051[/C][C]0.99664131957351[/C][/ROW]
[ROW][C]28[/C][C]0.00230061261854098[/C][C]0.00460122523708196[/C][C]0.99769938738146[/C][/ROW]
[ROW][C]29[/C][C]0.00204445284471766[/C][C]0.00408890568943532[/C][C]0.997955547155282[/C][/ROW]
[ROW][C]30[/C][C]0.00100420149626354[/C][C]0.00200840299252708[/C][C]0.998995798503736[/C][/ROW]
[ROW][C]31[/C][C]0.000534956487216493[/C][C]0.00106991297443299[/C][C]0.999465043512784[/C][/ROW]
[ROW][C]32[/C][C]0.00183611581966136[/C][C]0.00367223163932272[/C][C]0.998163884180339[/C][/ROW]
[ROW][C]33[/C][C]0.000988978691751881[/C][C]0.00197795738350376[/C][C]0.999011021308248[/C][/ROW]
[ROW][C]34[/C][C]0.000866225604587472[/C][C]0.00173245120917494[/C][C]0.999133774395413[/C][/ROW]
[ROW][C]35[/C][C]0.000673435172869051[/C][C]0.00134687034573810[/C][C]0.999326564827131[/C][/ROW]
[ROW][C]36[/C][C]0.000358395547659675[/C][C]0.00071679109531935[/C][C]0.99964160445234[/C][/ROW]
[ROW][C]37[/C][C]0.000644560817606852[/C][C]0.00128912163521370[/C][C]0.999355439182393[/C][/ROW]
[ROW][C]38[/C][C]0.000532662154066942[/C][C]0.00106532430813388[/C][C]0.999467337845933[/C][/ROW]
[ROW][C]39[/C][C]0.000381777679517856[/C][C]0.000763555359035712[/C][C]0.999618222320482[/C][/ROW]
[ROW][C]40[/C][C]0.000270985801497855[/C][C]0.00054197160299571[/C][C]0.999729014198502[/C][/ROW]
[ROW][C]41[/C][C]0.000142598584968416[/C][C]0.000285197169936832[/C][C]0.999857401415032[/C][/ROW]
[ROW][C]42[/C][C]0.000102686412090273[/C][C]0.000205372824180546[/C][C]0.99989731358791[/C][/ROW]
[ROW][C]43[/C][C]0.000100332441809728[/C][C]0.000200664883619455[/C][C]0.99989966755819[/C][/ROW]
[ROW][C]44[/C][C]0.000107277133395112[/C][C]0.000214554266790224[/C][C]0.999892722866605[/C][/ROW]
[ROW][C]45[/C][C]0.000179579965351060[/C][C]0.000359159930702121[/C][C]0.999820420034649[/C][/ROW]
[ROW][C]46[/C][C]0.0016788520229157[/C][C]0.0033577040458314[/C][C]0.998321147977084[/C][/ROW]
[ROW][C]47[/C][C]0.000978422199282355[/C][C]0.00195684439856471[/C][C]0.999021577800718[/C][/ROW]
[ROW][C]48[/C][C]0.000924897859103907[/C][C]0.00184979571820781[/C][C]0.999075102140896[/C][/ROW]
[ROW][C]49[/C][C]0.000578964392203313[/C][C]0.00115792878440663[/C][C]0.999421035607797[/C][/ROW]
[ROW][C]50[/C][C]0.000380454651211864[/C][C]0.000760909302423728[/C][C]0.999619545348788[/C][/ROW]
[ROW][C]51[/C][C]0.000349495293386815[/C][C]0.00069899058677363[/C][C]0.999650504706613[/C][/ROW]
[ROW][C]52[/C][C]0.000195184887720413[/C][C]0.000390369775440826[/C][C]0.99980481511228[/C][/ROW]
[ROW][C]53[/C][C]0.000131290216141649[/C][C]0.000262580432283298[/C][C]0.999868709783858[/C][/ROW]
[ROW][C]54[/C][C]9.31377158575369e-05[/C][C]0.000186275431715074[/C][C]0.999906862284142[/C][/ROW]
[ROW][C]55[/C][C]0.000139904126573818[/C][C]0.000279808253147637[/C][C]0.999860095873426[/C][/ROW]
[ROW][C]56[/C][C]7.35407161435815e-05[/C][C]0.000147081432287163[/C][C]0.999926459283856[/C][/ROW]
[ROW][C]57[/C][C]5.10374520836822e-05[/C][C]0.000102074904167364[/C][C]0.999948962547916[/C][/ROW]
[ROW][C]58[/C][C]0.000369838129085236[/C][C]0.000739676258170473[/C][C]0.999630161870915[/C][/ROW]
[ROW][C]59[/C][C]0.000276555857722812[/C][C]0.000553111715445624[/C][C]0.999723444142277[/C][/ROW]
[ROW][C]60[/C][C]0.000151750956539713[/C][C]0.000303501913079426[/C][C]0.99984824904346[/C][/ROW]
[ROW][C]61[/C][C]0.000124017181903389[/C][C]0.000248034363806779[/C][C]0.999875982818097[/C][/ROW]
[ROW][C]62[/C][C]0.000117445159711696[/C][C]0.000234890319423392[/C][C]0.999882554840288[/C][/ROW]
[ROW][C]63[/C][C]8.96686079923559e-05[/C][C]0.000179337215984712[/C][C]0.999910331392008[/C][/ROW]
[ROW][C]64[/C][C]0.000146610072941424[/C][C]0.000293220145882848[/C][C]0.999853389927059[/C][/ROW]
[ROW][C]65[/C][C]0.000184467629809861[/C][C]0.000368935259619722[/C][C]0.99981553237019[/C][/ROW]
[ROW][C]66[/C][C]0.000268201517703577[/C][C]0.000536403035407154[/C][C]0.999731798482296[/C][/ROW]
[ROW][C]67[/C][C]0.00220013184260943[/C][C]0.00440026368521886[/C][C]0.99779986815739[/C][/ROW]
[ROW][C]68[/C][C]0.00322751242899448[/C][C]0.00645502485798895[/C][C]0.996772487571006[/C][/ROW]
[ROW][C]69[/C][C]0.00495620038475907[/C][C]0.00991240076951814[/C][C]0.99504379961524[/C][/ROW]
[ROW][C]70[/C][C]0.00664914331672965[/C][C]0.0132982866334593[/C][C]0.99335085668327[/C][/ROW]
[ROW][C]71[/C][C]0.00468965405659423[/C][C]0.00937930811318846[/C][C]0.995310345943406[/C][/ROW]
[ROW][C]72[/C][C]0.0022027708633488[/C][C]0.0044055417266976[/C][C]0.997797229136651[/C][/ROW]
[ROW][C]73[/C][C]0.00187039860031086[/C][C]0.00374079720062172[/C][C]0.99812960139969[/C][/ROW]
[ROW][C]74[/C][C]0.00131196667864151[/C][C]0.00262393335728303[/C][C]0.998688033321358[/C][/ROW]
[ROW][C]75[/C][C]0.00130947468126867[/C][C]0.00261894936253735[/C][C]0.998690525318731[/C][/ROW]
[/TABLE]
Source: https://freestatistics.org/blog/index.php?pk=25716&T=5

Globally Unique Identifier (entire table): ba.freestatistics.org/blog/index.php?pk=25716&T=5

As an alternative you can also use a QR Code:  

The GUIDs for individual cells are displayed in the table below:

Goldfeld-Quandt test for Heteroskedasticity
p-valuesAlternative Hypothesis
breakpoint indexgreater2-sidedless
170.1093441658770230.2186883317540460.890655834122977
180.04590352102346320.09180704204692640.954096478976537
190.01576829391572730.03153658783145450.984231706084273
200.01282813285799450.02565626571598910.987171867142005
210.01553455264242840.03106910528485680.984465447357572
220.006637771092101430.01327554218420290.993362228907899
230.00309679252787020.00619358505574040.99690320747213
240.001146186428907300.002292372857814590.998853813571093
250.0007495524701859090.001499104940371820.999250447529814
260.0005257372624862140.001051474524972430.999474262737514
270.003358680426490250.006717360852980510.99664131957351
280.002300612618540980.004601225237081960.99769938738146
290.002044452844717660.004088905689435320.997955547155282
300.001004201496263540.002008402992527080.998995798503736
310.0005349564872164930.001069912974432990.999465043512784
320.001836115819661360.003672231639322720.998163884180339
330.0009889786917518810.001977957383503760.999011021308248
340.0008662256045874720.001732451209174940.999133774395413
350.0006734351728690510.001346870345738100.999326564827131
360.0003583955476596750.000716791095319350.99964160445234
370.0006445608176068520.001289121635213700.999355439182393
380.0005326621540669420.001065324308133880.999467337845933
390.0003817776795178560.0007635553590357120.999618222320482
400.0002709858014978550.000541971602995710.999729014198502
410.0001425985849684160.0002851971699368320.999857401415032
420.0001026864120902730.0002053728241805460.99989731358791
430.0001003324418097280.0002006648836194550.99989966755819
440.0001072771333951120.0002145542667902240.999892722866605
450.0001795799653510600.0003591599307021210.999820420034649
460.00167885202291570.00335770404583140.998321147977084
470.0009784221992823550.001956844398564710.999021577800718
480.0009248978591039070.001849795718207810.999075102140896
490.0005789643922033130.001157928784406630.999421035607797
500.0003804546512118640.0007609093024237280.999619545348788
510.0003494952933868150.000698990586773630.999650504706613
520.0001951848877204130.0003903697754408260.99980481511228
530.0001312902161416490.0002625804322832980.999868709783858
549.31377158575369e-050.0001862754317150740.999906862284142
550.0001399041265738180.0002798082531476370.999860095873426
567.35407161435815e-050.0001470814322871630.999926459283856
575.10374520836822e-050.0001020749041673640.999948962547916
580.0003698381290852360.0007396762581704730.999630161870915
590.0002765558577228120.0005531117154456240.999723444142277
600.0001517509565397130.0003035019130794260.99984824904346
610.0001240171819033890.0002480343638067790.999875982818097
620.0001174451597116960.0002348903194233920.999882554840288
638.96686079923559e-050.0001793372159847120.999910331392008
640.0001466100729414240.0002932201458828480.999853389927059
650.0001844676298098610.0003689352596197220.99981553237019
660.0002682015177035770.0005364030354071540.999731798482296
670.002200131842609430.004400263685218860.99779986815739
680.003227512428994480.006455024857988950.996772487571006
690.004956200384759070.009912400769518140.99504379961524
700.006649143316729650.01329828663345930.99335085668327
710.004689654056594230.009379308113188460.995310345943406
720.00220277086334880.00440554172669760.997797229136651
730.001870398600310860.003740797200621720.99812960139969
740.001311966678641510.002623933357283030.998688033321358
750.001309474681268670.002618949362537350.998690525318731


Meta Analysis of Goldfeld-Quandt test for Heteroskedasticity
Description# significant tests% significant testsOK/NOK
1% type I error level520.88135593220339NOK
5% type I error level570.966101694915254NOK
10% type I error level580.983050847457627NOK

\begin{tabular}{lllllllll}
\hline
Meta Analysis of Goldfeld-Quandt test for Heteroskedasticity \tabularnewline
Description & # significant tests & % significant tests & OK/NOK \tabularnewline
1% type I error level & 52 & 0.88135593220339 & NOK \tabularnewline
5% type I error level & 57 & 0.966101694915254 & NOK \tabularnewline
10% type I error level & 58 & 0.983050847457627 & NOK \tabularnewline
\hline
\end{tabular}
%Source: https://freestatistics.org/blog/index.php?pk=25716&T=6

[TABLE]
[ROW][C]Meta Analysis of Goldfeld-Quandt test for Heteroskedasticity[/C][/ROW]
[ROW][C]Description[/C][C]# significant tests[/C][C]% significant tests[/C][C]OK/NOK[/C][/ROW]
[ROW][C]1% type I error level[/C][C]52[/C][C]0.88135593220339[/C][C]NOK[/C][/ROW]
[ROW][C]5% type I error level[/C][C]57[/C][C]0.966101694915254[/C][C]NOK[/C][/ROW]
[ROW][C]10% type I error level[/C][C]58[/C][C]0.983050847457627[/C][C]NOK[/C][/ROW]
[/TABLE]
Source: https://freestatistics.org/blog/index.php?pk=25716&T=6

Globally Unique Identifier (entire table): ba.freestatistics.org/blog/index.php?pk=25716&T=6

As an alternative you can also use a QR Code:  

The GUIDs for individual cells are displayed in the table below:

Meta Analysis of Goldfeld-Quandt test for Heteroskedasticity
Description# significant tests% significant testsOK/NOK
1% type I error level520.88135593220339NOK
5% type I error level570.966101694915254NOK
10% type I error level580.983050847457627NOK


Parameters (Session):
par1 = 1 ; par2 = Include Monthly Dummies ; par3 = Linear Trend ;
Parameters (R input):
par1 = 1 ; par2 = Include Monthly Dummies ; par3 = Linear Trend ;
R code (references can be found in the software module):
library(lattice)
library(lmtest)
n25 <- 25 #minimum number of obs. for Goldfeld-Quandt test
par1 <- as.numeric(par1)
x <- t(y)
k <- length(x[1,])
n <- length(x[,1])
x1 <- cbind(x[,par1], x[,1:k!=par1])
mycolnames <- c(colnames(x)[par1], colnames(x)[1:k!=par1])
colnames(x1) <- mycolnames #colnames(x)[par1]
x <- x1
if (par3 == 'First Differences'){
x2 <- array(0, dim=c(n-1,k), dimnames=list(1:(n-1), paste('(1-B)',colnames(x),sep='')))
for (i in 1:n-1) {
for (j in 1:k) {
x2[i,j] <- x[i+1,j] - x[i,j]
}
}
x <- x2
}
if (par2 == 'Include Monthly Dummies'){
x2 <- array(0, dim=c(n,11), dimnames=list(1:n, paste('M', seq(1:11), sep ='')))
for (i in 1:11){
x2[seq(i,n,12),i] <- 1
}
x <- cbind(x, x2)
}
if (par2 == 'Include Quarterly Dummies'){
x2 <- array(0, dim=c(n,3), dimnames=list(1:n, paste('Q', seq(1:3), sep ='')))
for (i in 1:3){
x2[seq(i,n,4),i] <- 1
}
x <- cbind(x, x2)
}
k <- length(x[1,])
if (par3 == 'Linear Trend'){
x <- cbind(x, c(1:n))
colnames(x)[k+1] <- 't'
}
x
k <- length(x[1,])
df <- as.data.frame(x)
(mylm <- lm(df))
(mysum <- summary(mylm))
if (n > n25) {
kp3 <- k + 3
nmkm3 <- n - k - 3
gqarr <- array(NA, dim=c(nmkm3-kp3+1,3))
numgqtests <- 0
numsignificant1 <- 0
numsignificant5 <- 0
numsignificant10 <- 0
for (mypoint in kp3:nmkm3) {
j <- 0
numgqtests <- numgqtests + 1
for (myalt in c('greater', 'two.sided', 'less')) {
j <- j + 1
gqarr[mypoint-kp3+1,j] <- gqtest(mylm, point=mypoint, alternative=myalt)$p.value
}
if (gqarr[mypoint-kp3+1,2] < 0.01) numsignificant1 <- numsignificant1 + 1
if (gqarr[mypoint-kp3+1,2] < 0.05) numsignificant5 <- numsignificant5 + 1
if (gqarr[mypoint-kp3+1,2] < 0.10) numsignificant10 <- numsignificant10 + 1
}
gqarr
}
bitmap(file='test0.png')
plot(x[,1], type='l', main='Actuals and Interpolation', ylab='value of Actuals and Interpolation (dots)', xlab='time or index')
points(x[,1]-mysum$resid)
grid()
dev.off()
bitmap(file='test1.png')
plot(mysum$resid, type='b', pch=19, main='Residuals', ylab='value of Residuals', xlab='time or index')
grid()
dev.off()
bitmap(file='test2.png')
hist(mysum$resid, main='Residual Histogram', xlab='values of Residuals')
grid()
dev.off()
bitmap(file='test3.png')
densityplot(~mysum$resid,col='black',main='Residual Density Plot', xlab='values of Residuals')
dev.off()
bitmap(file='test4.png')
qqnorm(mysum$resid, main='Residual Normal Q-Q Plot')
qqline(mysum$resid)
grid()
dev.off()
(myerror <- as.ts(mysum$resid))
bitmap(file='test5.png')
dum <- cbind(lag(myerror,k=1),myerror)
dum
dum1 <- dum[2:length(myerror),]
dum1
z <- as.data.frame(dum1)
z
plot(z,main=paste('Residual Lag plot, lowess, and regression line'), ylab='values of Residuals', xlab='lagged values of Residuals')
lines(lowess(z))
abline(lm(z))
grid()
dev.off()
bitmap(file='test6.png')
acf(mysum$resid, lag.max=length(mysum$resid)/2, main='Residual Autocorrelation Function')
grid()
dev.off()
bitmap(file='test7.png')
pacf(mysum$resid, lag.max=length(mysum$resid)/2, main='Residual Partial Autocorrelation Function')
grid()
dev.off()
bitmap(file='test8.png')
opar <- par(mfrow = c(2,2), oma = c(0, 0, 1.1, 0))
plot(mylm, las = 1, sub='Residual Diagnostics')
par(opar)
dev.off()
if (n > n25) {
bitmap(file='test9.png')
plot(kp3:nmkm3,gqarr[,2], main='Goldfeld-Quandt test',ylab='2-sided p-value',xlab='breakpoint')
grid()
dev.off()
}
load(file='createtable')
a<-table.start()
a<-table.row.start(a)
a<-table.element(a, 'Multiple Linear Regression - Estimated Regression Equation', 1, TRUE)
a<-table.row.end(a)
myeq <- colnames(x)[1]
myeq <- paste(myeq, '[t] = ', sep='')
for (i in 1:k){
if (mysum$coefficients[i,1] > 0) myeq <- paste(myeq, '+', '')
myeq <- paste(myeq, mysum$coefficients[i,1], sep=' ')
if (rownames(mysum$coefficients)[i] != '(Intercept)') {
myeq <- paste(myeq, rownames(mysum$coefficients)[i], sep='')
if (rownames(mysum$coefficients)[i] != 't') myeq <- paste(myeq, '[t]', sep='')
}
}
myeq <- paste(myeq, ' + e[t]')
a<-table.row.start(a)
a<-table.element(a, myeq)
a<-table.row.end(a)
a<-table.end(a)
table.save(a,file='mytable1.tab')
a<-table.start()
a<-table.row.start(a)
a<-table.element(a,hyperlink('ols1.htm','Multiple Linear Regression - Ordinary Least Squares',''), 6, TRUE)
a<-table.row.end(a)
a<-table.row.start(a)
a<-table.element(a,'Variable',header=TRUE)
a<-table.element(a,'Parameter',header=TRUE)
a<-table.element(a,'S.D.',header=TRUE)
a<-table.element(a,'T-STAT
H0: parameter = 0',header=TRUE)
a<-table.element(a,'2-tail p-value',header=TRUE)
a<-table.element(a,'1-tail p-value',header=TRUE)
a<-table.row.end(a)
for (i in 1:k){
a<-table.row.start(a)
a<-table.element(a,rownames(mysum$coefficients)[i],header=TRUE)
a<-table.element(a,mysum$coefficients[i,1])
a<-table.element(a, round(mysum$coefficients[i,2],6))
a<-table.element(a, round(mysum$coefficients[i,3],4))
a<-table.element(a, round(mysum$coefficients[i,4],6))
a<-table.element(a, round(mysum$coefficients[i,4]/2,6))
a<-table.row.end(a)
}
a<-table.end(a)
table.save(a,file='mytable2.tab')
a<-table.start()
a<-table.row.start(a)
a<-table.element(a, 'Multiple Linear Regression - Regression Statistics', 2, TRUE)
a<-table.row.end(a)
a<-table.row.start(a)
a<-table.element(a, 'Multiple R',1,TRUE)
a<-table.element(a, sqrt(mysum$r.squared))
a<-table.row.end(a)
a<-table.row.start(a)
a<-table.element(a, 'R-squared',1,TRUE)
a<-table.element(a, mysum$r.squared)
a<-table.row.end(a)
a<-table.row.start(a)
a<-table.element(a, 'Adjusted R-squared',1,TRUE)
a<-table.element(a, mysum$adj.r.squared)
a<-table.row.end(a)
a<-table.row.start(a)
a<-table.element(a, 'F-TEST (value)',1,TRUE)
a<-table.element(a, mysum$fstatistic[1])
a<-table.row.end(a)
a<-table.row.start(a)
a<-table.element(a, 'F-TEST (DF numerator)',1,TRUE)
a<-table.element(a, mysum$fstatistic[2])
a<-table.row.end(a)
a<-table.row.start(a)
a<-table.element(a, 'F-TEST (DF denominator)',1,TRUE)
a<-table.element(a, mysum$fstatistic[3])
a<-table.row.end(a)
a<-table.row.start(a)
a<-table.element(a, 'p-value',1,TRUE)
a<-table.element(a, 1-pf(mysum$fstatistic[1],mysum$fstatistic[2],mysum$fstatistic[3]))
a<-table.row.end(a)
a<-table.row.start(a)
a<-table.element(a, 'Multiple Linear Regression - Residual Statistics', 2, TRUE)
a<-table.row.end(a)
a<-table.row.start(a)
a<-table.element(a, 'Residual Standard Deviation',1,TRUE)
a<-table.element(a, mysum$sigma)
a<-table.row.end(a)
a<-table.row.start(a)
a<-table.element(a, 'Sum Squared Residuals',1,TRUE)
a<-table.element(a, sum(myerror*myerror))
a<-table.row.end(a)
a<-table.end(a)
table.save(a,file='mytable3.tab')
a<-table.start()
a<-table.row.start(a)
a<-table.element(a, 'Multiple Linear Regression - Actuals, Interpolation, and Residuals', 4, TRUE)
a<-table.row.end(a)
a<-table.row.start(a)
a<-table.element(a, 'Time or Index', 1, TRUE)
a<-table.element(a, 'Actuals', 1, TRUE)
a<-table.element(a, 'Interpolation
Forecast', 1, TRUE)
a<-table.element(a, 'Residuals
Prediction Error', 1, TRUE)
a<-table.row.end(a)
for (i in 1:n) {
a<-table.row.start(a)
a<-table.element(a,i, 1, TRUE)
a<-table.element(a,x[i])
a<-table.element(a,x[i]-mysum$resid[i])
a<-table.element(a,mysum$resid[i])
a<-table.row.end(a)
}
a<-table.end(a)
table.save(a,file='mytable4.tab')
if (n > n25) {
a<-table.start()
a<-table.row.start(a)
a<-table.element(a,'Goldfeld-Quandt test for Heteroskedasticity',4,TRUE)
a<-table.row.end(a)
a<-table.row.start(a)
a<-table.element(a,'p-values',header=TRUE)
a<-table.element(a,'Alternative Hypothesis',3,header=TRUE)
a<-table.row.end(a)
a<-table.row.start(a)
a<-table.element(a,'breakpoint index',header=TRUE)
a<-table.element(a,'greater',header=TRUE)
a<-table.element(a,'2-sided',header=TRUE)
a<-table.element(a,'less',header=TRUE)
a<-table.row.end(a)
for (mypoint in kp3:nmkm3) {
a<-table.row.start(a)
a<-table.element(a,mypoint,header=TRUE)
a<-table.element(a,gqarr[mypoint-kp3+1,1])
a<-table.element(a,gqarr[mypoint-kp3+1,2])
a<-table.element(a,gqarr[mypoint-kp3+1,3])
a<-table.row.end(a)
}
a<-table.end(a)
table.save(a,file='mytable5.tab')
a<-table.start()
a<-table.row.start(a)
a<-table.element(a,'Meta Analysis of Goldfeld-Quandt test for Heteroskedasticity',4,TRUE)
a<-table.row.end(a)
a<-table.row.start(a)
a<-table.element(a,'Description',header=TRUE)
a<-table.element(a,'# significant tests',header=TRUE)
a<-table.element(a,'% significant tests',header=TRUE)
a<-table.element(a,'OK/NOK',header=TRUE)
a<-table.row.end(a)
a<-table.row.start(a)
a<-table.element(a,'1% type I error level',header=TRUE)
a<-table.element(a,numsignificant1)
a<-table.element(a,numsignificant1/numgqtests)
if (numsignificant1/numgqtests < 0.01) dum <- 'OK' else dum <- 'NOK'
a<-table.element(a,dum)
a<-table.row.end(a)
a<-table.row.start(a)
a<-table.element(a,'5% type I error level',header=TRUE)
a<-table.element(a,numsignificant5)
a<-table.element(a,numsignificant5/numgqtests)
if (numsignificant5/numgqtests < 0.05) dum <- 'OK' else dum <- 'NOK'
a<-table.element(a,dum)
a<-table.row.end(a)
a<-table.row.start(a)
a<-table.element(a,'10% type I error level',header=TRUE)
a<-table.element(a,numsignificant10)
a<-table.element(a,numsignificant10/numgqtests)
if (numsignificant10/numgqtests < 0.1) dum <- 'OK' else dum <- 'NOK'
a<-table.element(a,dum)
a<-table.row.end(a)
a<-table.end(a)
table.save(a,file='mytable6.tab')
}