Free Statistics
of Irreproducible Research!
Description of Statistical Computation | |||||||||||||||||||||
|---|---|---|---|---|---|---|---|---|---|---|---|---|---|---|---|---|---|---|---|---|---|
| Author's title | |||||||||||||||||||||
| Author | *The author of this computation has been verified* | ||||||||||||||||||||
| R Software Module | rwasp_backtobackhist.wasp | ||||||||||||||||||||
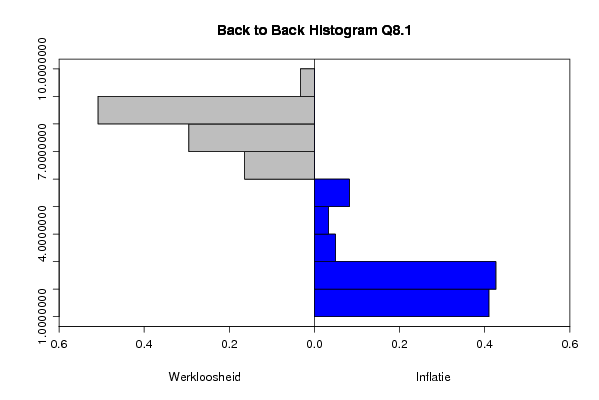
| Title produced by software | Back to Back Histogram | ||||||||||||||||||||
| Date of computation | Mon, 20 Oct 2008 13:50:37 -0600 | ||||||||||||||||||||
| Cite this page as follows | Statistical Computations at FreeStatistics.org, Office for Research Development and Education, URL https://freestatistics.org/blog/index.php?v=date/2008/Oct/20/t1224532295y2ay44j28w38y0u.htm/, Retrieved Thu, 04 Jun 2026 06:33:21 +0000 | ||||||||||||||||||||
| Statistical Computations at FreeStatistics.org, Office for Research Development and Education, URL https://freestatistics.org/blog/index.php?pk=18009, Retrieved Thu, 04 Jun 2026 06:33:21 +0000 | |||||||||||||||||||||
| QR Codes: | |||||||||||||||||||||
|
| |||||||||||||||||||||
| Original text written by user: | |||||||||||||||||||||
| IsPrivate? | No (this computation is public) | ||||||||||||||||||||
| User-defined keywords | |||||||||||||||||||||
| Estimated Impact | 490 | ||||||||||||||||||||
Tree of Dependent Computations | |||||||||||||||||||||
| Family? (F = Feedback message, R = changed R code, M = changed R Module, P = changed Parameters, D = changed Data) | |||||||||||||||||||||
| F [Pearson Correlation] [Q5 Relationship b...] [2007-10-20 14:40:02] [b731da8b544846036771bbf9bf2f34ce] - RMPD [Back to Back Histogram] [BtB-Histo Q8.1] [2008-10-20 19:50:37] [0da3c04827d8ef68db874351a2e09488] [Current] | |||||||||||||||||||||
| Feedback Forum | |||||||||||||||||||||
Post a new message | |||||||||||||||||||||
Dataset | |||||||||||||||||||||
| Dataseries X: | |||||||||||||||||||||
8,4 8,4 8,4 8,6 8,9 8,8 8,3 7,5 7,2 7,5 8,8 9,3 9,3 8,7 8,2 8,3 8,5 8,6 8,6 8,2 8,1 8 8,6 8,7 8,8 8,5 8,4 8,5 8,7 8,7 8,6 8,5 8,3 8,1 8,2 8,1 8,1 7,9 7,9 7,9 8 8 7,9 8 7,7 7,2 7,5 7,3 7 7 7 7,2 7,3 7,1 6,8 6,6 6,2 6,2 6,8 6,9 6,8 | |||||||||||||||||||||
| Dataseries Y: | |||||||||||||||||||||
1,7 1,4 1,8 1,7 1,4 1,2 1 1,7 2,4 2 2,1 2 1,8 2,7 2,3 1,9 2 2,3 2,8 2,4 2,3 2,7 2,7 2,9 3 2,2 2,3 2,8 2,8 2,8 2,2 2,6 2,8 2,5 2,4 2,3 1,9 1,7 2 2,1 1,7 1,8 1,8 1,8 1,3 1,3 1,3 1,2 1,4 2,2 2,9 3,1 3,5 3,6 4,4 4,1 5,1 5,8 5,9 5,4 5,5 | |||||||||||||||||||||
Tables (Output of Computation) | |||||||||||||||||||||
| |||||||||||||||||||||
Figures (Output of Computation) | |||||||||||||||||||||
Input Parameters & R Code | |||||||||||||||||||||
| Parameters (Session): | |||||||||||||||||||||
| par1 = 0.01 ; par2 = 0.005 ; par3 = 0.01 ; | |||||||||||||||||||||
| Parameters (R input): | |||||||||||||||||||||
| par1 = grey ; par2 = blue ; par3 = TRUE ; par4 = Werkloosheid ; par5 = Inflatie ; | |||||||||||||||||||||
| R code (references can be found in the software module): | |||||||||||||||||||||
if (par3 == 'TRUE') par3 <- TRUE | |||||||||||||||||||||