Free Statistics

of Irreproducible Research!

Author's title

Author*The author of this computation has been verified*
R Software Modulerwasp_exponentialsmoothing.wasp
Title produced by softwareExponential Smoothing
Date of computationFri, 04 Dec 2009 05:40:04 -0700
Cite this page as followsStatistical Computations at FreeStatistics.org, Office for Research Development and Education, URL https://freestatistics.org/blog/index.php?v=date/2009/Dec/04/t1259930479zwsv42b9mo4x423.htm/, Retrieved Mon, 13 May 2024 14:37:48 +0000
Statistical Computations at FreeStatistics.org, Office for Research Development and Education, URL https://freestatistics.org/blog/index.php?pk=63427, Retrieved Mon, 13 May 2024 14:37:48 +0000
QR Codes:

Original text written by user:
IsPrivate?No (this computation is public)
User-defined keywords
Estimated Impact107
Family? (F = Feedback message, R = changed R code, M = changed R Module, P = changed Parameters, D = changed Data)
-     [Univariate Data Series] [data set] [2008-12-01 19:54:57] [b98453cac15ba1066b407e146608df68]
- RMP   [Exponential Smoothing] [] [2009-11-27 15:04:36] [b98453cac15ba1066b407e146608df68]
-    D      [Exponential Smoothing] [] [2009-12-04 12:40:04] [026d431dc78a3ce53a040b5408fc0322] [Current]
-   PD        [Exponential Smoothing] [ws 9 Exponentiona...] [2009-12-04 15:41:39] [af8eb90b4bf1bcfcc4325c143dbee260]
Feedback Forum

Post a new message
Dataseries X:
111,5
108,1
124,5
106,3
111,1
121,3
116,5
117,4
123,6
98,4
107,2
118,9
111,9
115,2
124,4
104,6
117
126,2
117,5
122,2
124,1
105,8
107,5
125,6
112,1
120,1
130,6
109,8
122,1
129,5
132,1
133,3
128,4
114,7
114,1
136,9
123,4
134
137
127,8
140,1
140,4
157,8
151,8
141,1
138,8
141,1
139,5
150,7
144,4
146
143,6
143,1
156,4
164,8
145,1
153,4
133,2
131,4
145,9


Summary of computational transaction
Raw Inputview raw input (R code)
Raw Outputview raw output of R engine
Computing time3 seconds
R Server'Gwilym Jenkins' @ 72.249.127.135

\begin{tabular}{lllllllll}
\hline
Summary of computational transaction \tabularnewline
Raw Input & view raw input (R code)  \tabularnewline
Raw Output & view raw output of R engine  \tabularnewline
Computing time & 3 seconds \tabularnewline
R Server & 'Gwilym Jenkins' @ 72.249.127.135 \tabularnewline
\hline
\end{tabular}
%Source: https://freestatistics.org/blog/index.php?pk=63427&T=0

[TABLE]
[ROW][C]Summary of computational transaction[/C][/ROW]
[ROW][C]Raw Input[/C][C]view raw input (R code) [/C][/ROW]
[ROW][C]Raw Output[/C][C]view raw output of R engine [/C][/ROW]
[ROW][C]Computing time[/C][C]3 seconds[/C][/ROW]
[ROW][C]R Server[/C][C]'Gwilym Jenkins' @ 72.249.127.135[/C][/ROW]
[/TABLE]
Source: https://freestatistics.org/blog/index.php?pk=63427&T=0

Globally Unique Identifier (entire table): ba.freestatistics.org/blog/index.php?pk=63427&T=0

As an alternative you can also use a QR Code:  

The GUIDs for individual cells are displayed in the table below:

Summary of computational transaction
Raw Inputview raw input (R code)
Raw Outputview raw output of R engine
Computing time3 seconds
R Server'Gwilym Jenkins' @ 72.249.127.135


Estimated Parameters of Exponential Smoothing
ParameterValue
alpha0.242037573055879
beta0.0101587425110497
gamma0.717611294485236

\begin{tabular}{lllllllll}
\hline
Estimated Parameters of Exponential Smoothing \tabularnewline
Parameter & Value \tabularnewline
alpha & 0.242037573055879 \tabularnewline
beta & 0.0101587425110497 \tabularnewline
gamma & 0.717611294485236 \tabularnewline
\hline
\end{tabular}
%Source: https://freestatistics.org/blog/index.php?pk=63427&T=1

[TABLE]
[ROW][C]Estimated Parameters of Exponential Smoothing[/C][/ROW]
[ROW][C]Parameter[/C][C]Value[/C][/ROW]
[ROW][C]alpha[/C][C]0.242037573055879[/C][/ROW]
[ROW][C]beta[/C][C]0.0101587425110497[/C][/ROW]
[ROW][C]gamma[/C][C]0.717611294485236[/C][/ROW]
[/TABLE]
Source: https://freestatistics.org/blog/index.php?pk=63427&T=1

Globally Unique Identifier (entire table): ba.freestatistics.org/blog/index.php?pk=63427&T=1

As an alternative you can also use a QR Code:  

The GUIDs for individual cells are displayed in the table below:

Estimated Parameters of Exponential Smoothing
ParameterValue
alpha0.242037573055879
beta0.0101587425110497
gamma0.717611294485236


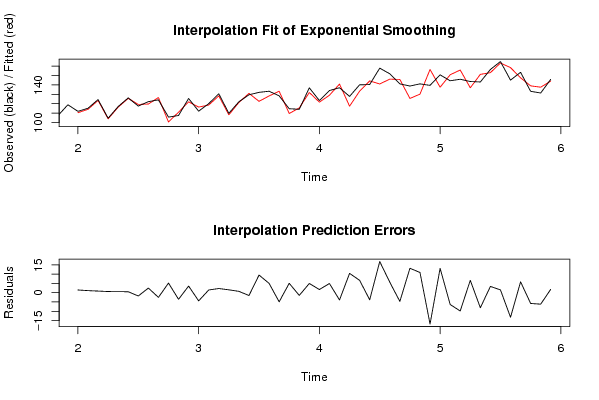
Interpolation Forecasts of Exponential Smoothing
tObservedFittedResiduals
13111.9110.4383289401931.46167105980669
14115.2114.0736920872861.12630791271364
15124.4123.5180769240080.881923075992404
16104.6103.9756313341100.624368665890216
17117116.4109366574660.589063342533578
18126.2125.6869284252760.513071574723739
19117.5119.273110540321-1.77311054032124
20122.2119.6998967837512.50010321624943
21124.1126.621122340376-2.52112234037564
22105.8100.6079013175855.19209868241461
23107.5111.060870035117-3.56087003511709
24125.6122.0209394285393.57906057146074
25112.1116.500522579400-4.40052257939954
26120.1118.6392296062411.46077039375942
27130.6128.3477528184042.25224718159564
28109.8108.2484513164251.55154868357509
29122.1121.3808091255680.719190874432385
30129.5131.015464401879-1.51546440187894
31132.1122.5828911104969.51710888950375
32133.3128.2714046220365.02859537796377
33128.4133.325090785582-4.92509078558169
34114.7109.6331113149295.0668886850713
35114.1115.559455822279-1.45945582227927
36136.9131.9312967402664.96870325973364
37123.4121.69648926011.70351073990007
38134129.0512565359174.94874346408287
39137140.933981246858-3.93398124685757
40127.8117.39112936267810.4088706373225
41140.1133.4414536262646.65854637373647
42140.4144.250866206381-3.85086620638086
43157.8140.99736559096416.8026344090358
44151.8146.1627007205025.63729927949754
45141.1145.813404297501-4.71340429750072
46138.8125.63168079548913.1683192045113
47141.1130.19869224918610.9013077508142
48139.5156.406201564472-16.9062015644722
49150.7137.56369708152413.1363029184757
50144.4150.771557707329-6.37155770732926
51146155.860073575039-9.86007357503885
52143.6136.9334465216256.6665534783752
53143.1151.230741679164-8.13074167916437
54156.4153.0208120309093.37918796909065
55164.8163.3091398760171.49086012398320
56145.1158.368963278440-13.2689632784403
57153.4147.5469119757485.85308802425214
58133.2139.009553343902-5.80955334390234
59131.4137.593586961383-6.19358696138255
60145.9144.0608840925911.83911590740883

\begin{tabular}{lllllllll}
\hline
Interpolation Forecasts of Exponential Smoothing \tabularnewline
t & Observed & Fitted & Residuals \tabularnewline
13 & 111.9 & 110.438328940193 & 1.46167105980669 \tabularnewline
14 & 115.2 & 114.073692087286 & 1.12630791271364 \tabularnewline
15 & 124.4 & 123.518076924008 & 0.881923075992404 \tabularnewline
16 & 104.6 & 103.975631334110 & 0.624368665890216 \tabularnewline
17 & 117 & 116.410936657466 & 0.589063342533578 \tabularnewline
18 & 126.2 & 125.686928425276 & 0.513071574723739 \tabularnewline
19 & 117.5 & 119.273110540321 & -1.77311054032124 \tabularnewline
20 & 122.2 & 119.699896783751 & 2.50010321624943 \tabularnewline
21 & 124.1 & 126.621122340376 & -2.52112234037564 \tabularnewline
22 & 105.8 & 100.607901317585 & 5.19209868241461 \tabularnewline
23 & 107.5 & 111.060870035117 & -3.56087003511709 \tabularnewline
24 & 125.6 & 122.020939428539 & 3.57906057146074 \tabularnewline
25 & 112.1 & 116.500522579400 & -4.40052257939954 \tabularnewline
26 & 120.1 & 118.639229606241 & 1.46077039375942 \tabularnewline
27 & 130.6 & 128.347752818404 & 2.25224718159564 \tabularnewline
28 & 109.8 & 108.248451316425 & 1.55154868357509 \tabularnewline
29 & 122.1 & 121.380809125568 & 0.719190874432385 \tabularnewline
30 & 129.5 & 131.015464401879 & -1.51546440187894 \tabularnewline
31 & 132.1 & 122.582891110496 & 9.51710888950375 \tabularnewline
32 & 133.3 & 128.271404622036 & 5.02859537796377 \tabularnewline
33 & 128.4 & 133.325090785582 & -4.92509078558169 \tabularnewline
34 & 114.7 & 109.633111314929 & 5.0668886850713 \tabularnewline
35 & 114.1 & 115.559455822279 & -1.45945582227927 \tabularnewline
36 & 136.9 & 131.931296740266 & 4.96870325973364 \tabularnewline
37 & 123.4 & 121.6964892601 & 1.70351073990007 \tabularnewline
38 & 134 & 129.051256535917 & 4.94874346408287 \tabularnewline
39 & 137 & 140.933981246858 & -3.93398124685757 \tabularnewline
40 & 127.8 & 117.391129362678 & 10.4088706373225 \tabularnewline
41 & 140.1 & 133.441453626264 & 6.65854637373647 \tabularnewline
42 & 140.4 & 144.250866206381 & -3.85086620638086 \tabularnewline
43 & 157.8 & 140.997365590964 & 16.8026344090358 \tabularnewline
44 & 151.8 & 146.162700720502 & 5.63729927949754 \tabularnewline
45 & 141.1 & 145.813404297501 & -4.71340429750072 \tabularnewline
46 & 138.8 & 125.631680795489 & 13.1683192045113 \tabularnewline
47 & 141.1 & 130.198692249186 & 10.9013077508142 \tabularnewline
48 & 139.5 & 156.406201564472 & -16.9062015644722 \tabularnewline
49 & 150.7 & 137.563697081524 & 13.1363029184757 \tabularnewline
50 & 144.4 & 150.771557707329 & -6.37155770732926 \tabularnewline
51 & 146 & 155.860073575039 & -9.86007357503885 \tabularnewline
52 & 143.6 & 136.933446521625 & 6.6665534783752 \tabularnewline
53 & 143.1 & 151.230741679164 & -8.13074167916437 \tabularnewline
54 & 156.4 & 153.020812030909 & 3.37918796909065 \tabularnewline
55 & 164.8 & 163.309139876017 & 1.49086012398320 \tabularnewline
56 & 145.1 & 158.368963278440 & -13.2689632784403 \tabularnewline
57 & 153.4 & 147.546911975748 & 5.85308802425214 \tabularnewline
58 & 133.2 & 139.009553343902 & -5.80955334390234 \tabularnewline
59 & 131.4 & 137.593586961383 & -6.19358696138255 \tabularnewline
60 & 145.9 & 144.060884092591 & 1.83911590740883 \tabularnewline
\hline
\end{tabular}
%Source: https://freestatistics.org/blog/index.php?pk=63427&T=2

[TABLE]
[ROW][C]Interpolation Forecasts of Exponential Smoothing[/C][/ROW]
[ROW][C]t[/C][C]Observed[/C][C]Fitted[/C][C]Residuals[/C][/ROW]
[ROW][C]13[/C][C]111.9[/C][C]110.438328940193[/C][C]1.46167105980669[/C][/ROW]
[ROW][C]14[/C][C]115.2[/C][C]114.073692087286[/C][C]1.12630791271364[/C][/ROW]
[ROW][C]15[/C][C]124.4[/C][C]123.518076924008[/C][C]0.881923075992404[/C][/ROW]
[ROW][C]16[/C][C]104.6[/C][C]103.975631334110[/C][C]0.624368665890216[/C][/ROW]
[ROW][C]17[/C][C]117[/C][C]116.410936657466[/C][C]0.589063342533578[/C][/ROW]
[ROW][C]18[/C][C]126.2[/C][C]125.686928425276[/C][C]0.513071574723739[/C][/ROW]
[ROW][C]19[/C][C]117.5[/C][C]119.273110540321[/C][C]-1.77311054032124[/C][/ROW]
[ROW][C]20[/C][C]122.2[/C][C]119.699896783751[/C][C]2.50010321624943[/C][/ROW]
[ROW][C]21[/C][C]124.1[/C][C]126.621122340376[/C][C]-2.52112234037564[/C][/ROW]
[ROW][C]22[/C][C]105.8[/C][C]100.607901317585[/C][C]5.19209868241461[/C][/ROW]
[ROW][C]23[/C][C]107.5[/C][C]111.060870035117[/C][C]-3.56087003511709[/C][/ROW]
[ROW][C]24[/C][C]125.6[/C][C]122.020939428539[/C][C]3.57906057146074[/C][/ROW]
[ROW][C]25[/C][C]112.1[/C][C]116.500522579400[/C][C]-4.40052257939954[/C][/ROW]
[ROW][C]26[/C][C]120.1[/C][C]118.639229606241[/C][C]1.46077039375942[/C][/ROW]
[ROW][C]27[/C][C]130.6[/C][C]128.347752818404[/C][C]2.25224718159564[/C][/ROW]
[ROW][C]28[/C][C]109.8[/C][C]108.248451316425[/C][C]1.55154868357509[/C][/ROW]
[ROW][C]29[/C][C]122.1[/C][C]121.380809125568[/C][C]0.719190874432385[/C][/ROW]
[ROW][C]30[/C][C]129.5[/C][C]131.015464401879[/C][C]-1.51546440187894[/C][/ROW]
[ROW][C]31[/C][C]132.1[/C][C]122.582891110496[/C][C]9.51710888950375[/C][/ROW]
[ROW][C]32[/C][C]133.3[/C][C]128.271404622036[/C][C]5.02859537796377[/C][/ROW]
[ROW][C]33[/C][C]128.4[/C][C]133.325090785582[/C][C]-4.92509078558169[/C][/ROW]
[ROW][C]34[/C][C]114.7[/C][C]109.633111314929[/C][C]5.0668886850713[/C][/ROW]
[ROW][C]35[/C][C]114.1[/C][C]115.559455822279[/C][C]-1.45945582227927[/C][/ROW]
[ROW][C]36[/C][C]136.9[/C][C]131.931296740266[/C][C]4.96870325973364[/C][/ROW]
[ROW][C]37[/C][C]123.4[/C][C]121.6964892601[/C][C]1.70351073990007[/C][/ROW]
[ROW][C]38[/C][C]134[/C][C]129.051256535917[/C][C]4.94874346408287[/C][/ROW]
[ROW][C]39[/C][C]137[/C][C]140.933981246858[/C][C]-3.93398124685757[/C][/ROW]
[ROW][C]40[/C][C]127.8[/C][C]117.391129362678[/C][C]10.4088706373225[/C][/ROW]
[ROW][C]41[/C][C]140.1[/C][C]133.441453626264[/C][C]6.65854637373647[/C][/ROW]
[ROW][C]42[/C][C]140.4[/C][C]144.250866206381[/C][C]-3.85086620638086[/C][/ROW]
[ROW][C]43[/C][C]157.8[/C][C]140.997365590964[/C][C]16.8026344090358[/C][/ROW]
[ROW][C]44[/C][C]151.8[/C][C]146.162700720502[/C][C]5.63729927949754[/C][/ROW]
[ROW][C]45[/C][C]141.1[/C][C]145.813404297501[/C][C]-4.71340429750072[/C][/ROW]
[ROW][C]46[/C][C]138.8[/C][C]125.631680795489[/C][C]13.1683192045113[/C][/ROW]
[ROW][C]47[/C][C]141.1[/C][C]130.198692249186[/C][C]10.9013077508142[/C][/ROW]
[ROW][C]48[/C][C]139.5[/C][C]156.406201564472[/C][C]-16.9062015644722[/C][/ROW]
[ROW][C]49[/C][C]150.7[/C][C]137.563697081524[/C][C]13.1363029184757[/C][/ROW]
[ROW][C]50[/C][C]144.4[/C][C]150.771557707329[/C][C]-6.37155770732926[/C][/ROW]
[ROW][C]51[/C][C]146[/C][C]155.860073575039[/C][C]-9.86007357503885[/C][/ROW]
[ROW][C]52[/C][C]143.6[/C][C]136.933446521625[/C][C]6.6665534783752[/C][/ROW]
[ROW][C]53[/C][C]143.1[/C][C]151.230741679164[/C][C]-8.13074167916437[/C][/ROW]
[ROW][C]54[/C][C]156.4[/C][C]153.020812030909[/C][C]3.37918796909065[/C][/ROW]
[ROW][C]55[/C][C]164.8[/C][C]163.309139876017[/C][C]1.49086012398320[/C][/ROW]
[ROW][C]56[/C][C]145.1[/C][C]158.368963278440[/C][C]-13.2689632784403[/C][/ROW]
[ROW][C]57[/C][C]153.4[/C][C]147.546911975748[/C][C]5.85308802425214[/C][/ROW]
[ROW][C]58[/C][C]133.2[/C][C]139.009553343902[/C][C]-5.80955334390234[/C][/ROW]
[ROW][C]59[/C][C]131.4[/C][C]137.593586961383[/C][C]-6.19358696138255[/C][/ROW]
[ROW][C]60[/C][C]145.9[/C][C]144.060884092591[/C][C]1.83911590740883[/C][/ROW]
[/TABLE]
Source: https://freestatistics.org/blog/index.php?pk=63427&T=2

Globally Unique Identifier (entire table): ba.freestatistics.org/blog/index.php?pk=63427&T=2

As an alternative you can also use a QR Code:  

The GUIDs for individual cells are displayed in the table below:

Interpolation Forecasts of Exponential Smoothing
tObservedFittedResiduals
13111.9110.4383289401931.46167105980669
14115.2114.0736920872861.12630791271364
15124.4123.5180769240080.881923075992404
16104.6103.9756313341100.624368665890216
17117116.4109366574660.589063342533578
18126.2125.6869284252760.513071574723739
19117.5119.273110540321-1.77311054032124
20122.2119.6998967837512.50010321624943
21124.1126.621122340376-2.52112234037564
22105.8100.6079013175855.19209868241461
23107.5111.060870035117-3.56087003511709
24125.6122.0209394285393.57906057146074
25112.1116.500522579400-4.40052257939954
26120.1118.6392296062411.46077039375942
27130.6128.3477528184042.25224718159564
28109.8108.2484513164251.55154868357509
29122.1121.3808091255680.719190874432385
30129.5131.015464401879-1.51546440187894
31132.1122.5828911104969.51710888950375
32133.3128.2714046220365.02859537796377
33128.4133.325090785582-4.92509078558169
34114.7109.6331113149295.0668886850713
35114.1115.559455822279-1.45945582227927
36136.9131.9312967402664.96870325973364
37123.4121.69648926011.70351073990007
38134129.0512565359174.94874346408287
39137140.933981246858-3.93398124685757
40127.8117.39112936267810.4088706373225
41140.1133.4414536262646.65854637373647
42140.4144.250866206381-3.85086620638086
43157.8140.99736559096416.8026344090358
44151.8146.1627007205025.63729927949754
45141.1145.813404297501-4.71340429750072
46138.8125.63168079548913.1683192045113
47141.1130.19869224918610.9013077508142
48139.5156.406201564472-16.9062015644722
49150.7137.56369708152413.1363029184757
50144.4150.771557707329-6.37155770732926
51146155.860073575039-9.86007357503885
52143.6136.9334465216256.6665534783752
53143.1151.230741679164-8.13074167916437
54156.4153.0208120309093.37918796909065
55164.8163.3091398760171.49086012398320
56145.1158.368963278440-13.2689632784403
57153.4147.5469119757485.85308802425214
58133.2139.009553343902-5.80955334390234
59131.4137.593586961383-6.19358696138255
60145.9144.0608840925911.83911590740883


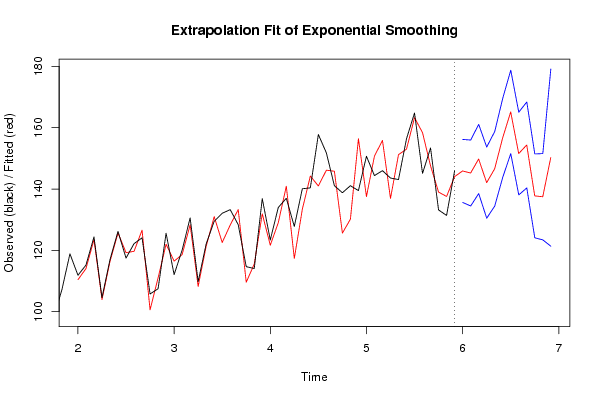
Extrapolation Forecasts of Exponential Smoothing
tForecast95% Lower Bound95% Upper Bound
61145.906121532797135.633822365746156.178420699848
62145.230696020751134.479774555819155.981617485683
63149.807106366999138.529242890176161.084969843821
64142.089414786972130.494727458478153.684102115467
65146.612770546764134.465015576610158.760525516919
66156.704697380373143.826304605133169.583090155613
67165.154461975807151.561106373660178.747817577954
68151.574886863623138.091958023462165.057815703785
69154.379437870814140.368882101399168.389993640228
70137.779560322295124.107217052926151.451903591664
71137.497419182399123.431445489261151.563392875537
72150.263722440696121.371130616217179.156314265175

\begin{tabular}{lllllllll}
\hline
Extrapolation Forecasts of Exponential Smoothing \tabularnewline
t & Forecast & 95% Lower Bound & 95% Upper Bound \tabularnewline
61 & 145.906121532797 & 135.633822365746 & 156.178420699848 \tabularnewline
62 & 145.230696020751 & 134.479774555819 & 155.981617485683 \tabularnewline
63 & 149.807106366999 & 138.529242890176 & 161.084969843821 \tabularnewline
64 & 142.089414786972 & 130.494727458478 & 153.684102115467 \tabularnewline
65 & 146.612770546764 & 134.465015576610 & 158.760525516919 \tabularnewline
66 & 156.704697380373 & 143.826304605133 & 169.583090155613 \tabularnewline
67 & 165.154461975807 & 151.561106373660 & 178.747817577954 \tabularnewline
68 & 151.574886863623 & 138.091958023462 & 165.057815703785 \tabularnewline
69 & 154.379437870814 & 140.368882101399 & 168.389993640228 \tabularnewline
70 & 137.779560322295 & 124.107217052926 & 151.451903591664 \tabularnewline
71 & 137.497419182399 & 123.431445489261 & 151.563392875537 \tabularnewline
72 & 150.263722440696 & 121.371130616217 & 179.156314265175 \tabularnewline
\hline
\end{tabular}
%Source: https://freestatistics.org/blog/index.php?pk=63427&T=3

[TABLE]
[ROW][C]Extrapolation Forecasts of Exponential Smoothing[/C][/ROW]
[ROW][C]t[/C][C]Forecast[/C][C]95% Lower Bound[/C][C]95% Upper Bound[/C][/ROW]
[ROW][C]61[/C][C]145.906121532797[/C][C]135.633822365746[/C][C]156.178420699848[/C][/ROW]
[ROW][C]62[/C][C]145.230696020751[/C][C]134.479774555819[/C][C]155.981617485683[/C][/ROW]
[ROW][C]63[/C][C]149.807106366999[/C][C]138.529242890176[/C][C]161.084969843821[/C][/ROW]
[ROW][C]64[/C][C]142.089414786972[/C][C]130.494727458478[/C][C]153.684102115467[/C][/ROW]
[ROW][C]65[/C][C]146.612770546764[/C][C]134.465015576610[/C][C]158.760525516919[/C][/ROW]
[ROW][C]66[/C][C]156.704697380373[/C][C]143.826304605133[/C][C]169.583090155613[/C][/ROW]
[ROW][C]67[/C][C]165.154461975807[/C][C]151.561106373660[/C][C]178.747817577954[/C][/ROW]
[ROW][C]68[/C][C]151.574886863623[/C][C]138.091958023462[/C][C]165.057815703785[/C][/ROW]
[ROW][C]69[/C][C]154.379437870814[/C][C]140.368882101399[/C][C]168.389993640228[/C][/ROW]
[ROW][C]70[/C][C]137.779560322295[/C][C]124.107217052926[/C][C]151.451903591664[/C][/ROW]
[ROW][C]71[/C][C]137.497419182399[/C][C]123.431445489261[/C][C]151.563392875537[/C][/ROW]
[ROW][C]72[/C][C]150.263722440696[/C][C]121.371130616217[/C][C]179.156314265175[/C][/ROW]
[/TABLE]
Source: https://freestatistics.org/blog/index.php?pk=63427&T=3

Globally Unique Identifier (entire table): ba.freestatistics.org/blog/index.php?pk=63427&T=3

As an alternative you can also use a QR Code:  

The GUIDs for individual cells are displayed in the table below:

Extrapolation Forecasts of Exponential Smoothing
tForecast95% Lower Bound95% Upper Bound
61145.906121532797135.633822365746156.178420699848
62145.230696020751134.479774555819155.981617485683
63149.807106366999138.529242890176161.084969843821
64142.089414786972130.494727458478153.684102115467
65146.612770546764134.465015576610158.760525516919
66156.704697380373143.826304605133169.583090155613
67165.154461975807151.561106373660178.747817577954
68151.574886863623138.091958023462165.057815703785
69154.379437870814140.368882101399168.389993640228
70137.779560322295124.107217052926151.451903591664
71137.497419182399123.431445489261151.563392875537
72150.263722440696121.371130616217179.156314265175


Parameters (Session):
par1 = 12 ; par2 = Triple ; par3 = multiplicative ;
Parameters (R input):
par1 = 12 ; par2 = Triple ; par3 = multiplicative ;
R code (references can be found in the software module):
par1 <- as.numeric(par1)
if (par2 == 'Single') K <- 1
if (par2 == 'Double') K <- 2
if (par2 == 'Triple') K <- par1
nx <- length(x)
nxmK <- nx - K
x <- ts(x, frequency = par1)
if (par2 == 'Single') fit <- HoltWinters(x, gamma=0, beta=0)
if (par2 == 'Double') fit <- HoltWinters(x, gamma=0)
if (par2 == 'Triple') fit <- HoltWinters(x, seasonal=par3)
fit
myresid <- x - fit$fitted[,'xhat']
bitmap(file='test1.png')
op <- par(mfrow=c(2,1))
plot(fit,ylab='Observed (black) / Fitted (red)',main='Interpolation Fit of Exponential Smoothing')
plot(myresid,ylab='Residuals',main='Interpolation Prediction Errors')
par(op)
dev.off()
bitmap(file='test2.png')
p <- predict(fit, par1, prediction.interval=TRUE)
np <- length(p[,1])
plot(fit,p,ylab='Observed (black) / Fitted (red)',main='Extrapolation Fit of Exponential Smoothing')
dev.off()
bitmap(file='test3.png')
op <- par(mfrow = c(2,2))
acf(as.numeric(myresid),lag.max = nx/2,main='Residual ACF')
spectrum(myresid,main='Residals Periodogram')
cpgram(myresid,main='Residal Cumulative Periodogram')
qqnorm(myresid,main='Residual Normal QQ Plot')
qqline(myresid)
par(op)
dev.off()
load(file='createtable')
a<-table.start()
a<-table.row.start(a)
a<-table.element(a,'Estimated Parameters of Exponential Smoothing',2,TRUE)
a<-table.row.end(a)
a<-table.row.start(a)
a<-table.element(a,'Parameter',header=TRUE)
a<-table.element(a,'Value',header=TRUE)
a<-table.row.end(a)
a<-table.row.start(a)
a<-table.element(a,'alpha',header=TRUE)
a<-table.element(a,fit$alpha)
a<-table.row.end(a)
a<-table.row.start(a)
a<-table.element(a,'beta',header=TRUE)
a<-table.element(a,fit$beta)
a<-table.row.end(a)
a<-table.row.start(a)
a<-table.element(a,'gamma',header=TRUE)
a<-table.element(a,fit$gamma)
a<-table.row.end(a)
a<-table.end(a)
table.save(a,file='mytable.tab')
a<-table.start()
a<-table.row.start(a)
a<-table.element(a,'Interpolation Forecasts of Exponential Smoothing',4,TRUE)
a<-table.row.end(a)
a<-table.row.start(a)
a<-table.element(a,'t',header=TRUE)
a<-table.element(a,'Observed',header=TRUE)
a<-table.element(a,'Fitted',header=TRUE)
a<-table.element(a,'Residuals',header=TRUE)
a<-table.row.end(a)
for (i in 1:nxmK) {
a<-table.row.start(a)
a<-table.element(a,i+K,header=TRUE)
a<-table.element(a,x[i+K])
a<-table.element(a,fit$fitted[i,'xhat'])
a<-table.element(a,myresid[i])
a<-table.row.end(a)
}
a<-table.end(a)
table.save(a,file='mytable1.tab')
a<-table.start()
a<-table.row.start(a)
a<-table.element(a,'Extrapolation Forecasts of Exponential Smoothing',4,TRUE)
a<-table.row.end(a)
a<-table.row.start(a)
a<-table.element(a,'t',header=TRUE)
a<-table.element(a,'Forecast',header=TRUE)
a<-table.element(a,'95% Lower Bound',header=TRUE)
a<-table.element(a,'95% Upper Bound',header=TRUE)
a<-table.row.end(a)
for (i in 1:np) {
a<-table.row.start(a)
a<-table.element(a,nx+i,header=TRUE)
a<-table.element(a,p[i,'fit'])
a<-table.element(a,p[i,'lwr'])
a<-table.element(a,p[i,'upr'])
a<-table.row.end(a)
}
a<-table.end(a)
table.save(a,file='mytable2.tab')