Free Statistics

of Irreproducible Research!

Author's title

Author*The author of this computation has been verified*
R Software Modulerwasp_arimaforecasting.wasp
Title produced by softwareARIMA Forecasting
Date of computationFri, 11 Dec 2009 10:38:45 -0700
Cite this page as followsStatistical Computations at FreeStatistics.org, Office for Research Development and Education, URL https://freestatistics.org/blog/index.php?v=date/2009/Dec/11/t1260553311ugbgceq6442280j.htm/, Retrieved Sun, 28 Apr 2024 06:38:04 +0000
Statistical Computations at FreeStatistics.org, Office for Research Development and Education, URL https://freestatistics.org/blog/index.php?pk=66601, Retrieved Sun, 28 Apr 2024 06:38:04 +0000
QR Codes:

Original text written by user:
IsPrivate?No (this computation is public)
User-defined keywords
Estimated Impact154
Family? (F = Feedback message, R = changed R code, M = changed R Module, P = changed Parameters, D = changed Data)
-     [Univariate Data Series] [data set] [2008-12-01 19:54:57] [b98453cac15ba1066b407e146608df68]
- RMP   [ARIMA Backward Selection] [] [2009-11-27 14:53:14] [b98453cac15ba1066b407e146608df68]
-    D    [ARIMA Backward Selection] [] [2009-12-03 12:27:58] [875a981b2b01315c1c471abd4dd66675]
- RMP         [ARIMA Forecasting] [] [2009-12-11 17:38:45] [8551abdd6804649d94d88b1829ac2b1a] [Current]
-   PD          [ARIMA Forecasting] [] [2009-12-20 17:05:15] [875a981b2b01315c1c471abd4dd66675]
Feedback Forum

Post a new message
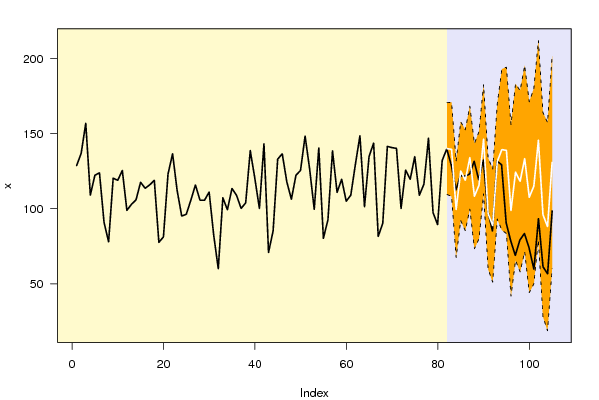
Dataseries X:
128,7
136,9
156,9
109,1
122,3
123,9
90,9
77,9
120,3
118,9
125,5
98,9
102,9
105,9
117,6
113,6
115,9
118,9
77,6
81,2
123,1
136,6
112,1
95,1
96,3
105,7
115,8
105,7
105,7
111,1
82,4
60
107,3
99,3
113,5
108,9
100,2
103,9
138,7
120,2
100,2
143,2
70,9
85,2
133
136,6
117,9
106,3
122,3
125,5
148,4
126,3
99,6
140,4
80,3
92,6
138,5
110,9
119,6
105
109
129,4
148,6
101,4
134,8
143,7
81,6
90,3
141,5
140,7
140,2
100,2
125,7
119,6
134,7
109
116,3
146,9
97,4
89,4
132,1
139,8
129
112,5
121,9
121,7
123,1
131,6
119,3
132,5
98,3
85,1
131,7
129,3
90,7
78,6
68,9
79,1
83,5
74,1
59,7
93,3
61,3
56,6
98,5


Summary of computational transaction
Raw Inputview raw input (R code)
Raw Outputview raw output of R engine
Computing time2 seconds
R Server'Gwilym Jenkins' @ 72.249.127.135

\begin{tabular}{lllllllll}
\hline
Summary of computational transaction \tabularnewline
Raw Input & view raw input (R code)  \tabularnewline
Raw Output & view raw output of R engine  \tabularnewline
Computing time & 2 seconds \tabularnewline
R Server & 'Gwilym Jenkins' @ 72.249.127.135 \tabularnewline
\hline
\end{tabular}
%Source: https://freestatistics.org/blog/index.php?pk=66601&T=0

[TABLE]
[ROW][C]Summary of computational transaction[/C][/ROW]
[ROW][C]Raw Input[/C][C]view raw input (R code) [/C][/ROW]
[ROW][C]Raw Output[/C][C]view raw output of R engine [/C][/ROW]
[ROW][C]Computing time[/C][C]2 seconds[/C][/ROW]
[ROW][C]R Server[/C][C]'Gwilym Jenkins' @ 72.249.127.135[/C][/ROW]
[/TABLE]
Source: https://freestatistics.org/blog/index.php?pk=66601&T=0

Globally Unique Identifier (entire table): ba.freestatistics.org/blog/index.php?pk=66601&T=0

As an alternative you can also use a QR Code:  

The GUIDs for individual cells are displayed in the table below:

Summary of computational transaction
Raw Inputview raw input (R code)
Raw Outputview raw output of R engine
Computing time2 seconds
R Server'Gwilym Jenkins' @ 72.249.127.135


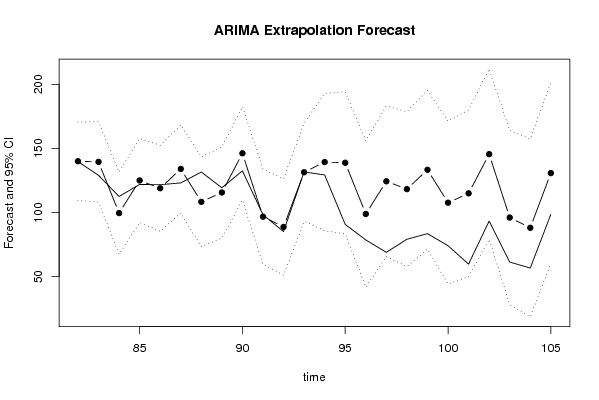
Univariate ARIMA Extrapolation Forecast
timeY[t]F[t]95% LB95% UBp-value(H0: Y[t] = F[t])P(F[t]>Y[t-1])P(F[t]>Y[t-s])P(F[t]>Y[81])
69141.5-------
70140.7-------
71140.2-------
72100.2-------
73125.7-------
74119.6-------
75134.7-------
76109-------
77116.3-------
78146.9-------
7997.4-------
8089.4-------
81132.1-------
82139.8140.0296109.4558170.60340.49410.69440.48290.6944
83129139.5296108.1735170.88580.25520.49330.48330.6788
84112.599.529667.4102131.6490.21430.03610.48370.0234
85121.9125.029692.1647157.89450.4260.77250.48410.3366
86121.7118.929685.3357152.52350.43580.43120.48440.2211
87123.1134.029699.7222168.33710.26620.75940.48470.5439
88131.6108.329673.3232143.3360.09630.20410.4850.0916
89119.3115.629679.9379151.32130.42010.19020.48530.1829
90132.5146.2296109.8655182.59370.22960.92670.48560.7768
9198.396.729659.7054133.75380.46690.02910.48580.0306
9285.188.729651.0568126.40240.42510.30930.48610.012
93131.7131.429693.1192169.74010.49450.99110.48630.4863
94129.3139.359285.7261192.99240.35660.61020.49360.6046
9590.7138.859283.4489194.26960.04420.63240.63640.5945
9678.698.859241.7269155.99150.24350.61020.31990.1271
9768.9124.359265.5554183.16310.03230.93640.53270.3982
9879.1118.259257.83178.68840.1020.94530.45560.3267
9983.5133.359271.3473195.37120.05750.95680.62710.5159
10074.1107.659244.1039171.21450.15030.77190.23020.2255
10159.7114.959249.8972180.02130.0480.89080.4480.3028
10293.3145.559279.0246212.09390.06180.99430.64980.6541
10361.396.059228.0838164.03460.15810.53170.47420.1494
10456.688.059218.673157.44550.18710.77510.53330.1067
10598.5130.759259.9903201.52820.18580.980.48960.4852

\begin{tabular}{lllllllll}
\hline
Univariate ARIMA Extrapolation Forecast \tabularnewline
time & Y[t] & F[t] & 95% LB & 95% UB & p-value(H0: Y[t] = F[t]) & P(F[t]>Y[t-1]) & P(F[t]>Y[t-s]) & P(F[t]>Y[81]) \tabularnewline
69 & 141.5 & - & - & - & - & - & - & - \tabularnewline
70 & 140.7 & - & - & - & - & - & - & - \tabularnewline
71 & 140.2 & - & - & - & - & - & - & - \tabularnewline
72 & 100.2 & - & - & - & - & - & - & - \tabularnewline
73 & 125.7 & - & - & - & - & - & - & - \tabularnewline
74 & 119.6 & - & - & - & - & - & - & - \tabularnewline
75 & 134.7 & - & - & - & - & - & - & - \tabularnewline
76 & 109 & - & - & - & - & - & - & - \tabularnewline
77 & 116.3 & - & - & - & - & - & - & - \tabularnewline
78 & 146.9 & - & - & - & - & - & - & - \tabularnewline
79 & 97.4 & - & - & - & - & - & - & - \tabularnewline
80 & 89.4 & - & - & - & - & - & - & - \tabularnewline
81 & 132.1 & - & - & - & - & - & - & - \tabularnewline
82 & 139.8 & 140.0296 & 109.4558 & 170.6034 & 0.4941 & 0.6944 & 0.4829 & 0.6944 \tabularnewline
83 & 129 & 139.5296 & 108.1735 & 170.8858 & 0.2552 & 0.4933 & 0.4833 & 0.6788 \tabularnewline
84 & 112.5 & 99.5296 & 67.4102 & 131.649 & 0.2143 & 0.0361 & 0.4837 & 0.0234 \tabularnewline
85 & 121.9 & 125.0296 & 92.1647 & 157.8945 & 0.426 & 0.7725 & 0.4841 & 0.3366 \tabularnewline
86 & 121.7 & 118.9296 & 85.3357 & 152.5235 & 0.4358 & 0.4312 & 0.4844 & 0.2211 \tabularnewline
87 & 123.1 & 134.0296 & 99.7222 & 168.3371 & 0.2662 & 0.7594 & 0.4847 & 0.5439 \tabularnewline
88 & 131.6 & 108.3296 & 73.3232 & 143.336 & 0.0963 & 0.2041 & 0.485 & 0.0916 \tabularnewline
89 & 119.3 & 115.6296 & 79.9379 & 151.3213 & 0.4201 & 0.1902 & 0.4853 & 0.1829 \tabularnewline
90 & 132.5 & 146.2296 & 109.8655 & 182.5937 & 0.2296 & 0.9267 & 0.4856 & 0.7768 \tabularnewline
91 & 98.3 & 96.7296 & 59.7054 & 133.7538 & 0.4669 & 0.0291 & 0.4858 & 0.0306 \tabularnewline
92 & 85.1 & 88.7296 & 51.0568 & 126.4024 & 0.4251 & 0.3093 & 0.4861 & 0.012 \tabularnewline
93 & 131.7 & 131.4296 & 93.1192 & 169.7401 & 0.4945 & 0.9911 & 0.4863 & 0.4863 \tabularnewline
94 & 129.3 & 139.3592 & 85.7261 & 192.9924 & 0.3566 & 0.6102 & 0.4936 & 0.6046 \tabularnewline
95 & 90.7 & 138.8592 & 83.4489 & 194.2696 & 0.0442 & 0.6324 & 0.6364 & 0.5945 \tabularnewline
96 & 78.6 & 98.8592 & 41.7269 & 155.9915 & 0.2435 & 0.6102 & 0.3199 & 0.1271 \tabularnewline
97 & 68.9 & 124.3592 & 65.5554 & 183.1631 & 0.0323 & 0.9364 & 0.5327 & 0.3982 \tabularnewline
98 & 79.1 & 118.2592 & 57.83 & 178.6884 & 0.102 & 0.9453 & 0.4556 & 0.3267 \tabularnewline
99 & 83.5 & 133.3592 & 71.3473 & 195.3712 & 0.0575 & 0.9568 & 0.6271 & 0.5159 \tabularnewline
100 & 74.1 & 107.6592 & 44.1039 & 171.2145 & 0.1503 & 0.7719 & 0.2302 & 0.2255 \tabularnewline
101 & 59.7 & 114.9592 & 49.8972 & 180.0213 & 0.048 & 0.8908 & 0.448 & 0.3028 \tabularnewline
102 & 93.3 & 145.5592 & 79.0246 & 212.0939 & 0.0618 & 0.9943 & 0.6498 & 0.6541 \tabularnewline
103 & 61.3 & 96.0592 & 28.0838 & 164.0346 & 0.1581 & 0.5317 & 0.4742 & 0.1494 \tabularnewline
104 & 56.6 & 88.0592 & 18.673 & 157.4455 & 0.1871 & 0.7751 & 0.5333 & 0.1067 \tabularnewline
105 & 98.5 & 130.7592 & 59.9903 & 201.5282 & 0.1858 & 0.98 & 0.4896 & 0.4852 \tabularnewline
\hline
\end{tabular}
%Source: https://freestatistics.org/blog/index.php?pk=66601&T=1

[TABLE]
[ROW][C]Univariate ARIMA Extrapolation Forecast[/C][/ROW]
[ROW][C]time[/C][C]Y[t][/C][C]F[t][/C][C]95% LB[/C][C]95% UB[/C][C]p-value(H0: Y[t] = F[t])[/C][C]P(F[t]>Y[t-1])[/C][C]P(F[t]>Y[t-s])[/C][C]P(F[t]>Y[81])[/C][/ROW]
[ROW][C]69[/C][C]141.5[/C][C]-[/C][C]-[/C][C]-[/C][C]-[/C][C]-[/C][C]-[/C][C]-[/C][/ROW]
[ROW][C]70[/C][C]140.7[/C][C]-[/C][C]-[/C][C]-[/C][C]-[/C][C]-[/C][C]-[/C][C]-[/C][/ROW]
[ROW][C]71[/C][C]140.2[/C][C]-[/C][C]-[/C][C]-[/C][C]-[/C][C]-[/C][C]-[/C][C]-[/C][/ROW]
[ROW][C]72[/C][C]100.2[/C][C]-[/C][C]-[/C][C]-[/C][C]-[/C][C]-[/C][C]-[/C][C]-[/C][/ROW]
[ROW][C]73[/C][C]125.7[/C][C]-[/C][C]-[/C][C]-[/C][C]-[/C][C]-[/C][C]-[/C][C]-[/C][/ROW]
[ROW][C]74[/C][C]119.6[/C][C]-[/C][C]-[/C][C]-[/C][C]-[/C][C]-[/C][C]-[/C][C]-[/C][/ROW]
[ROW][C]75[/C][C]134.7[/C][C]-[/C][C]-[/C][C]-[/C][C]-[/C][C]-[/C][C]-[/C][C]-[/C][/ROW]
[ROW][C]76[/C][C]109[/C][C]-[/C][C]-[/C][C]-[/C][C]-[/C][C]-[/C][C]-[/C][C]-[/C][/ROW]
[ROW][C]77[/C][C]116.3[/C][C]-[/C][C]-[/C][C]-[/C][C]-[/C][C]-[/C][C]-[/C][C]-[/C][/ROW]
[ROW][C]78[/C][C]146.9[/C][C]-[/C][C]-[/C][C]-[/C][C]-[/C][C]-[/C][C]-[/C][C]-[/C][/ROW]
[ROW][C]79[/C][C]97.4[/C][C]-[/C][C]-[/C][C]-[/C][C]-[/C][C]-[/C][C]-[/C][C]-[/C][/ROW]
[ROW][C]80[/C][C]89.4[/C][C]-[/C][C]-[/C][C]-[/C][C]-[/C][C]-[/C][C]-[/C][C]-[/C][/ROW]
[ROW][C]81[/C][C]132.1[/C][C]-[/C][C]-[/C][C]-[/C][C]-[/C][C]-[/C][C]-[/C][C]-[/C][/ROW]
[ROW][C]82[/C][C]139.8[/C][C]140.0296[/C][C]109.4558[/C][C]170.6034[/C][C]0.4941[/C][C]0.6944[/C][C]0.4829[/C][C]0.6944[/C][/ROW]
[ROW][C]83[/C][C]129[/C][C]139.5296[/C][C]108.1735[/C][C]170.8858[/C][C]0.2552[/C][C]0.4933[/C][C]0.4833[/C][C]0.6788[/C][/ROW]
[ROW][C]84[/C][C]112.5[/C][C]99.5296[/C][C]67.4102[/C][C]131.649[/C][C]0.2143[/C][C]0.0361[/C][C]0.4837[/C][C]0.0234[/C][/ROW]
[ROW][C]85[/C][C]121.9[/C][C]125.0296[/C][C]92.1647[/C][C]157.8945[/C][C]0.426[/C][C]0.7725[/C][C]0.4841[/C][C]0.3366[/C][/ROW]
[ROW][C]86[/C][C]121.7[/C][C]118.9296[/C][C]85.3357[/C][C]152.5235[/C][C]0.4358[/C][C]0.4312[/C][C]0.4844[/C][C]0.2211[/C][/ROW]
[ROW][C]87[/C][C]123.1[/C][C]134.0296[/C][C]99.7222[/C][C]168.3371[/C][C]0.2662[/C][C]0.7594[/C][C]0.4847[/C][C]0.5439[/C][/ROW]
[ROW][C]88[/C][C]131.6[/C][C]108.3296[/C][C]73.3232[/C][C]143.336[/C][C]0.0963[/C][C]0.2041[/C][C]0.485[/C][C]0.0916[/C][/ROW]
[ROW][C]89[/C][C]119.3[/C][C]115.6296[/C][C]79.9379[/C][C]151.3213[/C][C]0.4201[/C][C]0.1902[/C][C]0.4853[/C][C]0.1829[/C][/ROW]
[ROW][C]90[/C][C]132.5[/C][C]146.2296[/C][C]109.8655[/C][C]182.5937[/C][C]0.2296[/C][C]0.9267[/C][C]0.4856[/C][C]0.7768[/C][/ROW]
[ROW][C]91[/C][C]98.3[/C][C]96.7296[/C][C]59.7054[/C][C]133.7538[/C][C]0.4669[/C][C]0.0291[/C][C]0.4858[/C][C]0.0306[/C][/ROW]
[ROW][C]92[/C][C]85.1[/C][C]88.7296[/C][C]51.0568[/C][C]126.4024[/C][C]0.4251[/C][C]0.3093[/C][C]0.4861[/C][C]0.012[/C][/ROW]
[ROW][C]93[/C][C]131.7[/C][C]131.4296[/C][C]93.1192[/C][C]169.7401[/C][C]0.4945[/C][C]0.9911[/C][C]0.4863[/C][C]0.4863[/C][/ROW]
[ROW][C]94[/C][C]129.3[/C][C]139.3592[/C][C]85.7261[/C][C]192.9924[/C][C]0.3566[/C][C]0.6102[/C][C]0.4936[/C][C]0.6046[/C][/ROW]
[ROW][C]95[/C][C]90.7[/C][C]138.8592[/C][C]83.4489[/C][C]194.2696[/C][C]0.0442[/C][C]0.6324[/C][C]0.6364[/C][C]0.5945[/C][/ROW]
[ROW][C]96[/C][C]78.6[/C][C]98.8592[/C][C]41.7269[/C][C]155.9915[/C][C]0.2435[/C][C]0.6102[/C][C]0.3199[/C][C]0.1271[/C][/ROW]
[ROW][C]97[/C][C]68.9[/C][C]124.3592[/C][C]65.5554[/C][C]183.1631[/C][C]0.0323[/C][C]0.9364[/C][C]0.5327[/C][C]0.3982[/C][/ROW]
[ROW][C]98[/C][C]79.1[/C][C]118.2592[/C][C]57.83[/C][C]178.6884[/C][C]0.102[/C][C]0.9453[/C][C]0.4556[/C][C]0.3267[/C][/ROW]
[ROW][C]99[/C][C]83.5[/C][C]133.3592[/C][C]71.3473[/C][C]195.3712[/C][C]0.0575[/C][C]0.9568[/C][C]0.6271[/C][C]0.5159[/C][/ROW]
[ROW][C]100[/C][C]74.1[/C][C]107.6592[/C][C]44.1039[/C][C]171.2145[/C][C]0.1503[/C][C]0.7719[/C][C]0.2302[/C][C]0.2255[/C][/ROW]
[ROW][C]101[/C][C]59.7[/C][C]114.9592[/C][C]49.8972[/C][C]180.0213[/C][C]0.048[/C][C]0.8908[/C][C]0.448[/C][C]0.3028[/C][/ROW]
[ROW][C]102[/C][C]93.3[/C][C]145.5592[/C][C]79.0246[/C][C]212.0939[/C][C]0.0618[/C][C]0.9943[/C][C]0.6498[/C][C]0.6541[/C][/ROW]
[ROW][C]103[/C][C]61.3[/C][C]96.0592[/C][C]28.0838[/C][C]164.0346[/C][C]0.1581[/C][C]0.5317[/C][C]0.4742[/C][C]0.1494[/C][/ROW]
[ROW][C]104[/C][C]56.6[/C][C]88.0592[/C][C]18.673[/C][C]157.4455[/C][C]0.1871[/C][C]0.7751[/C][C]0.5333[/C][C]0.1067[/C][/ROW]
[ROW][C]105[/C][C]98.5[/C][C]130.7592[/C][C]59.9903[/C][C]201.5282[/C][C]0.1858[/C][C]0.98[/C][C]0.4896[/C][C]0.4852[/C][/ROW]
[/TABLE]
Source: https://freestatistics.org/blog/index.php?pk=66601&T=1

Globally Unique Identifier (entire table): ba.freestatistics.org/blog/index.php?pk=66601&T=1

As an alternative you can also use a QR Code:  

The GUIDs for individual cells are displayed in the table below:

Univariate ARIMA Extrapolation Forecast
timeY[t]F[t]95% LB95% UBp-value(H0: Y[t] = F[t])P(F[t]>Y[t-1])P(F[t]>Y[t-s])P(F[t]>Y[81])
69141.5-------
70140.7-------
71140.2-------
72100.2-------
73125.7-------
74119.6-------
75134.7-------
76109-------
77116.3-------
78146.9-------
7997.4-------
8089.4-------
81132.1-------
82139.8140.0296109.4558170.60340.49410.69440.48290.6944
83129139.5296108.1735170.88580.25520.49330.48330.6788
84112.599.529667.4102131.6490.21430.03610.48370.0234
85121.9125.029692.1647157.89450.4260.77250.48410.3366
86121.7118.929685.3357152.52350.43580.43120.48440.2211
87123.1134.029699.7222168.33710.26620.75940.48470.5439
88131.6108.329673.3232143.3360.09630.20410.4850.0916
89119.3115.629679.9379151.32130.42010.19020.48530.1829
90132.5146.2296109.8655182.59370.22960.92670.48560.7768
9198.396.729659.7054133.75380.46690.02910.48580.0306
9285.188.729651.0568126.40240.42510.30930.48610.012
93131.7131.429693.1192169.74010.49450.99110.48630.4863
94129.3139.359285.7261192.99240.35660.61020.49360.6046
9590.7138.859283.4489194.26960.04420.63240.63640.5945
9678.698.859241.7269155.99150.24350.61020.31990.1271
9768.9124.359265.5554183.16310.03230.93640.53270.3982
9879.1118.259257.83178.68840.1020.94530.45560.3267
9983.5133.359271.3473195.37120.05750.95680.62710.5159
10074.1107.659244.1039171.21450.15030.77190.23020.2255
10159.7114.959249.8972180.02130.0480.89080.4480.3028
10293.3145.559279.0246212.09390.06180.99430.64980.6541
10361.396.059228.0838164.03460.15810.53170.47420.1494
10456.688.059218.673157.44550.18710.77510.53330.1067
10598.5130.759259.9903201.52820.18580.980.48960.4852


Univariate ARIMA Extrapolation Forecast Performance
time% S.E.PEMAPESq.EMSERMSE
820.1114-0.001600.052700
830.1147-0.07550.0386110.872855.46277.4473
840.16460.13030.0691168.230993.05219.6464
850.1341-0.0250.05819.794572.23778.4993
860.14410.02330.05117.67559.32527.7023
870.1306-0.08150.0562119.456569.34718.3275
880.16490.21480.0789541.5109136.79911.6961
890.15750.03170.07313.4717121.383111.0174
900.1269-0.09390.0753188.5023128.840811.3508
910.19530.01620.06942.4661116.203310.7798
920.2166-0.04090.066813.1741106.83710.3362
930.14870.00210.06140.073197.94019.8965
940.1964-0.07220.0622101.188198.18999.9091
950.2036-0.34680.08262319.3113256.841416.0263
960.2949-0.20490.0907410.4363267.081116.3426
970.2413-0.4460.11293075.726442.621421.0386
980.2607-0.33110.12581533.4452506.787522.5119
990.2372-0.37390.13952485.9426616.740624.8343
1000.3012-0.31170.14861126.2218643.555425.3684
1010.2888-0.48070.16523053.5823764.056727.6416
1020.2332-0.3590.17442731.0269857.72229.2869
1030.361-0.36190.1831208.204873.65329.5576
1040.402-0.35730.1905989.683878.697729.6428
1050.2761-0.24670.19291040.6578885.446129.7564

\begin{tabular}{lllllllll}
\hline
Univariate ARIMA Extrapolation Forecast Performance \tabularnewline
time & % S.E. & PE & MAPE & Sq.E & MSE & RMSE \tabularnewline
82 & 0.1114 & -0.0016 & 0 & 0.0527 & 0 & 0 \tabularnewline
83 & 0.1147 & -0.0755 & 0.0386 & 110.8728 & 55.4627 & 7.4473 \tabularnewline
84 & 0.1646 & 0.1303 & 0.0691 & 168.2309 & 93.0521 & 9.6464 \tabularnewline
85 & 0.1341 & -0.025 & 0.0581 & 9.7945 & 72.2377 & 8.4993 \tabularnewline
86 & 0.1441 & 0.0233 & 0.0511 & 7.675 & 59.3252 & 7.7023 \tabularnewline
87 & 0.1306 & -0.0815 & 0.0562 & 119.4565 & 69.3471 & 8.3275 \tabularnewline
88 & 0.1649 & 0.2148 & 0.0789 & 541.5109 & 136.799 & 11.6961 \tabularnewline
89 & 0.1575 & 0.0317 & 0.073 & 13.4717 & 121.3831 & 11.0174 \tabularnewline
90 & 0.1269 & -0.0939 & 0.0753 & 188.5023 & 128.8408 & 11.3508 \tabularnewline
91 & 0.1953 & 0.0162 & 0.0694 & 2.4661 & 116.2033 & 10.7798 \tabularnewline
92 & 0.2166 & -0.0409 & 0.0668 & 13.1741 & 106.837 & 10.3362 \tabularnewline
93 & 0.1487 & 0.0021 & 0.0614 & 0.0731 & 97.9401 & 9.8965 \tabularnewline
94 & 0.1964 & -0.0722 & 0.0622 & 101.1881 & 98.1899 & 9.9091 \tabularnewline
95 & 0.2036 & -0.3468 & 0.0826 & 2319.3113 & 256.8414 & 16.0263 \tabularnewline
96 & 0.2949 & -0.2049 & 0.0907 & 410.4363 & 267.0811 & 16.3426 \tabularnewline
97 & 0.2413 & -0.446 & 0.1129 & 3075.726 & 442.6214 & 21.0386 \tabularnewline
98 & 0.2607 & -0.3311 & 0.1258 & 1533.4452 & 506.7875 & 22.5119 \tabularnewline
99 & 0.2372 & -0.3739 & 0.1395 & 2485.9426 & 616.7406 & 24.8343 \tabularnewline
100 & 0.3012 & -0.3117 & 0.1486 & 1126.2218 & 643.5554 & 25.3684 \tabularnewline
101 & 0.2888 & -0.4807 & 0.1652 & 3053.5823 & 764.0567 & 27.6416 \tabularnewline
102 & 0.2332 & -0.359 & 0.1744 & 2731.0269 & 857.722 & 29.2869 \tabularnewline
103 & 0.361 & -0.3619 & 0.183 & 1208.204 & 873.653 & 29.5576 \tabularnewline
104 & 0.402 & -0.3573 & 0.1905 & 989.683 & 878.6977 & 29.6428 \tabularnewline
105 & 0.2761 & -0.2467 & 0.1929 & 1040.6578 & 885.4461 & 29.7564 \tabularnewline
\hline
\end{tabular}
%Source: https://freestatistics.org/blog/index.php?pk=66601&T=2

[TABLE]
[ROW][C]Univariate ARIMA Extrapolation Forecast Performance[/C][/ROW]
[ROW][C]time[/C][C]% S.E.[/C][C]PE[/C][C]MAPE[/C][C]Sq.E[/C][C]MSE[/C][C]RMSE[/C][/ROW]
[ROW][C]82[/C][C]0.1114[/C][C]-0.0016[/C][C]0[/C][C]0.0527[/C][C]0[/C][C]0[/C][/ROW]
[ROW][C]83[/C][C]0.1147[/C][C]-0.0755[/C][C]0.0386[/C][C]110.8728[/C][C]55.4627[/C][C]7.4473[/C][/ROW]
[ROW][C]84[/C][C]0.1646[/C][C]0.1303[/C][C]0.0691[/C][C]168.2309[/C][C]93.0521[/C][C]9.6464[/C][/ROW]
[ROW][C]85[/C][C]0.1341[/C][C]-0.025[/C][C]0.0581[/C][C]9.7945[/C][C]72.2377[/C][C]8.4993[/C][/ROW]
[ROW][C]86[/C][C]0.1441[/C][C]0.0233[/C][C]0.0511[/C][C]7.675[/C][C]59.3252[/C][C]7.7023[/C][/ROW]
[ROW][C]87[/C][C]0.1306[/C][C]-0.0815[/C][C]0.0562[/C][C]119.4565[/C][C]69.3471[/C][C]8.3275[/C][/ROW]
[ROW][C]88[/C][C]0.1649[/C][C]0.2148[/C][C]0.0789[/C][C]541.5109[/C][C]136.799[/C][C]11.6961[/C][/ROW]
[ROW][C]89[/C][C]0.1575[/C][C]0.0317[/C][C]0.073[/C][C]13.4717[/C][C]121.3831[/C][C]11.0174[/C][/ROW]
[ROW][C]90[/C][C]0.1269[/C][C]-0.0939[/C][C]0.0753[/C][C]188.5023[/C][C]128.8408[/C][C]11.3508[/C][/ROW]
[ROW][C]91[/C][C]0.1953[/C][C]0.0162[/C][C]0.0694[/C][C]2.4661[/C][C]116.2033[/C][C]10.7798[/C][/ROW]
[ROW][C]92[/C][C]0.2166[/C][C]-0.0409[/C][C]0.0668[/C][C]13.1741[/C][C]106.837[/C][C]10.3362[/C][/ROW]
[ROW][C]93[/C][C]0.1487[/C][C]0.0021[/C][C]0.0614[/C][C]0.0731[/C][C]97.9401[/C][C]9.8965[/C][/ROW]
[ROW][C]94[/C][C]0.1964[/C][C]-0.0722[/C][C]0.0622[/C][C]101.1881[/C][C]98.1899[/C][C]9.9091[/C][/ROW]
[ROW][C]95[/C][C]0.2036[/C][C]-0.3468[/C][C]0.0826[/C][C]2319.3113[/C][C]256.8414[/C][C]16.0263[/C][/ROW]
[ROW][C]96[/C][C]0.2949[/C][C]-0.2049[/C][C]0.0907[/C][C]410.4363[/C][C]267.0811[/C][C]16.3426[/C][/ROW]
[ROW][C]97[/C][C]0.2413[/C][C]-0.446[/C][C]0.1129[/C][C]3075.726[/C][C]442.6214[/C][C]21.0386[/C][/ROW]
[ROW][C]98[/C][C]0.2607[/C][C]-0.3311[/C][C]0.1258[/C][C]1533.4452[/C][C]506.7875[/C][C]22.5119[/C][/ROW]
[ROW][C]99[/C][C]0.2372[/C][C]-0.3739[/C][C]0.1395[/C][C]2485.9426[/C][C]616.7406[/C][C]24.8343[/C][/ROW]
[ROW][C]100[/C][C]0.3012[/C][C]-0.3117[/C][C]0.1486[/C][C]1126.2218[/C][C]643.5554[/C][C]25.3684[/C][/ROW]
[ROW][C]101[/C][C]0.2888[/C][C]-0.4807[/C][C]0.1652[/C][C]3053.5823[/C][C]764.0567[/C][C]27.6416[/C][/ROW]
[ROW][C]102[/C][C]0.2332[/C][C]-0.359[/C][C]0.1744[/C][C]2731.0269[/C][C]857.722[/C][C]29.2869[/C][/ROW]
[ROW][C]103[/C][C]0.361[/C][C]-0.3619[/C][C]0.183[/C][C]1208.204[/C][C]873.653[/C][C]29.5576[/C][/ROW]
[ROW][C]104[/C][C]0.402[/C][C]-0.3573[/C][C]0.1905[/C][C]989.683[/C][C]878.6977[/C][C]29.6428[/C][/ROW]
[ROW][C]105[/C][C]0.2761[/C][C]-0.2467[/C][C]0.1929[/C][C]1040.6578[/C][C]885.4461[/C][C]29.7564[/C][/ROW]
[/TABLE]
Source: https://freestatistics.org/blog/index.php?pk=66601&T=2

Globally Unique Identifier (entire table): ba.freestatistics.org/blog/index.php?pk=66601&T=2

As an alternative you can also use a QR Code:  

The GUIDs for individual cells are displayed in the table below:

Univariate ARIMA Extrapolation Forecast Performance
time% S.E.PEMAPESq.EMSERMSE
820.1114-0.001600.052700
830.1147-0.07550.0386110.872855.46277.4473
840.16460.13030.0691168.230993.05219.6464
850.1341-0.0250.05819.794572.23778.4993
860.14410.02330.05117.67559.32527.7023
870.1306-0.08150.0562119.456569.34718.3275
880.16490.21480.0789541.5109136.79911.6961
890.15750.03170.07313.4717121.383111.0174
900.1269-0.09390.0753188.5023128.840811.3508
910.19530.01620.06942.4661116.203310.7798
920.2166-0.04090.066813.1741106.83710.3362
930.14870.00210.06140.073197.94019.8965
940.1964-0.07220.0622101.188198.18999.9091
950.2036-0.34680.08262319.3113256.841416.0263
960.2949-0.20490.0907410.4363267.081116.3426
970.2413-0.4460.11293075.726442.621421.0386
980.2607-0.33110.12581533.4452506.787522.5119
990.2372-0.37390.13952485.9426616.740624.8343
1000.3012-0.31170.14861126.2218643.555425.3684
1010.2888-0.48070.16523053.5823764.056727.6416
1020.2332-0.3590.17442731.0269857.72229.2869
1030.361-0.36190.1831208.204873.65329.5576
1040.402-0.35730.1905989.683878.697729.6428
1050.2761-0.24670.19291040.6578885.446129.7564


Parameters (Session):
par1 = 24 ; par2 = 1 ; par3 = 1 ; par4 = 1 ; par5 = 12 ; par6 = 0 ; par7 = 1 ; par8 = 0 ; par9 = 0 ; par10 = FALSE ;
Parameters (R input):
par1 = 24 ; par2 = 1 ; par3 = 1 ; par4 = 1 ; par5 = 12 ; par6 = 0 ; par7 = 1 ; par8 = 0 ; par9 = 0 ; par10 = FALSE ;
R code (references can be found in the software module):
par1 <- as.numeric(par1) #cut off periods
par2 <- as.numeric(par2) #lambda
par3 <- as.numeric(par3) #degree of non-seasonal differencing
par4 <- as.numeric(par4) #degree of seasonal differencing
par5 <- as.numeric(par5) #seasonal period
par6 <- as.numeric(par6) #p
par7 <- as.numeric(par7) #q
par8 <- as.numeric(par8) #P
par9 <- as.numeric(par9) #Q
if (par10 == 'TRUE') par10 <- TRUE
if (par10 == 'FALSE') par10 <- FALSE
if (par2 == 0) x <- log(x)
if (par2 != 0) x <- x^par2
lx <- length(x)
first <- lx - 2*par1
nx <- lx - par1
nx1 <- nx + 1
fx <- lx - nx
if (fx < 1) {
fx <- par5
nx1 <- lx + fx - 1
first <- lx - 2*fx
}
first <- 1
if (fx < 3) fx <- round(lx/10,0)
(arima.out <- arima(x[1:nx], order=c(par6,par3,par7), seasonal=list(order=c(par8,par4,par9), period=par5), include.mean=par10, method='ML'))
(forecast <- predict(arima.out,par1))
(lb <- forecast$pred - 1.96 * forecast$se)
(ub <- forecast$pred + 1.96 * forecast$se)
if (par2 == 0) {
x <- exp(x)
forecast$pred <- exp(forecast$pred)
lb <- exp(lb)
ub <- exp(ub)
}
if (par2 != 0) {
x <- x^(1/par2)
forecast$pred <- forecast$pred^(1/par2)
lb <- lb^(1/par2)
ub <- ub^(1/par2)
}
if (par2 < 0) {
olb <- lb
lb <- ub
ub <- olb
}
(actandfor <- c(x[1:nx], forecast$pred))
(perc.se <- (ub-forecast$pred)/1.96/forecast$pred)
bitmap(file='test1.png')
opar <- par(mar=c(4,4,2,2),las=1)
ylim <- c( min(x[first:nx],lb), max(x[first:nx],ub))
plot(x,ylim=ylim,type='n',xlim=c(first,lx))
usr <- par('usr')
rect(usr[1],usr[3],nx+1,usr[4],border=NA,col='lemonchiffon')
rect(nx1,usr[3],usr[2],usr[4],border=NA,col='lavender')
abline(h= (-3:3)*2 , col ='gray', lty =3)
polygon( c(nx1:lx,lx:nx1), c(lb,rev(ub)), col = 'orange', lty=2,border=NA)
lines(nx1:lx, lb , lty=2)
lines(nx1:lx, ub , lty=2)
lines(x, lwd=2)
lines(nx1:lx, forecast$pred , lwd=2 , col ='white')
box()
par(opar)
dev.off()
prob.dec <- array(NA, dim=fx)
prob.sdec <- array(NA, dim=fx)
prob.ldec <- array(NA, dim=fx)
prob.pval <- array(NA, dim=fx)
perf.pe <- array(0, dim=fx)
perf.mape <- array(0, dim=fx)
perf.mape1 <- array(0, dim=fx)
perf.se <- array(0, dim=fx)
perf.mse <- array(0, dim=fx)
perf.mse1 <- array(0, dim=fx)
perf.rmse <- array(0, dim=fx)
for (i in 1:fx) {
locSD <- (ub[i] - forecast$pred[i]) / 1.96
perf.pe[i] = (x[nx+i] - forecast$pred[i]) / forecast$pred[i]
perf.se[i] = (x[nx+i] - forecast$pred[i])^2
prob.dec[i] = pnorm((x[nx+i-1] - forecast$pred[i]) / locSD)
prob.sdec[i] = pnorm((x[nx+i-par5] - forecast$pred[i]) / locSD)
prob.ldec[i] = pnorm((x[nx] - forecast$pred[i]) / locSD)
prob.pval[i] = pnorm(abs(x[nx+i] - forecast$pred[i]) / locSD)
}
perf.mape[1] = abs(perf.pe[1])
perf.mse[1] = abs(perf.se[1])
for (i in 2:fx) {
perf.mape[i] = perf.mape[i-1] + abs(perf.pe[i])
perf.mape1[i] = perf.mape[i] / i
perf.mse[i] = perf.mse[i-1] + perf.se[i]
perf.mse1[i] = perf.mse[i] / i
}
perf.rmse = sqrt(perf.mse1)
bitmap(file='test2.png')
plot(forecast$pred, pch=19, type='b',main='ARIMA Extrapolation Forecast', ylab='Forecast and 95% CI', xlab='time',ylim=c(min(lb),max(ub)))
dum <- forecast$pred
dum[1:par1] <- x[(nx+1):lx]
lines(dum, lty=1)
lines(ub,lty=3)
lines(lb,lty=3)
dev.off()
load(file='createtable')
a<-table.start()
a<-table.row.start(a)
a<-table.element(a,'Univariate ARIMA Extrapolation Forecast',9,TRUE)
a<-table.row.end(a)
a<-table.row.start(a)
a<-table.element(a,'time',1,header=TRUE)
a<-table.element(a,'Y[t]',1,header=TRUE)
a<-table.element(a,'F[t]',1,header=TRUE)
a<-table.element(a,'95% LB',1,header=TRUE)
a<-table.element(a,'95% UB',1,header=TRUE)
a<-table.element(a,'p-value
(H0: Y[t] = F[t])',1,header=TRUE)
a<-table.element(a,'P(F[t]>Y[t-1])',1,header=TRUE)
a<-table.element(a,'P(F[t]>Y[t-s])',1,header=TRUE)
mylab <- paste('P(F[t]>Y[',nx,sep='')
mylab <- paste(mylab,'])',sep='')
a<-table.element(a,mylab,1,header=TRUE)
a<-table.row.end(a)
for (i in (nx-par5):nx) {
a<-table.row.start(a)
a<-table.element(a,i,header=TRUE)
a<-table.element(a,x[i])
a<-table.element(a,'-')
a<-table.row.end(a)
}
for (i in 1:fx) {
a<-table.row.start(a)
a<-table.element(a,nx+i,header=TRUE)
a<-table.element(a,round(x[nx+i],4))
a<-table.element(a,round(forecast$pred[i],4))
a<-table.element(a,round(lb[i],4))
a<-table.element(a,round(ub[i],4))
a<-table.element(a,round((1-prob.pval[i]),4))
a<-table.element(a,round((1-prob.dec[i]),4))
a<-table.element(a,round((1-prob.sdec[i]),4))
a<-table.element(a,round((1-prob.ldec[i]),4))
a<-table.row.end(a)
}
a<-table.end(a)
table.save(a,file='mytable.tab')
a<-table.start()
a<-table.row.start(a)
a<-table.element(a,'Univariate ARIMA Extrapolation Forecast Performance',7,TRUE)
a<-table.row.end(a)
a<-table.row.start(a)
a<-table.element(a,'time',1,header=TRUE)
a<-table.element(a,'% S.E.',1,header=TRUE)
a<-table.element(a,'PE',1,header=TRUE)
a<-table.element(a,'MAPE',1,header=TRUE)
a<-table.element(a,'Sq.E',1,header=TRUE)
a<-table.element(a,'MSE',1,header=TRUE)
a<-table.element(a,'RMSE',1,header=TRUE)
a<-table.row.end(a)
for (i in 1:fx) {
a<-table.row.start(a)
a<-table.element(a,nx+i,header=TRUE)
a<-table.element(a,round(perc.se[i],4))
a<-table.element(a,round(perf.pe[i],4))
a<-table.element(a,round(perf.mape1[i],4))
a<-table.element(a,round(perf.se[i],4))
a<-table.element(a,round(perf.mse1[i],4))
a<-table.element(a,round(perf.rmse[i],4))
a<-table.row.end(a)
}
a<-table.end(a)
table.save(a,file='mytable1.tab')