Free Statistics

of Irreproducible Research!

Author's title

Author*The author of this computation has been verified*
R Software Modulerwasp_autocorrelation.wasp
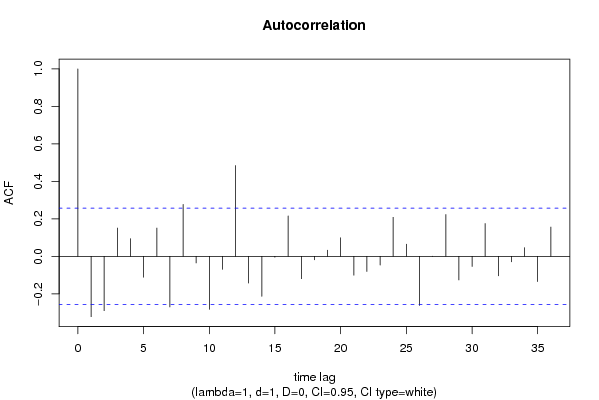
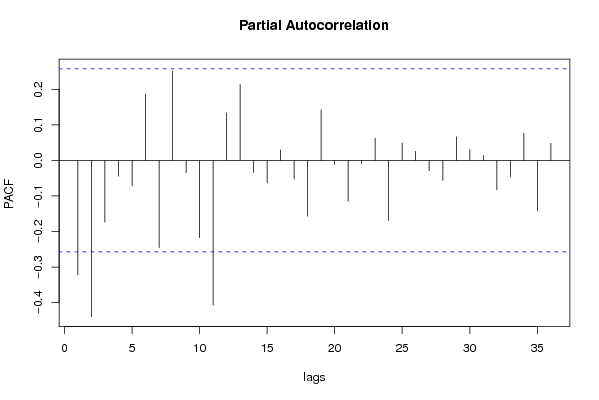
Title produced by software(Partial) Autocorrelation Function
Date of computationMon, 14 Dec 2009 06:07:18 -0700
Cite this page as followsStatistical Computations at FreeStatistics.org, Office for Research Development and Education, URL https://freestatistics.org/blog/index.php?v=date/2009/Dec/14/t1260796399uerzff4tvnwaw0l.htm/, Retrieved Sun, 05 May 2024 16:17:07 +0000
Statistical Computations at FreeStatistics.org, Office for Research Development and Education, URL https://freestatistics.org/blog/index.php?pk=67547, Retrieved Sun, 05 May 2024 16:17:07 +0000
QR Codes:

Original text written by user:
IsPrivate?No (this computation is public)
User-defined keywords
Estimated Impact118
Family? (F = Feedback message, R = changed R code, M = changed R Module, P = changed Parameters, D = changed Data)
-     [Univariate Data Series] [data set] [2008-12-01 19:54:57] [b98453cac15ba1066b407e146608df68]
- RMP   [Standard Deviation-Mean Plot] [] [2009-11-27 14:40:44] [b98453cac15ba1066b407e146608df68]
- RMPD    [(Partial) Autocorrelation Function] [] [2009-12-10 16:13:24] [a9a33b1951d9ae87ed6d7d9055d41c93]
-   PD      [(Partial) Autocorrelation Function] [] [2009-12-14 12:53:49] [a9a33b1951d9ae87ed6d7d9055d41c93]
-   P           [(Partial) Autocorrelation Function] [] [2009-12-14 13:07:18] [66ffaa9e54a90d3ae4874684602d24e9] [Current]
Feedback Forum

Post a new message
Dataseries X:
17823.2
17872
17420.4
16704.4
15991.2
16583.6
19123.5
17838.7
17209.4
18586.5
16258.1
15141.6
19202.1
17746.5
19090.1
18040.3
17515.5
17751.8
21072.4
17170
19439.5
19795.4
17574.9
16165.4
19464.6
19932.1
19961.2
17343.4
18924.2
18574.1
21350.6
18594.6
19823.1
20844.4
19640.2
17735.4
19813.6
22160
20664.3
17877.4
20906.5
21164.1
21374.4
22952.3
21343.5
23899.3
22392.9
18274.1
22786.7
22321.5
17842.2
16373.5
15993.8
16446.1
17729
16643
16196.7
18252.1
17570.4


Summary of computational transaction
Raw Inputview raw input (R code)
Raw Outputview raw output of R engine
Computing time1 seconds
R Server'Gwilym Jenkins' @ 72.249.127.135

\begin{tabular}{lllllllll}
\hline
Summary of computational transaction \tabularnewline
Raw Input & view raw input (R code)  \tabularnewline
Raw Output & view raw output of R engine  \tabularnewline
Computing time & 1 seconds \tabularnewline
R Server & 'Gwilym Jenkins' @ 72.249.127.135 \tabularnewline
\hline
\end{tabular}
%Source: https://freestatistics.org/blog/index.php?pk=67547&T=0

[TABLE]
[ROW][C]Summary of computational transaction[/C][/ROW]
[ROW][C]Raw Input[/C][C]view raw input (R code) [/C][/ROW]
[ROW][C]Raw Output[/C][C]view raw output of R engine [/C][/ROW]
[ROW][C]Computing time[/C][C]1 seconds[/C][/ROW]
[ROW][C]R Server[/C][C]'Gwilym Jenkins' @ 72.249.127.135[/C][/ROW]
[/TABLE]
Source: https://freestatistics.org/blog/index.php?pk=67547&T=0

Globally Unique Identifier (entire table): ba.freestatistics.org/blog/index.php?pk=67547&T=0

As an alternative you can also use a QR Code:  

The GUIDs for individual cells are displayed in the table below:

Summary of computational transaction
Raw Inputview raw input (R code)
Raw Outputview raw output of R engine
Computing time1 seconds
R Server'Gwilym Jenkins' @ 72.249.127.135


Autocorrelation Function
Time lag kACF(k)T-STATP-value
1-0.322076-2.45290.0086
2-0.290326-2.21110.015494
30.1507221.14790.127869
40.0943620.71860.237623
5-0.11169-0.85060.199244
60.1508091.14850.127733
7-0.269987-2.05620.022138
80.2766622.1070.019727
9-0.035236-0.26830.394692
10-0.283073-2.15580.017629
11-0.069146-0.52660.30024
120.484263.6880.00025
13-0.143033-1.08930.140262
14-0.213384-1.62510.054783
15-0.004658-0.03550.485911
160.2155771.64180.053023
17-0.119529-0.91030.183215
18-0.018822-0.14330.443256
190.0327010.2490.402105
200.0987230.75190.22759
21-0.100812-0.76780.222871
22-0.080915-0.61620.270078
23-0.046701-0.35570.361692
240.2084251.58730.058939
250.0646420.49230.312183
26-0.2625-1.99910.025143
270.0007410.00560.497759
280.223051.69870.047367
29-0.126254-0.96150.17014
30-0.053904-0.41050.341468
310.1745431.32930.094481
32-0.104083-0.79270.2156
33-0.02956-0.22510.411338
340.0461960.35180.363124
35-0.134916-1.02750.154228
360.1563541.19080.1193

\begin{tabular}{lllllllll}
\hline
Autocorrelation Function \tabularnewline
Time lag k & ACF(k) & T-STAT & P-value \tabularnewline
1 & -0.322076 & -2.4529 & 0.0086 \tabularnewline
2 & -0.290326 & -2.2111 & 0.015494 \tabularnewline
3 & 0.150722 & 1.1479 & 0.127869 \tabularnewline
4 & 0.094362 & 0.7186 & 0.237623 \tabularnewline
5 & -0.11169 & -0.8506 & 0.199244 \tabularnewline
6 & 0.150809 & 1.1485 & 0.127733 \tabularnewline
7 & -0.269987 & -2.0562 & 0.022138 \tabularnewline
8 & 0.276662 & 2.107 & 0.019727 \tabularnewline
9 & -0.035236 & -0.2683 & 0.394692 \tabularnewline
10 & -0.283073 & -2.1558 & 0.017629 \tabularnewline
11 & -0.069146 & -0.5266 & 0.30024 \tabularnewline
12 & 0.48426 & 3.688 & 0.00025 \tabularnewline
13 & -0.143033 & -1.0893 & 0.140262 \tabularnewline
14 & -0.213384 & -1.6251 & 0.054783 \tabularnewline
15 & -0.004658 & -0.0355 & 0.485911 \tabularnewline
16 & 0.215577 & 1.6418 & 0.053023 \tabularnewline
17 & -0.119529 & -0.9103 & 0.183215 \tabularnewline
18 & -0.018822 & -0.1433 & 0.443256 \tabularnewline
19 & 0.032701 & 0.249 & 0.402105 \tabularnewline
20 & 0.098723 & 0.7519 & 0.22759 \tabularnewline
21 & -0.100812 & -0.7678 & 0.222871 \tabularnewline
22 & -0.080915 & -0.6162 & 0.270078 \tabularnewline
23 & -0.046701 & -0.3557 & 0.361692 \tabularnewline
24 & 0.208425 & 1.5873 & 0.058939 \tabularnewline
25 & 0.064642 & 0.4923 & 0.312183 \tabularnewline
26 & -0.2625 & -1.9991 & 0.025143 \tabularnewline
27 & 0.000741 & 0.0056 & 0.497759 \tabularnewline
28 & 0.22305 & 1.6987 & 0.047367 \tabularnewline
29 & -0.126254 & -0.9615 & 0.17014 \tabularnewline
30 & -0.053904 & -0.4105 & 0.341468 \tabularnewline
31 & 0.174543 & 1.3293 & 0.094481 \tabularnewline
32 & -0.104083 & -0.7927 & 0.2156 \tabularnewline
33 & -0.02956 & -0.2251 & 0.411338 \tabularnewline
34 & 0.046196 & 0.3518 & 0.363124 \tabularnewline
35 & -0.134916 & -1.0275 & 0.154228 \tabularnewline
36 & 0.156354 & 1.1908 & 0.1193 \tabularnewline
\hline
\end{tabular}
%Source: https://freestatistics.org/blog/index.php?pk=67547&T=1

[TABLE]
[ROW][C]Autocorrelation Function[/C][/ROW]
[ROW][C]Time lag k[/C][C]ACF(k)[/C][C]T-STAT[/C][C]P-value[/C][/ROW]
[ROW][C]1[/C][C]-0.322076[/C][C]-2.4529[/C][C]0.0086[/C][/ROW]
[ROW][C]2[/C][C]-0.290326[/C][C]-2.2111[/C][C]0.015494[/C][/ROW]
[ROW][C]3[/C][C]0.150722[/C][C]1.1479[/C][C]0.127869[/C][/ROW]
[ROW][C]4[/C][C]0.094362[/C][C]0.7186[/C][C]0.237623[/C][/ROW]
[ROW][C]5[/C][C]-0.11169[/C][C]-0.8506[/C][C]0.199244[/C][/ROW]
[ROW][C]6[/C][C]0.150809[/C][C]1.1485[/C][C]0.127733[/C][/ROW]
[ROW][C]7[/C][C]-0.269987[/C][C]-2.0562[/C][C]0.022138[/C][/ROW]
[ROW][C]8[/C][C]0.276662[/C][C]2.107[/C][C]0.019727[/C][/ROW]
[ROW][C]9[/C][C]-0.035236[/C][C]-0.2683[/C][C]0.394692[/C][/ROW]
[ROW][C]10[/C][C]-0.283073[/C][C]-2.1558[/C][C]0.017629[/C][/ROW]
[ROW][C]11[/C][C]-0.069146[/C][C]-0.5266[/C][C]0.30024[/C][/ROW]
[ROW][C]12[/C][C]0.48426[/C][C]3.688[/C][C]0.00025[/C][/ROW]
[ROW][C]13[/C][C]-0.143033[/C][C]-1.0893[/C][C]0.140262[/C][/ROW]
[ROW][C]14[/C][C]-0.213384[/C][C]-1.6251[/C][C]0.054783[/C][/ROW]
[ROW][C]15[/C][C]-0.004658[/C][C]-0.0355[/C][C]0.485911[/C][/ROW]
[ROW][C]16[/C][C]0.215577[/C][C]1.6418[/C][C]0.053023[/C][/ROW]
[ROW][C]17[/C][C]-0.119529[/C][C]-0.9103[/C][C]0.183215[/C][/ROW]
[ROW][C]18[/C][C]-0.018822[/C][C]-0.1433[/C][C]0.443256[/C][/ROW]
[ROW][C]19[/C][C]0.032701[/C][C]0.249[/C][C]0.402105[/C][/ROW]
[ROW][C]20[/C][C]0.098723[/C][C]0.7519[/C][C]0.22759[/C][/ROW]
[ROW][C]21[/C][C]-0.100812[/C][C]-0.7678[/C][C]0.222871[/C][/ROW]
[ROW][C]22[/C][C]-0.080915[/C][C]-0.6162[/C][C]0.270078[/C][/ROW]
[ROW][C]23[/C][C]-0.046701[/C][C]-0.3557[/C][C]0.361692[/C][/ROW]
[ROW][C]24[/C][C]0.208425[/C][C]1.5873[/C][C]0.058939[/C][/ROW]
[ROW][C]25[/C][C]0.064642[/C][C]0.4923[/C][C]0.312183[/C][/ROW]
[ROW][C]26[/C][C]-0.2625[/C][C]-1.9991[/C][C]0.025143[/C][/ROW]
[ROW][C]27[/C][C]0.000741[/C][C]0.0056[/C][C]0.497759[/C][/ROW]
[ROW][C]28[/C][C]0.22305[/C][C]1.6987[/C][C]0.047367[/C][/ROW]
[ROW][C]29[/C][C]-0.126254[/C][C]-0.9615[/C][C]0.17014[/C][/ROW]
[ROW][C]30[/C][C]-0.053904[/C][C]-0.4105[/C][C]0.341468[/C][/ROW]
[ROW][C]31[/C][C]0.174543[/C][C]1.3293[/C][C]0.094481[/C][/ROW]
[ROW][C]32[/C][C]-0.104083[/C][C]-0.7927[/C][C]0.2156[/C][/ROW]
[ROW][C]33[/C][C]-0.02956[/C][C]-0.2251[/C][C]0.411338[/C][/ROW]
[ROW][C]34[/C][C]0.046196[/C][C]0.3518[/C][C]0.363124[/C][/ROW]
[ROW][C]35[/C][C]-0.134916[/C][C]-1.0275[/C][C]0.154228[/C][/ROW]
[ROW][C]36[/C][C]0.156354[/C][C]1.1908[/C][C]0.1193[/C][/ROW]
[/TABLE]
Source: https://freestatistics.org/blog/index.php?pk=67547&T=1

Globally Unique Identifier (entire table): ba.freestatistics.org/blog/index.php?pk=67547&T=1

As an alternative you can also use a QR Code:  

The GUIDs for individual cells are displayed in the table below:

Autocorrelation Function
Time lag kACF(k)T-STATP-value
1-0.322076-2.45290.0086
2-0.290326-2.21110.015494
30.1507221.14790.127869
40.0943620.71860.237623
5-0.11169-0.85060.199244
60.1508091.14850.127733
7-0.269987-2.05620.022138
80.2766622.1070.019727
9-0.035236-0.26830.394692
10-0.283073-2.15580.017629
11-0.069146-0.52660.30024
120.484263.6880.00025
13-0.143033-1.08930.140262
14-0.213384-1.62510.054783
15-0.004658-0.03550.485911
160.2155771.64180.053023
17-0.119529-0.91030.183215
18-0.018822-0.14330.443256
190.0327010.2490.402105
200.0987230.75190.22759
21-0.100812-0.76780.222871
22-0.080915-0.61620.270078
23-0.046701-0.35570.361692
240.2084251.58730.058939
250.0646420.49230.312183
26-0.2625-1.99910.025143
270.0007410.00560.497759
280.223051.69870.047367
29-0.126254-0.96150.17014
30-0.053904-0.41050.341468
310.1745431.32930.094481
32-0.104083-0.79270.2156
33-0.02956-0.22510.411338
340.0461960.35180.363124
35-0.134916-1.02750.154228
360.1563541.19080.1193


Partial Autocorrelation Function
Time lag kPACF(k)T-STATP-value
1-0.322076-2.45290.0086
2-0.439667-3.34840.000716
3-0.173584-1.3220.095683
4-0.04445-0.33850.368097
5-0.071163-0.5420.29496
60.187191.42560.079673
7-0.245402-1.86890.033343
80.2506561.90890.030611
9-0.03393-0.25840.398505
10-0.217436-1.65590.051567
11-0.407219-3.10130.001487
120.133991.02040.155879
130.2134081.62530.054764
14-0.034372-0.26180.397212
15-0.062954-0.47940.316712
160.029570.22520.411307
17-0.052664-0.40110.344918
18-0.157112-1.19650.118179
190.1424991.08520.141153
20-0.011607-0.08840.464934
21-0.114832-0.87450.192717
22-0.008722-0.06640.473634
230.0624660.47570.318027
24-0.168826-1.28570.101822
250.0492280.37490.354548
260.0255650.19470.423155
27-0.02898-0.22070.413049
28-0.056529-0.43050.33421
290.0665210.50660.307175
300.0305390.23260.408455
310.0137170.10450.458579
32-0.082658-0.62950.265744
33-0.045403-0.34580.365379
340.0766040.58340.280944
35-0.142109-1.08230.141806
360.048460.36910.356714

\begin{tabular}{lllllllll}
\hline
Partial Autocorrelation Function \tabularnewline
Time lag k & PACF(k) & T-STAT & P-value \tabularnewline
1 & -0.322076 & -2.4529 & 0.0086 \tabularnewline
2 & -0.439667 & -3.3484 & 0.000716 \tabularnewline
3 & -0.173584 & -1.322 & 0.095683 \tabularnewline
4 & -0.04445 & -0.3385 & 0.368097 \tabularnewline
5 & -0.071163 & -0.542 & 0.29496 \tabularnewline
6 & 0.18719 & 1.4256 & 0.079673 \tabularnewline
7 & -0.245402 & -1.8689 & 0.033343 \tabularnewline
8 & 0.250656 & 1.9089 & 0.030611 \tabularnewline
9 & -0.03393 & -0.2584 & 0.398505 \tabularnewline
10 & -0.217436 & -1.6559 & 0.051567 \tabularnewline
11 & -0.407219 & -3.1013 & 0.001487 \tabularnewline
12 & 0.13399 & 1.0204 & 0.155879 \tabularnewline
13 & 0.213408 & 1.6253 & 0.054764 \tabularnewline
14 & -0.034372 & -0.2618 & 0.397212 \tabularnewline
15 & -0.062954 & -0.4794 & 0.316712 \tabularnewline
16 & 0.02957 & 0.2252 & 0.411307 \tabularnewline
17 & -0.052664 & -0.4011 & 0.344918 \tabularnewline
18 & -0.157112 & -1.1965 & 0.118179 \tabularnewline
19 & 0.142499 & 1.0852 & 0.141153 \tabularnewline
20 & -0.011607 & -0.0884 & 0.464934 \tabularnewline
21 & -0.114832 & -0.8745 & 0.192717 \tabularnewline
22 & -0.008722 & -0.0664 & 0.473634 \tabularnewline
23 & 0.062466 & 0.4757 & 0.318027 \tabularnewline
24 & -0.168826 & -1.2857 & 0.101822 \tabularnewline
25 & 0.049228 & 0.3749 & 0.354548 \tabularnewline
26 & 0.025565 & 0.1947 & 0.423155 \tabularnewline
27 & -0.02898 & -0.2207 & 0.413049 \tabularnewline
28 & -0.056529 & -0.4305 & 0.33421 \tabularnewline
29 & 0.066521 & 0.5066 & 0.307175 \tabularnewline
30 & 0.030539 & 0.2326 & 0.408455 \tabularnewline
31 & 0.013717 & 0.1045 & 0.458579 \tabularnewline
32 & -0.082658 & -0.6295 & 0.265744 \tabularnewline
33 & -0.045403 & -0.3458 & 0.365379 \tabularnewline
34 & 0.076604 & 0.5834 & 0.280944 \tabularnewline
35 & -0.142109 & -1.0823 & 0.141806 \tabularnewline
36 & 0.04846 & 0.3691 & 0.356714 \tabularnewline
\hline
\end{tabular}
%Source: https://freestatistics.org/blog/index.php?pk=67547&T=2

[TABLE]
[ROW][C]Partial Autocorrelation Function[/C][/ROW]
[ROW][C]Time lag k[/C][C]PACF(k)[/C][C]T-STAT[/C][C]P-value[/C][/ROW]
[ROW][C]1[/C][C]-0.322076[/C][C]-2.4529[/C][C]0.0086[/C][/ROW]
[ROW][C]2[/C][C]-0.439667[/C][C]-3.3484[/C][C]0.000716[/C][/ROW]
[ROW][C]3[/C][C]-0.173584[/C][C]-1.322[/C][C]0.095683[/C][/ROW]
[ROW][C]4[/C][C]-0.04445[/C][C]-0.3385[/C][C]0.368097[/C][/ROW]
[ROW][C]5[/C][C]-0.071163[/C][C]-0.542[/C][C]0.29496[/C][/ROW]
[ROW][C]6[/C][C]0.18719[/C][C]1.4256[/C][C]0.079673[/C][/ROW]
[ROW][C]7[/C][C]-0.245402[/C][C]-1.8689[/C][C]0.033343[/C][/ROW]
[ROW][C]8[/C][C]0.250656[/C][C]1.9089[/C][C]0.030611[/C][/ROW]
[ROW][C]9[/C][C]-0.03393[/C][C]-0.2584[/C][C]0.398505[/C][/ROW]
[ROW][C]10[/C][C]-0.217436[/C][C]-1.6559[/C][C]0.051567[/C][/ROW]
[ROW][C]11[/C][C]-0.407219[/C][C]-3.1013[/C][C]0.001487[/C][/ROW]
[ROW][C]12[/C][C]0.13399[/C][C]1.0204[/C][C]0.155879[/C][/ROW]
[ROW][C]13[/C][C]0.213408[/C][C]1.6253[/C][C]0.054764[/C][/ROW]
[ROW][C]14[/C][C]-0.034372[/C][C]-0.2618[/C][C]0.397212[/C][/ROW]
[ROW][C]15[/C][C]-0.062954[/C][C]-0.4794[/C][C]0.316712[/C][/ROW]
[ROW][C]16[/C][C]0.02957[/C][C]0.2252[/C][C]0.411307[/C][/ROW]
[ROW][C]17[/C][C]-0.052664[/C][C]-0.4011[/C][C]0.344918[/C][/ROW]
[ROW][C]18[/C][C]-0.157112[/C][C]-1.1965[/C][C]0.118179[/C][/ROW]
[ROW][C]19[/C][C]0.142499[/C][C]1.0852[/C][C]0.141153[/C][/ROW]
[ROW][C]20[/C][C]-0.011607[/C][C]-0.0884[/C][C]0.464934[/C][/ROW]
[ROW][C]21[/C][C]-0.114832[/C][C]-0.8745[/C][C]0.192717[/C][/ROW]
[ROW][C]22[/C][C]-0.008722[/C][C]-0.0664[/C][C]0.473634[/C][/ROW]
[ROW][C]23[/C][C]0.062466[/C][C]0.4757[/C][C]0.318027[/C][/ROW]
[ROW][C]24[/C][C]-0.168826[/C][C]-1.2857[/C][C]0.101822[/C][/ROW]
[ROW][C]25[/C][C]0.049228[/C][C]0.3749[/C][C]0.354548[/C][/ROW]
[ROW][C]26[/C][C]0.025565[/C][C]0.1947[/C][C]0.423155[/C][/ROW]
[ROW][C]27[/C][C]-0.02898[/C][C]-0.2207[/C][C]0.413049[/C][/ROW]
[ROW][C]28[/C][C]-0.056529[/C][C]-0.4305[/C][C]0.33421[/C][/ROW]
[ROW][C]29[/C][C]0.066521[/C][C]0.5066[/C][C]0.307175[/C][/ROW]
[ROW][C]30[/C][C]0.030539[/C][C]0.2326[/C][C]0.408455[/C][/ROW]
[ROW][C]31[/C][C]0.013717[/C][C]0.1045[/C][C]0.458579[/C][/ROW]
[ROW][C]32[/C][C]-0.082658[/C][C]-0.6295[/C][C]0.265744[/C][/ROW]
[ROW][C]33[/C][C]-0.045403[/C][C]-0.3458[/C][C]0.365379[/C][/ROW]
[ROW][C]34[/C][C]0.076604[/C][C]0.5834[/C][C]0.280944[/C][/ROW]
[ROW][C]35[/C][C]-0.142109[/C][C]-1.0823[/C][C]0.141806[/C][/ROW]
[ROW][C]36[/C][C]0.04846[/C][C]0.3691[/C][C]0.356714[/C][/ROW]
[/TABLE]
Source: https://freestatistics.org/blog/index.php?pk=67547&T=2

Globally Unique Identifier (entire table): ba.freestatistics.org/blog/index.php?pk=67547&T=2

As an alternative you can also use a QR Code:  

The GUIDs for individual cells are displayed in the table below:

Partial Autocorrelation Function
Time lag kPACF(k)T-STATP-value
1-0.322076-2.45290.0086
2-0.439667-3.34840.000716
3-0.173584-1.3220.095683
4-0.04445-0.33850.368097
5-0.071163-0.5420.29496
60.187191.42560.079673
7-0.245402-1.86890.033343
80.2506561.90890.030611
9-0.03393-0.25840.398505
10-0.217436-1.65590.051567
11-0.407219-3.10130.001487
120.133991.02040.155879
130.2134081.62530.054764
14-0.034372-0.26180.397212
15-0.062954-0.47940.316712
160.029570.22520.411307
17-0.052664-0.40110.344918
18-0.157112-1.19650.118179
190.1424991.08520.141153
20-0.011607-0.08840.464934
21-0.114832-0.87450.192717
22-0.008722-0.06640.473634
230.0624660.47570.318027
24-0.168826-1.28570.101822
250.0492280.37490.354548
260.0255650.19470.423155
27-0.02898-0.22070.413049
28-0.056529-0.43050.33421
290.0665210.50660.307175
300.0305390.23260.408455
310.0137170.10450.458579
32-0.082658-0.62950.265744
33-0.045403-0.34580.365379
340.0766040.58340.280944
35-0.142109-1.08230.141806
360.048460.36910.356714


Parameters (Session):
par1 = 36 ; par2 = 1 ; par3 = 1 ; par4 = 0 ; par5 = 12 ; par6 = White Noise ; par7 = 0.95 ;
Parameters (R input):
par1 = 36 ; par2 = 1 ; par3 = 1 ; par4 = 0 ; par5 = 12 ; par6 = White Noise ; par7 = 0.95 ;
R code (references can be found in the software module):
if (par1 == 'Default') {
par1 = 10*log10(length(x))
} else {
par1 <- as.numeric(par1)
}
par2 <- as.numeric(par2)
par3 <- as.numeric(par3)
par4 <- as.numeric(par4)
par5 <- as.numeric(par5)
if (par6 == 'White Noise') par6 <- 'white' else par6 <- 'ma'
par7 <- as.numeric(par7)
if (par2 == 0) {
x <- log(x)
} else {
x <- (x ^ par2 - 1) / par2
}
if (par3 > 0) x <- diff(x,lag=1,difference=par3)
if (par4 > 0) x <- diff(x,lag=par5,difference=par4)
bitmap(file='pic1.png')
racf <- acf(x, par1, main='Autocorrelation', xlab='time lag', ylab='ACF', ci.type=par6, ci=par7, sub=paste('(lambda=',par2,', d=',par3,', D=',par4,', CI=', par7, ', CI type=',par6,')',sep=''))
dev.off()
bitmap(file='pic2.png')
rpacf <- pacf(x,par1,main='Partial Autocorrelation',xlab='lags',ylab='PACF')
dev.off()
(myacf <- c(racf$acf))
(mypacf <- c(rpacf$acf))
lengthx <- length(x)
sqrtn <- sqrt(lengthx)
load(file='createtable')
a<-table.start()
a<-table.row.start(a)
a<-table.element(a,'Autocorrelation Function',4,TRUE)
a<-table.row.end(a)
a<-table.row.start(a)
a<-table.element(a,'Time lag k',header=TRUE)
a<-table.element(a,hyperlink('basics.htm','ACF(k)','click here for more information about the Autocorrelation Function'),header=TRUE)
a<-table.element(a,'T-STAT',header=TRUE)
a<-table.element(a,'P-value',header=TRUE)
a<-table.row.end(a)
for (i in 2:(par1+1)) {
a<-table.row.start(a)
a<-table.element(a,i-1,header=TRUE)
a<-table.element(a,round(myacf[i],6))
mytstat <- myacf[i]*sqrtn
a<-table.element(a,round(mytstat,4))
a<-table.element(a,round(1-pt(abs(mytstat),lengthx),6))
a<-table.row.end(a)
}
a<-table.end(a)
table.save(a,file='mytable.tab')
a<-table.start()
a<-table.row.start(a)
a<-table.element(a,'Partial Autocorrelation Function',4,TRUE)
a<-table.row.end(a)
a<-table.row.start(a)
a<-table.element(a,'Time lag k',header=TRUE)
a<-table.element(a,hyperlink('basics.htm','PACF(k)','click here for more information about the Partial Autocorrelation Function'),header=TRUE)
a<-table.element(a,'T-STAT',header=TRUE)
a<-table.element(a,'P-value',header=TRUE)
a<-table.row.end(a)
for (i in 1:par1) {
a<-table.row.start(a)
a<-table.element(a,i,header=TRUE)
a<-table.element(a,round(mypacf[i],6))
mytstat <- mypacf[i]*sqrtn
a<-table.element(a,round(mytstat,4))
a<-table.element(a,round(1-pt(abs(mytstat),lengthx),6))
a<-table.row.end(a)
}
a<-table.end(a)
table.save(a,file='mytable1.tab')