Free Statistics

of Irreproducible Research!

Author's title

Author*The author of this computation has been verified*
R Software Modulerwasp_multipleregression.wasp
Title produced by softwareMultiple Regression
Date of computationMon, 14 Dec 2009 12:53:55 -0700
Cite this page as followsStatistical Computations at FreeStatistics.org, Office for Research Development and Education, URL https://freestatistics.org/blog/index.php?v=date/2009/Dec/14/t12608204644l09yzvk59h7t43.htm/, Retrieved Thu, 02 May 2024 05:33:31 +0000
Statistical Computations at FreeStatistics.org, Office for Research Development and Education, URL https://freestatistics.org/blog/index.php?pk=67649, Retrieved Thu, 02 May 2024 05:33:31 +0000
QR Codes:

Original text written by user:
IsPrivate?No (this computation is public)
User-defined keywords
Estimated Impact108
Family? (F = Feedback message, R = changed R code, M = changed R Module, P = changed Parameters, D = changed Data)
-     [Multiple Regression] [Q1 The Seatbeltlaw] [2007-11-14 19:27:43] [8cd6641b921d30ebe00b648d1481bba0]
- RMPD  [Multiple Regression] [Seatbelt] [2009-11-12 14:03:14] [b98453cac15ba1066b407e146608df68]
-   PD    [Multiple Regression] [] [2009-11-19 10:25:48] [d181e5359f7da6c8509e4702d1229fb0]
-    D      [Multiple Regression] [multiple regressi...] [2009-11-20 19:14:20] [34d27ebe78dc2d31581e8710befe8733]
-    D          [Multiple Regression] [multiple regressi...] [2009-12-14 19:53:55] [371dc2189c569d90e2c1567f632c3ec0] [Current]
Feedback Forum

Post a new message
Dataseries X:
455	1802	462	452	449	441
461	1863	455	462	452	449
461	1989	461	455	462	452
463	2197	461	461	455	462
462	2409	463	461	461	455
456	2502	462	463	461	461
455	2593	456	462	463	461
456	2598	455	456	462	463
472	2053	456	455	456	462
472	2213	472	456	455	456
471	2238	472	472	456	455
465	2359	471	472	472	456
459	2151	465	471	472	472
465	2474	459	465	471	472
468	3079	465	459	465	471
467	2312	468	465	459	465
463	2565	467	468	465	459
460	1972	463	467	468	465
462	2484	460	463	467	468
461	2202	462	460	463	467
476	2151	461	462	460	463
476	1976	476	461	462	460
471	2012	476	476	461	462
453	2114	471	476	476	461
443	1772	453	471	476	476
442	1957	443	453	471	476
444	2070	442	443	453	471
438	1990	444	442	443	453
427	2182	438	444	442	443
424	2008	427	438	444	442
416	1916	424	427	438	444
406	2397	416	424	427	438
431	2114	406	416	424	427
434	1778	431	406	416	424
418	1641	434	431	406	416
412	2186	418	434	431	406
404	1773	412	418	434	431
409	1785	404	412	418	434
412	2217	409	404	412	418
406	2153	412	409	404	412
398	1895	406	412	409	404
397	2475	398	406	412	409
385	1793	397	398	406	412
390	2308	385	397	398	406
413	2051	390	385	397	398
413	1898	413	390	385	397
401	2142	413	413	390	385
397	1874	401	413	413	390
397	1560	397	401	413	413
409	1808	397	397	401	413
419	1575	409	397	397	401
424	1525	419	409	397	397
428	1997	424	419	409	397
430	1753	428	424	419	409
424	1623	430	428	424	419
433	2251	424	430	428	424
456	1890	433	424	430	428


Summary of computational transaction
Raw Inputview raw input (R code)
Raw Outputview raw output of R engine
Computing time4 seconds
R Server'Gwilym Jenkins' @ 72.249.127.135

\begin{tabular}{lllllllll}
\hline
Summary of computational transaction \tabularnewline
Raw Input & view raw input (R code)  \tabularnewline
Raw Output & view raw output of R engine  \tabularnewline
Computing time & 4 seconds \tabularnewline
R Server & 'Gwilym Jenkins' @ 72.249.127.135 \tabularnewline
\hline
\end{tabular}
%Source: https://freestatistics.org/blog/index.php?pk=67649&T=0

[TABLE]
[ROW][C]Summary of computational transaction[/C][/ROW]
[ROW][C]Raw Input[/C][C]view raw input (R code) [/C][/ROW]
[ROW][C]Raw Output[/C][C]view raw output of R engine [/C][/ROW]
[ROW][C]Computing time[/C][C]4 seconds[/C][/ROW]
[ROW][C]R Server[/C][C]'Gwilym Jenkins' @ 72.249.127.135[/C][/ROW]
[/TABLE]
Source: https://freestatistics.org/blog/index.php?pk=67649&T=0

Globally Unique Identifier (entire table): ba.freestatistics.org/blog/index.php?pk=67649&T=0

As an alternative you can also use a QR Code:  

The GUIDs for individual cells are displayed in the table below:

Summary of computational transaction
Raw Inputview raw input (R code)
Raw Outputview raw output of R engine
Computing time4 seconds
R Server'Gwilym Jenkins' @ 72.249.127.135


Multiple Linear Regression - Estimated Regression Equation
wkl[t] = -17.3691385226585 + 0.00407364554764026bvg[t] + 1.10516982971292Y1[t] -0.0940382526645915Y2[t] + 0.289524027067878Y3[t] -0.317759264859482Y4[t] + 9.29743613448183M1[t] + 23.0351035992936M2[t] + 18.3512500276087M3[t] + 14.5008375862024M4[t] + 7.78279725801128M5[t] + 10.8214637131233M6[t] + 9.53156919044552M7[t] + 15.2481682777225M8[t] + 34.7976956423727M9[t] + 14.6136201071320M10[t] + 5.74174285239308M11[t] + 0.081710785331368t + e[t]

\begin{tabular}{lllllllll}
\hline
Multiple Linear Regression - Estimated Regression Equation \tabularnewline
wkl[t] =  -17.3691385226585 +  0.00407364554764026bvg[t] +  1.10516982971292Y1[t] -0.0940382526645915Y2[t] +  0.289524027067878Y3[t] -0.317759264859482Y4[t] +  9.29743613448183M1[t] +  23.0351035992936M2[t] +  18.3512500276087M3[t] +  14.5008375862024M4[t] +  7.78279725801128M5[t] +  10.8214637131233M6[t] +  9.53156919044552M7[t] +  15.2481682777225M8[t] +  34.7976956423727M9[t] +  14.6136201071320M10[t] +  5.74174285239308M11[t] +  0.081710785331368t  + e[t] \tabularnewline
\hline
\end{tabular}
%Source: https://freestatistics.org/blog/index.php?pk=67649&T=1

[TABLE]
[ROW][C]Multiple Linear Regression - Estimated Regression Equation[/C][/ROW]
[ROW][C]wkl[t] =  -17.3691385226585 +  0.00407364554764026bvg[t] +  1.10516982971292Y1[t] -0.0940382526645915Y2[t] +  0.289524027067878Y3[t] -0.317759264859482Y4[t] +  9.29743613448183M1[t] +  23.0351035992936M2[t] +  18.3512500276087M3[t] +  14.5008375862024M4[t] +  7.78279725801128M5[t] +  10.8214637131233M6[t] +  9.53156919044552M7[t] +  15.2481682777225M8[t] +  34.7976956423727M9[t] +  14.6136201071320M10[t] +  5.74174285239308M11[t] +  0.081710785331368t  + e[t][/C][/ROW]
[/TABLE]
Source: https://freestatistics.org/blog/index.php?pk=67649&T=1

Globally Unique Identifier (entire table): ba.freestatistics.org/blog/index.php?pk=67649&T=1

As an alternative you can also use a QR Code:  

The GUIDs for individual cells are displayed in the table below:

Multiple Linear Regression - Estimated Regression Equation
wkl[t] = -17.3691385226585 + 0.00407364554764026bvg[t] + 1.10516982971292Y1[t] -0.0940382526645915Y2[t] + 0.289524027067878Y3[t] -0.317759264859482Y4[t] + 9.29743613448183M1[t] + 23.0351035992936M2[t] + 18.3512500276087M3[t] + 14.5008375862024M4[t] + 7.78279725801128M5[t] + 10.8214637131233M6[t] + 9.53156919044552M7[t] + 15.2481682777225M8[t] + 34.7976956423727M9[t] + 14.6136201071320M10[t] + 5.74174285239308M11[t] + 0.081710785331368t + e[t]


Multiple Linear Regression - Ordinary Least Squares
VariableParameterS.D.T-STATH0: parameter = 02-tail p-value1-tail p-value
(Intercept)-17.369138522658522.861144-0.75980.4519620.225981
bvg0.004073645547640260.0030081.35410.1834990.09175
Y11.105169829712920.1352728.1700
Y2-0.09403825266459150.20943-0.4490.6559020.327951
Y30.2895240270678780.2130591.35890.1819890.090994
Y4-0.3177592648594820.13335-2.38290.0221460.011073
M19.297436134481834.1606212.23460.0312430.015622
M223.03510359929364.676324.92591.6e-058e-06
M318.35125002760875.0753413.61580.0008470.000424
M414.50083758620245.1889282.79460.0080190.004009
M57.782797258011283.9470561.97180.0557560.027878
M610.82146371312333.8970962.77680.0083930.004196
M79.531569190445524.3230332.20480.0334310.016715
M815.24816827772254.5391363.35930.0017570.000878
M934.79769564237274.5406957.663500
M1014.61362010713206.2273252.34670.0241140.012057
M115.741742852393085.5102171.0420.303820.15191
t0.0817107853313680.0762141.07210.2902540.145127

\begin{tabular}{lllllllll}
\hline
Multiple Linear Regression - Ordinary Least Squares \tabularnewline
Variable & Parameter & S.D. & T-STATH0: parameter = 0 & 2-tail p-value & 1-tail p-value \tabularnewline
(Intercept) & -17.3691385226585 & 22.861144 & -0.7598 & 0.451962 & 0.225981 \tabularnewline
bvg & 0.00407364554764026 & 0.003008 & 1.3541 & 0.183499 & 0.09175 \tabularnewline
Y1 & 1.10516982971292 & 0.135272 & 8.17 & 0 & 0 \tabularnewline
Y2 & -0.0940382526645915 & 0.20943 & -0.449 & 0.655902 & 0.327951 \tabularnewline
Y3 & 0.289524027067878 & 0.213059 & 1.3589 & 0.181989 & 0.090994 \tabularnewline
Y4 & -0.317759264859482 & 0.13335 & -2.3829 & 0.022146 & 0.011073 \tabularnewline
M1 & 9.29743613448183 & 4.160621 & 2.2346 & 0.031243 & 0.015622 \tabularnewline
M2 & 23.0351035992936 & 4.67632 & 4.9259 & 1.6e-05 & 8e-06 \tabularnewline
M3 & 18.3512500276087 & 5.075341 & 3.6158 & 0.000847 & 0.000424 \tabularnewline
M4 & 14.5008375862024 & 5.188928 & 2.7946 & 0.008019 & 0.004009 \tabularnewline
M5 & 7.78279725801128 & 3.947056 & 1.9718 & 0.055756 & 0.027878 \tabularnewline
M6 & 10.8214637131233 & 3.897096 & 2.7768 & 0.008393 & 0.004196 \tabularnewline
M7 & 9.53156919044552 & 4.323033 & 2.2048 & 0.033431 & 0.016715 \tabularnewline
M8 & 15.2481682777225 & 4.539136 & 3.3593 & 0.001757 & 0.000878 \tabularnewline
M9 & 34.7976956423727 & 4.540695 & 7.6635 & 0 & 0 \tabularnewline
M10 & 14.6136201071320 & 6.227325 & 2.3467 & 0.024114 & 0.012057 \tabularnewline
M11 & 5.74174285239308 & 5.510217 & 1.042 & 0.30382 & 0.15191 \tabularnewline
t & 0.081710785331368 & 0.076214 & 1.0721 & 0.290254 & 0.145127 \tabularnewline
\hline
\end{tabular}
%Source: https://freestatistics.org/blog/index.php?pk=67649&T=2

[TABLE]
[ROW][C]Multiple Linear Regression - Ordinary Least Squares[/C][/ROW]
[ROW][C]Variable[/C][C]Parameter[/C][C]S.D.[/C][C]T-STATH0: parameter = 0[/C][C]2-tail p-value[/C][C]1-tail p-value[/C][/ROW]
[ROW][C](Intercept)[/C][C]-17.3691385226585[/C][C]22.861144[/C][C]-0.7598[/C][C]0.451962[/C][C]0.225981[/C][/ROW]
[ROW][C]bvg[/C][C]0.00407364554764026[/C][C]0.003008[/C][C]1.3541[/C][C]0.183499[/C][C]0.09175[/C][/ROW]
[ROW][C]Y1[/C][C]1.10516982971292[/C][C]0.135272[/C][C]8.17[/C][C]0[/C][C]0[/C][/ROW]
[ROW][C]Y2[/C][C]-0.0940382526645915[/C][C]0.20943[/C][C]-0.449[/C][C]0.655902[/C][C]0.327951[/C][/ROW]
[ROW][C]Y3[/C][C]0.289524027067878[/C][C]0.213059[/C][C]1.3589[/C][C]0.181989[/C][C]0.090994[/C][/ROW]
[ROW][C]Y4[/C][C]-0.317759264859482[/C][C]0.13335[/C][C]-2.3829[/C][C]0.022146[/C][C]0.011073[/C][/ROW]
[ROW][C]M1[/C][C]9.29743613448183[/C][C]4.160621[/C][C]2.2346[/C][C]0.031243[/C][C]0.015622[/C][/ROW]
[ROW][C]M2[/C][C]23.0351035992936[/C][C]4.67632[/C][C]4.9259[/C][C]1.6e-05[/C][C]8e-06[/C][/ROW]
[ROW][C]M3[/C][C]18.3512500276087[/C][C]5.075341[/C][C]3.6158[/C][C]0.000847[/C][C]0.000424[/C][/ROW]
[ROW][C]M4[/C][C]14.5008375862024[/C][C]5.188928[/C][C]2.7946[/C][C]0.008019[/C][C]0.004009[/C][/ROW]
[ROW][C]M5[/C][C]7.78279725801128[/C][C]3.947056[/C][C]1.9718[/C][C]0.055756[/C][C]0.027878[/C][/ROW]
[ROW][C]M6[/C][C]10.8214637131233[/C][C]3.897096[/C][C]2.7768[/C][C]0.008393[/C][C]0.004196[/C][/ROW]
[ROW][C]M7[/C][C]9.53156919044552[/C][C]4.323033[/C][C]2.2048[/C][C]0.033431[/C][C]0.016715[/C][/ROW]
[ROW][C]M8[/C][C]15.2481682777225[/C][C]4.539136[/C][C]3.3593[/C][C]0.001757[/C][C]0.000878[/C][/ROW]
[ROW][C]M9[/C][C]34.7976956423727[/C][C]4.540695[/C][C]7.6635[/C][C]0[/C][C]0[/C][/ROW]
[ROW][C]M10[/C][C]14.6136201071320[/C][C]6.227325[/C][C]2.3467[/C][C]0.024114[/C][C]0.012057[/C][/ROW]
[ROW][C]M11[/C][C]5.74174285239308[/C][C]5.510217[/C][C]1.042[/C][C]0.30382[/C][C]0.15191[/C][/ROW]
[ROW][C]t[/C][C]0.081710785331368[/C][C]0.076214[/C][C]1.0721[/C][C]0.290254[/C][C]0.145127[/C][/ROW]
[/TABLE]
Source: https://freestatistics.org/blog/index.php?pk=67649&T=2

Globally Unique Identifier (entire table): ba.freestatistics.org/blog/index.php?pk=67649&T=2

As an alternative you can also use a QR Code:  

The GUIDs for individual cells are displayed in the table below:

Multiple Linear Regression - Ordinary Least Squares
VariableParameterS.D.T-STATH0: parameter = 02-tail p-value1-tail p-value
(Intercept)-17.369138522658522.861144-0.75980.4519620.225981
bvg0.004073645547640260.0030081.35410.1834990.09175
Y11.105169829712920.1352728.1700
Y2-0.09403825266459150.20943-0.4490.6559020.327951
Y30.2895240270678780.2130591.35890.1819890.090994
Y4-0.3177592648594820.13335-2.38290.0221460.011073
M19.297436134481834.1606212.23460.0312430.015622
M223.03510359929364.676324.92591.6e-058e-06
M318.35125002760875.0753413.61580.0008470.000424
M414.50083758620245.1889282.79460.0080190.004009
M57.782797258011283.9470561.97180.0557560.027878
M610.82146371312333.8970962.77680.0083930.004196
M79.531569190445524.3230332.20480.0334310.016715
M815.24816827772254.5391363.35930.0017570.000878
M934.79769564237274.5406957.663500
M1014.61362010713206.2273252.34670.0241140.012057
M115.741742852393085.5102171.0420.303820.15191
t0.0817107853313680.0762141.07210.2902540.145127


Multiple Linear Regression - Regression Statistics
Multiple R0.9889469010895
R-squared0.978015973174527
Adjusted R-squared0.968433192250602
F-TEST (value)102.059723679253
F-TEST (DF numerator)17
F-TEST (DF denominator)39
p-value0
Multiple Linear Regression - Residual Statistics
Residual Standard Deviation4.75490825023572
Sum Squared Residuals881.756946258229

\begin{tabular}{lllllllll}
\hline
Multiple Linear Regression - Regression Statistics \tabularnewline
Multiple R & 0.9889469010895 \tabularnewline
R-squared & 0.978015973174527 \tabularnewline
Adjusted R-squared & 0.968433192250602 \tabularnewline
F-TEST (value) & 102.059723679253 \tabularnewline
F-TEST (DF numerator) & 17 \tabularnewline
F-TEST (DF denominator) & 39 \tabularnewline
p-value & 0 \tabularnewline
Multiple Linear Regression - Residual Statistics \tabularnewline
Residual Standard Deviation & 4.75490825023572 \tabularnewline
Sum Squared Residuals & 881.756946258229 \tabularnewline
\hline
\end{tabular}
%Source: https://freestatistics.org/blog/index.php?pk=67649&T=3

[TABLE]
[ROW][C]Multiple Linear Regression - Regression Statistics[/C][/ROW]
[ROW][C]Multiple R[/C][C]0.9889469010895[/C][/ROW]
[ROW][C]R-squared[/C][C]0.978015973174527[/C][/ROW]
[ROW][C]Adjusted R-squared[/C][C]0.968433192250602[/C][/ROW]
[ROW][C]F-TEST (value)[/C][C]102.059723679253[/C][/ROW]
[ROW][C]F-TEST (DF numerator)[/C][C]17[/C][/ROW]
[ROW][C]F-TEST (DF denominator)[/C][C]39[/C][/ROW]
[ROW][C]p-value[/C][C]0[/C][/ROW]
[ROW][C]Multiple Linear Regression - Residual Statistics[/C][/ROW]
[ROW][C]Residual Standard Deviation[/C][C]4.75490825023572[/C][/ROW]
[ROW][C]Sum Squared Residuals[/C][C]881.756946258229[/C][/ROW]
[/TABLE]
Source: https://freestatistics.org/blog/index.php?pk=67649&T=3

Globally Unique Identifier (entire table): ba.freestatistics.org/blog/index.php?pk=67649&T=3

As an alternative you can also use a QR Code:  

The GUIDs for individual cells are displayed in the table below:

Multiple Linear Regression - Regression Statistics
Multiple R0.9889469010895
R-squared0.978015973174527
Adjusted R-squared0.968433192250602
F-TEST (value)102.059723679253
F-TEST (DF numerator)17
F-TEST (DF denominator)39
p-value0
Multiple Linear Regression - Residual Statistics
Residual Standard Deviation4.75490825023572
Sum Squared Residuals881.756946258229


Multiple Linear Regression - Actuals, Interpolation, and Residuals
Time or IndexActualsInterpolationForecastResidualsPrediction Error
1455457.298341147422-2.29834114742237
2461461.016138403663-0.0161384036624990
3461466.158524179342-5.15852417934163
4463457.4686504431185.53134955688158
5462457.8677324322084.13226756779218
6456458.167156784383-2.16715678438277
7455451.3717421203943.62825787960555
8456455.7244373502290.275562649771210
9472472.915361861576-0.91536186157618
10472472.67049098412-0.670490984120429
11471463.0848369026987.91516309730226
12465461.1271712854143.87282871458585
13459458.0378709679540.962129032046447
14465466.816723240627-1.81672324062661
15468470.454999607313-2.45499960731271
16467466.4825032160990.517496783901395
17463463.133221160649-0.133221160649257
18460458.4733020172021.52669798279838
19462455.168666500126.83133349987969
20461461.470325902302-0.470325902301687
21476480.003026772546-4.00302677254582
22476477.391685598872-1.39168559887205
23471466.4125540224244.58744597757621
24453460.302804323534-7.30280432353444
25443444.099509821653-1.09950982165285
26442447.865882613603-5.86588261360346
27444439.9366383081424.06336169185815
28438440.970849417138-2.97084941713812
29427431.185632957345-4.18563295734549
30424422.901364580641.09863541935987
31416416.664654050956-0.664654050956333
32406414.58493484368-8.5849348436803
33431425.3907188601185.60928113988209
34434431.1263230537062.87367694629421
35418422.389454164993-4.38945416499253
36412411.4004202132860.599579786713967
37404406.895335045996-2.89533504599635
38409406.9008056933312.09919430666917
39412413.683637028784-1.68363702878363
40406412.089903656090-6.08990365608949
41398401.479134079882-3.47913407988245
42397397.964872373148-0.964872373147614
43385390.935176606929-5.93517660692864
44390385.2537776052954.74622239470486
45413412.7449471218810.255052878119127
46413413.811500363302-0.811500363301738
47401409.113154909886-8.11315490988594
48397394.1696041777652.83039582223463
49397391.6689430169755.33105698302512
50409403.4004500487775.59954995122339
51419413.766200876425.23379912357982
52424420.9880932675553.01190673244464
53428424.3342793699153.66572063008502
54430429.4933042446280.506695755372136
55424427.8597607216-3.85976072160027
56433428.9665242984944.03347570150591
57456456.945945383879-0.945945383879216

\begin{tabular}{lllllllll}
\hline
Multiple Linear Regression - Actuals, Interpolation, and Residuals \tabularnewline
Time or Index & Actuals & InterpolationForecast & ResidualsPrediction Error \tabularnewline
1 & 455 & 457.298341147422 & -2.29834114742237 \tabularnewline
2 & 461 & 461.016138403663 & -0.0161384036624990 \tabularnewline
3 & 461 & 466.158524179342 & -5.15852417934163 \tabularnewline
4 & 463 & 457.468650443118 & 5.53134955688158 \tabularnewline
5 & 462 & 457.867732432208 & 4.13226756779218 \tabularnewline
6 & 456 & 458.167156784383 & -2.16715678438277 \tabularnewline
7 & 455 & 451.371742120394 & 3.62825787960555 \tabularnewline
8 & 456 & 455.724437350229 & 0.275562649771210 \tabularnewline
9 & 472 & 472.915361861576 & -0.91536186157618 \tabularnewline
10 & 472 & 472.67049098412 & -0.670490984120429 \tabularnewline
11 & 471 & 463.084836902698 & 7.91516309730226 \tabularnewline
12 & 465 & 461.127171285414 & 3.87282871458585 \tabularnewline
13 & 459 & 458.037870967954 & 0.962129032046447 \tabularnewline
14 & 465 & 466.816723240627 & -1.81672324062661 \tabularnewline
15 & 468 & 470.454999607313 & -2.45499960731271 \tabularnewline
16 & 467 & 466.482503216099 & 0.517496783901395 \tabularnewline
17 & 463 & 463.133221160649 & -0.133221160649257 \tabularnewline
18 & 460 & 458.473302017202 & 1.52669798279838 \tabularnewline
19 & 462 & 455.16866650012 & 6.83133349987969 \tabularnewline
20 & 461 & 461.470325902302 & -0.470325902301687 \tabularnewline
21 & 476 & 480.003026772546 & -4.00302677254582 \tabularnewline
22 & 476 & 477.391685598872 & -1.39168559887205 \tabularnewline
23 & 471 & 466.412554022424 & 4.58744597757621 \tabularnewline
24 & 453 & 460.302804323534 & -7.30280432353444 \tabularnewline
25 & 443 & 444.099509821653 & -1.09950982165285 \tabularnewline
26 & 442 & 447.865882613603 & -5.86588261360346 \tabularnewline
27 & 444 & 439.936638308142 & 4.06336169185815 \tabularnewline
28 & 438 & 440.970849417138 & -2.97084941713812 \tabularnewline
29 & 427 & 431.185632957345 & -4.18563295734549 \tabularnewline
30 & 424 & 422.90136458064 & 1.09863541935987 \tabularnewline
31 & 416 & 416.664654050956 & -0.664654050956333 \tabularnewline
32 & 406 & 414.58493484368 & -8.5849348436803 \tabularnewline
33 & 431 & 425.390718860118 & 5.60928113988209 \tabularnewline
34 & 434 & 431.126323053706 & 2.87367694629421 \tabularnewline
35 & 418 & 422.389454164993 & -4.38945416499253 \tabularnewline
36 & 412 & 411.400420213286 & 0.599579786713967 \tabularnewline
37 & 404 & 406.895335045996 & -2.89533504599635 \tabularnewline
38 & 409 & 406.900805693331 & 2.09919430666917 \tabularnewline
39 & 412 & 413.683637028784 & -1.68363702878363 \tabularnewline
40 & 406 & 412.089903656090 & -6.08990365608949 \tabularnewline
41 & 398 & 401.479134079882 & -3.47913407988245 \tabularnewline
42 & 397 & 397.964872373148 & -0.964872373147614 \tabularnewline
43 & 385 & 390.935176606929 & -5.93517660692864 \tabularnewline
44 & 390 & 385.253777605295 & 4.74622239470486 \tabularnewline
45 & 413 & 412.744947121881 & 0.255052878119127 \tabularnewline
46 & 413 & 413.811500363302 & -0.811500363301738 \tabularnewline
47 & 401 & 409.113154909886 & -8.11315490988594 \tabularnewline
48 & 397 & 394.169604177765 & 2.83039582223463 \tabularnewline
49 & 397 & 391.668943016975 & 5.33105698302512 \tabularnewline
50 & 409 & 403.400450048777 & 5.59954995122339 \tabularnewline
51 & 419 & 413.76620087642 & 5.23379912357982 \tabularnewline
52 & 424 & 420.988093267555 & 3.01190673244464 \tabularnewline
53 & 428 & 424.334279369915 & 3.66572063008502 \tabularnewline
54 & 430 & 429.493304244628 & 0.506695755372136 \tabularnewline
55 & 424 & 427.8597607216 & -3.85976072160027 \tabularnewline
56 & 433 & 428.966524298494 & 4.03347570150591 \tabularnewline
57 & 456 & 456.945945383879 & -0.945945383879216 \tabularnewline
\hline
\end{tabular}
%Source: https://freestatistics.org/blog/index.php?pk=67649&T=4

[TABLE]
[ROW][C]Multiple Linear Regression - Actuals, Interpolation, and Residuals[/C][/ROW]
[ROW][C]Time or Index[/C][C]Actuals[/C][C]InterpolationForecast[/C][C]ResidualsPrediction Error[/C][/ROW]
[ROW][C]1[/C][C]455[/C][C]457.298341147422[/C][C]-2.29834114742237[/C][/ROW]
[ROW][C]2[/C][C]461[/C][C]461.016138403663[/C][C]-0.0161384036624990[/C][/ROW]
[ROW][C]3[/C][C]461[/C][C]466.158524179342[/C][C]-5.15852417934163[/C][/ROW]
[ROW][C]4[/C][C]463[/C][C]457.468650443118[/C][C]5.53134955688158[/C][/ROW]
[ROW][C]5[/C][C]462[/C][C]457.867732432208[/C][C]4.13226756779218[/C][/ROW]
[ROW][C]6[/C][C]456[/C][C]458.167156784383[/C][C]-2.16715678438277[/C][/ROW]
[ROW][C]7[/C][C]455[/C][C]451.371742120394[/C][C]3.62825787960555[/C][/ROW]
[ROW][C]8[/C][C]456[/C][C]455.724437350229[/C][C]0.275562649771210[/C][/ROW]
[ROW][C]9[/C][C]472[/C][C]472.915361861576[/C][C]-0.91536186157618[/C][/ROW]
[ROW][C]10[/C][C]472[/C][C]472.67049098412[/C][C]-0.670490984120429[/C][/ROW]
[ROW][C]11[/C][C]471[/C][C]463.084836902698[/C][C]7.91516309730226[/C][/ROW]
[ROW][C]12[/C][C]465[/C][C]461.127171285414[/C][C]3.87282871458585[/C][/ROW]
[ROW][C]13[/C][C]459[/C][C]458.037870967954[/C][C]0.962129032046447[/C][/ROW]
[ROW][C]14[/C][C]465[/C][C]466.816723240627[/C][C]-1.81672324062661[/C][/ROW]
[ROW][C]15[/C][C]468[/C][C]470.454999607313[/C][C]-2.45499960731271[/C][/ROW]
[ROW][C]16[/C][C]467[/C][C]466.482503216099[/C][C]0.517496783901395[/C][/ROW]
[ROW][C]17[/C][C]463[/C][C]463.133221160649[/C][C]-0.133221160649257[/C][/ROW]
[ROW][C]18[/C][C]460[/C][C]458.473302017202[/C][C]1.52669798279838[/C][/ROW]
[ROW][C]19[/C][C]462[/C][C]455.16866650012[/C][C]6.83133349987969[/C][/ROW]
[ROW][C]20[/C][C]461[/C][C]461.470325902302[/C][C]-0.470325902301687[/C][/ROW]
[ROW][C]21[/C][C]476[/C][C]480.003026772546[/C][C]-4.00302677254582[/C][/ROW]
[ROW][C]22[/C][C]476[/C][C]477.391685598872[/C][C]-1.39168559887205[/C][/ROW]
[ROW][C]23[/C][C]471[/C][C]466.412554022424[/C][C]4.58744597757621[/C][/ROW]
[ROW][C]24[/C][C]453[/C][C]460.302804323534[/C][C]-7.30280432353444[/C][/ROW]
[ROW][C]25[/C][C]443[/C][C]444.099509821653[/C][C]-1.09950982165285[/C][/ROW]
[ROW][C]26[/C][C]442[/C][C]447.865882613603[/C][C]-5.86588261360346[/C][/ROW]
[ROW][C]27[/C][C]444[/C][C]439.936638308142[/C][C]4.06336169185815[/C][/ROW]
[ROW][C]28[/C][C]438[/C][C]440.970849417138[/C][C]-2.97084941713812[/C][/ROW]
[ROW][C]29[/C][C]427[/C][C]431.185632957345[/C][C]-4.18563295734549[/C][/ROW]
[ROW][C]30[/C][C]424[/C][C]422.90136458064[/C][C]1.09863541935987[/C][/ROW]
[ROW][C]31[/C][C]416[/C][C]416.664654050956[/C][C]-0.664654050956333[/C][/ROW]
[ROW][C]32[/C][C]406[/C][C]414.58493484368[/C][C]-8.5849348436803[/C][/ROW]
[ROW][C]33[/C][C]431[/C][C]425.390718860118[/C][C]5.60928113988209[/C][/ROW]
[ROW][C]34[/C][C]434[/C][C]431.126323053706[/C][C]2.87367694629421[/C][/ROW]
[ROW][C]35[/C][C]418[/C][C]422.389454164993[/C][C]-4.38945416499253[/C][/ROW]
[ROW][C]36[/C][C]412[/C][C]411.400420213286[/C][C]0.599579786713967[/C][/ROW]
[ROW][C]37[/C][C]404[/C][C]406.895335045996[/C][C]-2.89533504599635[/C][/ROW]
[ROW][C]38[/C][C]409[/C][C]406.900805693331[/C][C]2.09919430666917[/C][/ROW]
[ROW][C]39[/C][C]412[/C][C]413.683637028784[/C][C]-1.68363702878363[/C][/ROW]
[ROW][C]40[/C][C]406[/C][C]412.089903656090[/C][C]-6.08990365608949[/C][/ROW]
[ROW][C]41[/C][C]398[/C][C]401.479134079882[/C][C]-3.47913407988245[/C][/ROW]
[ROW][C]42[/C][C]397[/C][C]397.964872373148[/C][C]-0.964872373147614[/C][/ROW]
[ROW][C]43[/C][C]385[/C][C]390.935176606929[/C][C]-5.93517660692864[/C][/ROW]
[ROW][C]44[/C][C]390[/C][C]385.253777605295[/C][C]4.74622239470486[/C][/ROW]
[ROW][C]45[/C][C]413[/C][C]412.744947121881[/C][C]0.255052878119127[/C][/ROW]
[ROW][C]46[/C][C]413[/C][C]413.811500363302[/C][C]-0.811500363301738[/C][/ROW]
[ROW][C]47[/C][C]401[/C][C]409.113154909886[/C][C]-8.11315490988594[/C][/ROW]
[ROW][C]48[/C][C]397[/C][C]394.169604177765[/C][C]2.83039582223463[/C][/ROW]
[ROW][C]49[/C][C]397[/C][C]391.668943016975[/C][C]5.33105698302512[/C][/ROW]
[ROW][C]50[/C][C]409[/C][C]403.400450048777[/C][C]5.59954995122339[/C][/ROW]
[ROW][C]51[/C][C]419[/C][C]413.76620087642[/C][C]5.23379912357982[/C][/ROW]
[ROW][C]52[/C][C]424[/C][C]420.988093267555[/C][C]3.01190673244464[/C][/ROW]
[ROW][C]53[/C][C]428[/C][C]424.334279369915[/C][C]3.66572063008502[/C][/ROW]
[ROW][C]54[/C][C]430[/C][C]429.493304244628[/C][C]0.506695755372136[/C][/ROW]
[ROW][C]55[/C][C]424[/C][C]427.8597607216[/C][C]-3.85976072160027[/C][/ROW]
[ROW][C]56[/C][C]433[/C][C]428.966524298494[/C][C]4.03347570150591[/C][/ROW]
[ROW][C]57[/C][C]456[/C][C]456.945945383879[/C][C]-0.945945383879216[/C][/ROW]
[/TABLE]
Source: https://freestatistics.org/blog/index.php?pk=67649&T=4

Globally Unique Identifier (entire table): ba.freestatistics.org/blog/index.php?pk=67649&T=4

As an alternative you can also use a QR Code:  

The GUIDs for individual cells are displayed in the table below:

Multiple Linear Regression - Actuals, Interpolation, and Residuals
Time or IndexActualsInterpolationForecastResidualsPrediction Error
1455457.298341147422-2.29834114742237
2461461.016138403663-0.0161384036624990
3461466.158524179342-5.15852417934163
4463457.4686504431185.53134955688158
5462457.8677324322084.13226756779218
6456458.167156784383-2.16715678438277
7455451.3717421203943.62825787960555
8456455.7244373502290.275562649771210
9472472.915361861576-0.91536186157618
10472472.67049098412-0.670490984120429
11471463.0848369026987.91516309730226
12465461.1271712854143.87282871458585
13459458.0378709679540.962129032046447
14465466.816723240627-1.81672324062661
15468470.454999607313-2.45499960731271
16467466.4825032160990.517496783901395
17463463.133221160649-0.133221160649257
18460458.4733020172021.52669798279838
19462455.168666500126.83133349987969
20461461.470325902302-0.470325902301687
21476480.003026772546-4.00302677254582
22476477.391685598872-1.39168559887205
23471466.4125540224244.58744597757621
24453460.302804323534-7.30280432353444
25443444.099509821653-1.09950982165285
26442447.865882613603-5.86588261360346
27444439.9366383081424.06336169185815
28438440.970849417138-2.97084941713812
29427431.185632957345-4.18563295734549
30424422.901364580641.09863541935987
31416416.664654050956-0.664654050956333
32406414.58493484368-8.5849348436803
33431425.3907188601185.60928113988209
34434431.1263230537062.87367694629421
35418422.389454164993-4.38945416499253
36412411.4004202132860.599579786713967
37404406.895335045996-2.89533504599635
38409406.9008056933312.09919430666917
39412413.683637028784-1.68363702878363
40406412.089903656090-6.08990365608949
41398401.479134079882-3.47913407988245
42397397.964872373148-0.964872373147614
43385390.935176606929-5.93517660692864
44390385.2537776052954.74622239470486
45413412.7449471218810.255052878119127
46413413.811500363302-0.811500363301738
47401409.113154909886-8.11315490988594
48397394.1696041777652.83039582223463
49397391.6689430169755.33105698302512
50409403.4004500487775.59954995122339
51419413.766200876425.23379912357982
52424420.9880932675553.01190673244464
53428424.3342793699153.66572063008502
54430429.4933042446280.506695755372136
55424427.8597607216-3.85976072160027
56433428.9665242984944.03347570150591
57456456.945945383879-0.945945383879216


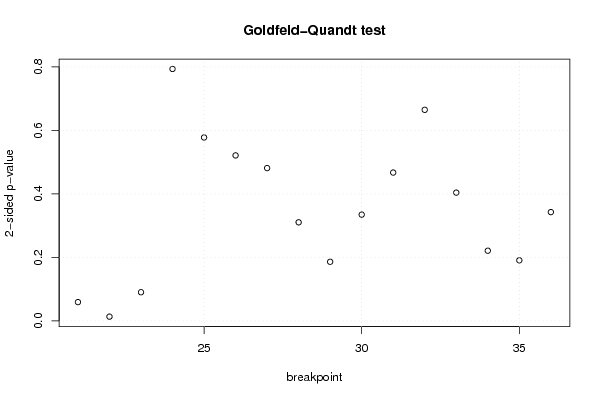
Goldfeld-Quandt test for Heteroskedasticity
p-valuesAlternative Hypothesis
breakpoint indexgreater2-sidedless
210.02965506389571490.05931012779142970.970344936104285
220.006723687603797880.01344737520759580.993276312396202
230.04518188275799950.0903637655159990.954818117242
240.3967622635003940.7935245270007890.603237736499606
250.2888657931029620.5777315862059250.711134206897038
260.2606167268463110.5212334536926210.73938327315369
270.2406344465807680.4812688931615370.759365553419232
280.1552546560229850.3105093120459700.844745343977015
290.09312274066796450.1862454813359290.906877259332036
300.1673797859906440.3347595719812870.832620214009356
310.2336093361240580.4672186722481170.766390663875941
320.3323985505125870.6647971010251740.667601449487413
330.7979549688249630.4040900623500730.202045031175037
340.8894355293940240.2211289412119520.110564470605976
350.9045579380548770.1908841238902450.0954420619451226
360.8286763298878340.3426473402243320.171323670112166

\begin{tabular}{lllllllll}
\hline
Goldfeld-Quandt test for Heteroskedasticity \tabularnewline
p-values & Alternative Hypothesis \tabularnewline
breakpoint index & greater & 2-sided & less \tabularnewline
21 & 0.0296550638957149 & 0.0593101277914297 & 0.970344936104285 \tabularnewline
22 & 0.00672368760379788 & 0.0134473752075958 & 0.993276312396202 \tabularnewline
23 & 0.0451818827579995 & 0.090363765515999 & 0.954818117242 \tabularnewline
24 & 0.396762263500394 & 0.793524527000789 & 0.603237736499606 \tabularnewline
25 & 0.288865793102962 & 0.577731586205925 & 0.711134206897038 \tabularnewline
26 & 0.260616726846311 & 0.521233453692621 & 0.73938327315369 \tabularnewline
27 & 0.240634446580768 & 0.481268893161537 & 0.759365553419232 \tabularnewline
28 & 0.155254656022985 & 0.310509312045970 & 0.844745343977015 \tabularnewline
29 & 0.0931227406679645 & 0.186245481335929 & 0.906877259332036 \tabularnewline
30 & 0.167379785990644 & 0.334759571981287 & 0.832620214009356 \tabularnewline
31 & 0.233609336124058 & 0.467218672248117 & 0.766390663875941 \tabularnewline
32 & 0.332398550512587 & 0.664797101025174 & 0.667601449487413 \tabularnewline
33 & 0.797954968824963 & 0.404090062350073 & 0.202045031175037 \tabularnewline
34 & 0.889435529394024 & 0.221128941211952 & 0.110564470605976 \tabularnewline
35 & 0.904557938054877 & 0.190884123890245 & 0.0954420619451226 \tabularnewline
36 & 0.828676329887834 & 0.342647340224332 & 0.171323670112166 \tabularnewline
\hline
\end{tabular}
%Source: https://freestatistics.org/blog/index.php?pk=67649&T=5

[TABLE]
[ROW][C]Goldfeld-Quandt test for Heteroskedasticity[/C][/ROW]
[ROW][C]p-values[/C][C]Alternative Hypothesis[/C][/ROW]
[ROW][C]breakpoint index[/C][C]greater[/C][C]2-sided[/C][C]less[/C][/ROW]
[ROW][C]21[/C][C]0.0296550638957149[/C][C]0.0593101277914297[/C][C]0.970344936104285[/C][/ROW]
[ROW][C]22[/C][C]0.00672368760379788[/C][C]0.0134473752075958[/C][C]0.993276312396202[/C][/ROW]
[ROW][C]23[/C][C]0.0451818827579995[/C][C]0.090363765515999[/C][C]0.954818117242[/C][/ROW]
[ROW][C]24[/C][C]0.396762263500394[/C][C]0.793524527000789[/C][C]0.603237736499606[/C][/ROW]
[ROW][C]25[/C][C]0.288865793102962[/C][C]0.577731586205925[/C][C]0.711134206897038[/C][/ROW]
[ROW][C]26[/C][C]0.260616726846311[/C][C]0.521233453692621[/C][C]0.73938327315369[/C][/ROW]
[ROW][C]27[/C][C]0.240634446580768[/C][C]0.481268893161537[/C][C]0.759365553419232[/C][/ROW]
[ROW][C]28[/C][C]0.155254656022985[/C][C]0.310509312045970[/C][C]0.844745343977015[/C][/ROW]
[ROW][C]29[/C][C]0.0931227406679645[/C][C]0.186245481335929[/C][C]0.906877259332036[/C][/ROW]
[ROW][C]30[/C][C]0.167379785990644[/C][C]0.334759571981287[/C][C]0.832620214009356[/C][/ROW]
[ROW][C]31[/C][C]0.233609336124058[/C][C]0.467218672248117[/C][C]0.766390663875941[/C][/ROW]
[ROW][C]32[/C][C]0.332398550512587[/C][C]0.664797101025174[/C][C]0.667601449487413[/C][/ROW]
[ROW][C]33[/C][C]0.797954968824963[/C][C]0.404090062350073[/C][C]0.202045031175037[/C][/ROW]
[ROW][C]34[/C][C]0.889435529394024[/C][C]0.221128941211952[/C][C]0.110564470605976[/C][/ROW]
[ROW][C]35[/C][C]0.904557938054877[/C][C]0.190884123890245[/C][C]0.0954420619451226[/C][/ROW]
[ROW][C]36[/C][C]0.828676329887834[/C][C]0.342647340224332[/C][C]0.171323670112166[/C][/ROW]
[/TABLE]
Source: https://freestatistics.org/blog/index.php?pk=67649&T=5

Globally Unique Identifier (entire table): ba.freestatistics.org/blog/index.php?pk=67649&T=5

As an alternative you can also use a QR Code:  

The GUIDs for individual cells are displayed in the table below:

Goldfeld-Quandt test for Heteroskedasticity
p-valuesAlternative Hypothesis
breakpoint indexgreater2-sidedless
210.02965506389571490.05931012779142970.970344936104285
220.006723687603797880.01344737520759580.993276312396202
230.04518188275799950.0903637655159990.954818117242
240.3967622635003940.7935245270007890.603237736499606
250.2888657931029620.5777315862059250.711134206897038
260.2606167268463110.5212334536926210.73938327315369
270.2406344465807680.4812688931615370.759365553419232
280.1552546560229850.3105093120459700.844745343977015
290.09312274066796450.1862454813359290.906877259332036
300.1673797859906440.3347595719812870.832620214009356
310.2336093361240580.4672186722481170.766390663875941
320.3323985505125870.6647971010251740.667601449487413
330.7979549688249630.4040900623500730.202045031175037
340.8894355293940240.2211289412119520.110564470605976
350.9045579380548770.1908841238902450.0954420619451226
360.8286763298878340.3426473402243320.171323670112166


Meta Analysis of Goldfeld-Quandt test for Heteroskedasticity
Description# significant tests% significant testsOK/NOK
1% type I error level00OK
5% type I error level10.0625NOK
10% type I error level30.1875NOK

\begin{tabular}{lllllllll}
\hline
Meta Analysis of Goldfeld-Quandt test for Heteroskedasticity \tabularnewline
Description & # significant tests & % significant tests & OK/NOK \tabularnewline
1% type I error level & 0 & 0 & OK \tabularnewline
5% type I error level & 1 & 0.0625 & NOK \tabularnewline
10% type I error level & 3 & 0.1875 & NOK \tabularnewline
\hline
\end{tabular}
%Source: https://freestatistics.org/blog/index.php?pk=67649&T=6

[TABLE]
[ROW][C]Meta Analysis of Goldfeld-Quandt test for Heteroskedasticity[/C][/ROW]
[ROW][C]Description[/C][C]# significant tests[/C][C]% significant tests[/C][C]OK/NOK[/C][/ROW]
[ROW][C]1% type I error level[/C][C]0[/C][C]0[/C][C]OK[/C][/ROW]
[ROW][C]5% type I error level[/C][C]1[/C][C]0.0625[/C][C]NOK[/C][/ROW]
[ROW][C]10% type I error level[/C][C]3[/C][C]0.1875[/C][C]NOK[/C][/ROW]
[/TABLE]
Source: https://freestatistics.org/blog/index.php?pk=67649&T=6

Globally Unique Identifier (entire table): ba.freestatistics.org/blog/index.php?pk=67649&T=6

As an alternative you can also use a QR Code:  

The GUIDs for individual cells are displayed in the table below:

Meta Analysis of Goldfeld-Quandt test for Heteroskedasticity
Description# significant tests% significant testsOK/NOK
1% type I error level00OK
5% type I error level10.0625NOK
10% type I error level30.1875NOK


Parameters (Session):
par1 = 1 ; par2 = Include Monthly Dummies ; par3 = Linear Trend ;
Parameters (R input):
par1 = 1 ; par2 = Include Monthly Dummies ; par3 = Linear Trend ;
R code (references can be found in the software module):
library(lattice)
library(lmtest)
n25 <- 25 #minimum number of obs. for Goldfeld-Quandt test
par1 <- as.numeric(par1)
x <- t(y)
k <- length(x[1,])
n <- length(x[,1])
x1 <- cbind(x[,par1], x[,1:k!=par1])
mycolnames <- c(colnames(x)[par1], colnames(x)[1:k!=par1])
colnames(x1) <- mycolnames #colnames(x)[par1]
x <- x1
if (par3 == 'First Differences'){
x2 <- array(0, dim=c(n-1,k), dimnames=list(1:(n-1), paste('(1-B)',colnames(x),sep='')))
for (i in 1:n-1) {
for (j in 1:k) {
x2[i,j] <- x[i+1,j] - x[i,j]
}
}
x <- x2
}
if (par2 == 'Include Monthly Dummies'){
x2 <- array(0, dim=c(n,11), dimnames=list(1:n, paste('M', seq(1:11), sep ='')))
for (i in 1:11){
x2[seq(i,n,12),i] <- 1
}
x <- cbind(x, x2)
}
if (par2 == 'Include Quarterly Dummies'){
x2 <- array(0, dim=c(n,3), dimnames=list(1:n, paste('Q', seq(1:3), sep ='')))
for (i in 1:3){
x2[seq(i,n,4),i] <- 1
}
x <- cbind(x, x2)
}
k <- length(x[1,])
if (par3 == 'Linear Trend'){
x <- cbind(x, c(1:n))
colnames(x)[k+1] <- 't'
}
x
k <- length(x[1,])
df <- as.data.frame(x)
(mylm <- lm(df))
(mysum <- summary(mylm))
if (n > n25) {
kp3 <- k + 3
nmkm3 <- n - k - 3
gqarr <- array(NA, dim=c(nmkm3-kp3+1,3))
numgqtests <- 0
numsignificant1 <- 0
numsignificant5 <- 0
numsignificant10 <- 0
for (mypoint in kp3:nmkm3) {
j <- 0
numgqtests <- numgqtests + 1
for (myalt in c('greater', 'two.sided', 'less')) {
j <- j + 1
gqarr[mypoint-kp3+1,j] <- gqtest(mylm, point=mypoint, alternative=myalt)$p.value
}
if (gqarr[mypoint-kp3+1,2] < 0.01) numsignificant1 <- numsignificant1 + 1
if (gqarr[mypoint-kp3+1,2] < 0.05) numsignificant5 <- numsignificant5 + 1
if (gqarr[mypoint-kp3+1,2] < 0.10) numsignificant10 <- numsignificant10 + 1
}
gqarr
}
bitmap(file='test0.png')
plot(x[,1], type='l', main='Actuals and Interpolation', ylab='value of Actuals and Interpolation (dots)', xlab='time or index')
points(x[,1]-mysum$resid)
grid()
dev.off()
bitmap(file='test1.png')
plot(mysum$resid, type='b', pch=19, main='Residuals', ylab='value of Residuals', xlab='time or index')
grid()
dev.off()
bitmap(file='test2.png')
hist(mysum$resid, main='Residual Histogram', xlab='values of Residuals')
grid()
dev.off()
bitmap(file='test3.png')
densityplot(~mysum$resid,col='black',main='Residual Density Plot', xlab='values of Residuals')
dev.off()
bitmap(file='test4.png')
qqnorm(mysum$resid, main='Residual Normal Q-Q Plot')
qqline(mysum$resid)
grid()
dev.off()
(myerror <- as.ts(mysum$resid))
bitmap(file='test5.png')
dum <- cbind(lag(myerror,k=1),myerror)
dum
dum1 <- dum[2:length(myerror),]
dum1
z <- as.data.frame(dum1)
z
plot(z,main=paste('Residual Lag plot, lowess, and regression line'), ylab='values of Residuals', xlab='lagged values of Residuals')
lines(lowess(z))
abline(lm(z))
grid()
dev.off()
bitmap(file='test6.png')
acf(mysum$resid, lag.max=length(mysum$resid)/2, main='Residual Autocorrelation Function')
grid()
dev.off()
bitmap(file='test7.png')
pacf(mysum$resid, lag.max=length(mysum$resid)/2, main='Residual Partial Autocorrelation Function')
grid()
dev.off()
bitmap(file='test8.png')
opar <- par(mfrow = c(2,2), oma = c(0, 0, 1.1, 0))
plot(mylm, las = 1, sub='Residual Diagnostics')
par(opar)
dev.off()
if (n > n25) {
bitmap(file='test9.png')
plot(kp3:nmkm3,gqarr[,2], main='Goldfeld-Quandt test',ylab='2-sided p-value',xlab='breakpoint')
grid()
dev.off()
}
load(file='createtable')
a<-table.start()
a<-table.row.start(a)
a<-table.element(a, 'Multiple Linear Regression - Estimated Regression Equation', 1, TRUE)
a<-table.row.end(a)
myeq <- colnames(x)[1]
myeq <- paste(myeq, '[t] = ', sep='')
for (i in 1:k){
if (mysum$coefficients[i,1] > 0) myeq <- paste(myeq, '+', '')
myeq <- paste(myeq, mysum$coefficients[i,1], sep=' ')
if (rownames(mysum$coefficients)[i] != '(Intercept)') {
myeq <- paste(myeq, rownames(mysum$coefficients)[i], sep='')
if (rownames(mysum$coefficients)[i] != 't') myeq <- paste(myeq, '[t]', sep='')
}
}
myeq <- paste(myeq, ' + e[t]')
a<-table.row.start(a)
a<-table.element(a, myeq)
a<-table.row.end(a)
a<-table.end(a)
table.save(a,file='mytable1.tab')
a<-table.start()
a<-table.row.start(a)
a<-table.element(a,hyperlink('ols1.htm','Multiple Linear Regression - Ordinary Least Squares',''), 6, TRUE)
a<-table.row.end(a)
a<-table.row.start(a)
a<-table.element(a,'Variable',header=TRUE)
a<-table.element(a,'Parameter',header=TRUE)
a<-table.element(a,'S.D.',header=TRUE)
a<-table.element(a,'T-STAT
H0: parameter = 0',header=TRUE)
a<-table.element(a,'2-tail p-value',header=TRUE)
a<-table.element(a,'1-tail p-value',header=TRUE)
a<-table.row.end(a)
for (i in 1:k){
a<-table.row.start(a)
a<-table.element(a,rownames(mysum$coefficients)[i],header=TRUE)
a<-table.element(a,mysum$coefficients[i,1])
a<-table.element(a, round(mysum$coefficients[i,2],6))
a<-table.element(a, round(mysum$coefficients[i,3],4))
a<-table.element(a, round(mysum$coefficients[i,4],6))
a<-table.element(a, round(mysum$coefficients[i,4]/2,6))
a<-table.row.end(a)
}
a<-table.end(a)
table.save(a,file='mytable2.tab')
a<-table.start()
a<-table.row.start(a)
a<-table.element(a, 'Multiple Linear Regression - Regression Statistics', 2, TRUE)
a<-table.row.end(a)
a<-table.row.start(a)
a<-table.element(a, 'Multiple R',1,TRUE)
a<-table.element(a, sqrt(mysum$r.squared))
a<-table.row.end(a)
a<-table.row.start(a)
a<-table.element(a, 'R-squared',1,TRUE)
a<-table.element(a, mysum$r.squared)
a<-table.row.end(a)
a<-table.row.start(a)
a<-table.element(a, 'Adjusted R-squared',1,TRUE)
a<-table.element(a, mysum$adj.r.squared)
a<-table.row.end(a)
a<-table.row.start(a)
a<-table.element(a, 'F-TEST (value)',1,TRUE)
a<-table.element(a, mysum$fstatistic[1])
a<-table.row.end(a)
a<-table.row.start(a)
a<-table.element(a, 'F-TEST (DF numerator)',1,TRUE)
a<-table.element(a, mysum$fstatistic[2])
a<-table.row.end(a)
a<-table.row.start(a)
a<-table.element(a, 'F-TEST (DF denominator)',1,TRUE)
a<-table.element(a, mysum$fstatistic[3])
a<-table.row.end(a)
a<-table.row.start(a)
a<-table.element(a, 'p-value',1,TRUE)
a<-table.element(a, 1-pf(mysum$fstatistic[1],mysum$fstatistic[2],mysum$fstatistic[3]))
a<-table.row.end(a)
a<-table.row.start(a)
a<-table.element(a, 'Multiple Linear Regression - Residual Statistics', 2, TRUE)
a<-table.row.end(a)
a<-table.row.start(a)
a<-table.element(a, 'Residual Standard Deviation',1,TRUE)
a<-table.element(a, mysum$sigma)
a<-table.row.end(a)
a<-table.row.start(a)
a<-table.element(a, 'Sum Squared Residuals',1,TRUE)
a<-table.element(a, sum(myerror*myerror))
a<-table.row.end(a)
a<-table.end(a)
table.save(a,file='mytable3.tab')
a<-table.start()
a<-table.row.start(a)
a<-table.element(a, 'Multiple Linear Regression - Actuals, Interpolation, and Residuals', 4, TRUE)
a<-table.row.end(a)
a<-table.row.start(a)
a<-table.element(a, 'Time or Index', 1, TRUE)
a<-table.element(a, 'Actuals', 1, TRUE)
a<-table.element(a, 'Interpolation
Forecast', 1, TRUE)
a<-table.element(a, 'Residuals
Prediction Error', 1, TRUE)
a<-table.row.end(a)
for (i in 1:n) {
a<-table.row.start(a)
a<-table.element(a,i, 1, TRUE)
a<-table.element(a,x[i])
a<-table.element(a,x[i]-mysum$resid[i])
a<-table.element(a,mysum$resid[i])
a<-table.row.end(a)
}
a<-table.end(a)
table.save(a,file='mytable4.tab')
if (n > n25) {
a<-table.start()
a<-table.row.start(a)
a<-table.element(a,'Goldfeld-Quandt test for Heteroskedasticity',4,TRUE)
a<-table.row.end(a)
a<-table.row.start(a)
a<-table.element(a,'p-values',header=TRUE)
a<-table.element(a,'Alternative Hypothesis',3,header=TRUE)
a<-table.row.end(a)
a<-table.row.start(a)
a<-table.element(a,'breakpoint index',header=TRUE)
a<-table.element(a,'greater',header=TRUE)
a<-table.element(a,'2-sided',header=TRUE)
a<-table.element(a,'less',header=TRUE)
a<-table.row.end(a)
for (mypoint in kp3:nmkm3) {
a<-table.row.start(a)
a<-table.element(a,mypoint,header=TRUE)
a<-table.element(a,gqarr[mypoint-kp3+1,1])
a<-table.element(a,gqarr[mypoint-kp3+1,2])
a<-table.element(a,gqarr[mypoint-kp3+1,3])
a<-table.row.end(a)
}
a<-table.end(a)
table.save(a,file='mytable5.tab')
a<-table.start()
a<-table.row.start(a)
a<-table.element(a,'Meta Analysis of Goldfeld-Quandt test for Heteroskedasticity',4,TRUE)
a<-table.row.end(a)
a<-table.row.start(a)
a<-table.element(a,'Description',header=TRUE)
a<-table.element(a,'# significant tests',header=TRUE)
a<-table.element(a,'% significant tests',header=TRUE)
a<-table.element(a,'OK/NOK',header=TRUE)
a<-table.row.end(a)
a<-table.row.start(a)
a<-table.element(a,'1% type I error level',header=TRUE)
a<-table.element(a,numsignificant1)
a<-table.element(a,numsignificant1/numgqtests)
if (numsignificant1/numgqtests < 0.01) dum <- 'OK' else dum <- 'NOK'
a<-table.element(a,dum)
a<-table.row.end(a)
a<-table.row.start(a)
a<-table.element(a,'5% type I error level',header=TRUE)
a<-table.element(a,numsignificant5)
a<-table.element(a,numsignificant5/numgqtests)
if (numsignificant5/numgqtests < 0.05) dum <- 'OK' else dum <- 'NOK'
a<-table.element(a,dum)
a<-table.row.end(a)
a<-table.row.start(a)
a<-table.element(a,'10% type I error level',header=TRUE)
a<-table.element(a,numsignificant10)
a<-table.element(a,numsignificant10/numgqtests)
if (numsignificant10/numgqtests < 0.1) dum <- 'OK' else dum <- 'NOK'
a<-table.element(a,dum)
a<-table.row.end(a)
a<-table.end(a)
table.save(a,file='mytable6.tab')
}