Free Statistics

of Irreproducible Research!

Author's title

Author*The author of this computation has been verified*
R Software Modulerwasp_arimaforecasting.wasp
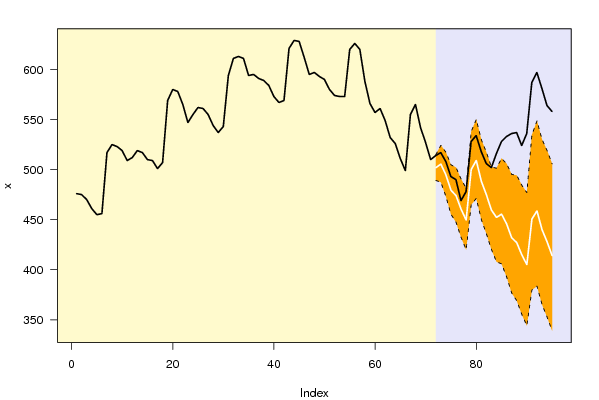
Title produced by softwareARIMA Forecasting
Date of computationSat, 19 Dec 2009 03:32:11 -0700
Cite this page as followsStatistical Computations at FreeStatistics.org, Office for Research Development and Education, URL https://freestatistics.org/blog/index.php?v=date/2009/Dec/19/t12612190464r88qalzlx0n5ed.htm/, Retrieved Fri, 03 May 2024 09:04:58 +0000
Statistical Computations at FreeStatistics.org, Office for Research Development and Education, URL https://freestatistics.org/blog/index.php?pk=69484, Retrieved Fri, 03 May 2024 09:04:58 +0000
QR Codes:

Original text written by user:
IsPrivate?No (this computation is public)
User-defined keywords
Estimated Impact159
Family? (F = Feedback message, R = changed R code, M = changed R Module, P = changed Parameters, D = changed Data)
-     [Multiple Regression] [Q1 The Seatbeltlaw] [2007-11-14 19:27:43] [8cd6641b921d30ebe00b648d1481bba0]
- RM D  [Multiple Regression] [Seatbelt] [2009-11-12 14:06:21] [b98453cac15ba1066b407e146608df68]
- R PD    [Multiple Regression] [] [2009-11-19 08:06:13] [639dd97b6eeebe46a3c92d62cb04fb95]
- RMPD      [ARIMA Forecasting] [] [2009-12-14 08:41:55] [639dd97b6eeebe46a3c92d62cb04fb95]
-   PD          [ARIMA Forecasting] [] [2009-12-19 10:32:11] [21edaefb91319406e70b6c03c71b58b3] [Current]
Feedback Forum

Post a new message
Dataseries X:
476
475
470
461
455
456
517
525
523
519
509
512
519
517
510
509
501
507
569
580
578
565
547
555
562
561
555
544
537
543
594
611
613
611
594
595
591
589
584
573
567
569
621
629
628
612
595
597
593
590
580
574
573
573
620
626
620
588
566
557
561
549
532
526
511
499
555
565
542
527
510
514
517
508
493
490
469
478
528
534
518
506
502
516
528
533
536
537
524
536
587
597
581
564
558


Summary of computational transaction
Raw Inputview raw input (R code)
Raw Outputview raw output of R engine
Computing time2 seconds
R Server'Gwilym Jenkins' @ 72.249.127.135

\begin{tabular}{lllllllll}
\hline
Summary of computational transaction \tabularnewline
Raw Input & view raw input (R code)  \tabularnewline
Raw Output & view raw output of R engine  \tabularnewline
Computing time & 2 seconds \tabularnewline
R Server & 'Gwilym Jenkins' @ 72.249.127.135 \tabularnewline
\hline
\end{tabular}
%Source: https://freestatistics.org/blog/index.php?pk=69484&T=0

[TABLE]
[ROW][C]Summary of computational transaction[/C][/ROW]
[ROW][C]Raw Input[/C][C]view raw input (R code) [/C][/ROW]
[ROW][C]Raw Output[/C][C]view raw output of R engine [/C][/ROW]
[ROW][C]Computing time[/C][C]2 seconds[/C][/ROW]
[ROW][C]R Server[/C][C]'Gwilym Jenkins' @ 72.249.127.135[/C][/ROW]
[/TABLE]
Source: https://freestatistics.org/blog/index.php?pk=69484&T=0

Globally Unique Identifier (entire table): ba.freestatistics.org/blog/index.php?pk=69484&T=0

As an alternative you can also use a QR Code:  

The GUIDs for individual cells are displayed in the table below:

Summary of computational transaction
Raw Inputview raw input (R code)
Raw Outputview raw output of R engine
Computing time2 seconds
R Server'Gwilym Jenkins' @ 72.249.127.135


Univariate ARIMA Extrapolation Forecast
timeY[t]F[t]95% LB95% UBp-value(H0: Y[t] = F[t])P(F[t]>Y[t-1])P(F[t]>Y[t-s])P(F[t]>Y[71])
59566-------
60557-------
61561-------
62549-------
63532-------
64526-------
65511-------
66499-------
67555-------
68565-------
69542-------
70527-------
71510-------
72514501.9489.1526514.97950.03490.112400.1124
73517505.5043487.4119524.26830.11490.187400.3193
74508494.6914473.0822517.28760.12420.026500.0921
75493479.3731455.2694504.75290.14630.013500.009
76490473.9666447.3975502.11350.13210.09251e-040.0061
77469460.4504432.2491490.49170.28850.02695e-046e-04
78478449.6375419.9639481.40780.04010.11610.00121e-04
79528500.0978464.8953537.96590.07430.87360.00220.3041
80534509.1086471.1792550.09130.11690.18310.00380.483
81518488.3838450.108529.91460.08110.01570.00570.1538
82506474.8677435.91517.3070.07520.02320.0080.0523
83502459.5494420.2447502.53010.02640.01710.01070.0107
84516452.2506407.9048501.41750.00550.02370.00690.0107
85528455.4984405.8538511.21560.00540.01670.01530.0276
86533445.7551392.8174505.82690.00220.00360.02110.018
87536431.9521376.814495.15856e-049e-040.02920.0078
88537427.0805369.0652494.21547e-047e-040.03310.0077
89524414.9014355.3772484.39560.0013e-040.06350.0037
90536405.1581344.1352477.00172e-046e-040.02340.0021
91587450.6268379.7165534.77927e-040.02340.03580.0834
92597458.7462383.625548.57740.00130.00260.05030.1317
93581440.0715365.3298530.10450.00113e-040.04490.064
94564427.8924352.731519.06960.00175e-040.04660.0388
95558414.0894339.0452505.74390.0017e-040.03010.0201

\begin{tabular}{lllllllll}
\hline
Univariate ARIMA Extrapolation Forecast \tabularnewline
time & Y[t] & F[t] & 95% LB & 95% UB & p-value(H0: Y[t] = F[t]) & P(F[t]>Y[t-1]) & P(F[t]>Y[t-s]) & P(F[t]>Y[71]) \tabularnewline
59 & 566 & - & - & - & - & - & - & - \tabularnewline
60 & 557 & - & - & - & - & - & - & - \tabularnewline
61 & 561 & - & - & - & - & - & - & - \tabularnewline
62 & 549 & - & - & - & - & - & - & - \tabularnewline
63 & 532 & - & - & - & - & - & - & - \tabularnewline
64 & 526 & - & - & - & - & - & - & - \tabularnewline
65 & 511 & - & - & - & - & - & - & - \tabularnewline
66 & 499 & - & - & - & - & - & - & - \tabularnewline
67 & 555 & - & - & - & - & - & - & - \tabularnewline
68 & 565 & - & - & - & - & - & - & - \tabularnewline
69 & 542 & - & - & - & - & - & - & - \tabularnewline
70 & 527 & - & - & - & - & - & - & - \tabularnewline
71 & 510 & - & - & - & - & - & - & - \tabularnewline
72 & 514 & 501.9 & 489.1526 & 514.9795 & 0.0349 & 0.1124 & 0 & 0.1124 \tabularnewline
73 & 517 & 505.5043 & 487.4119 & 524.2683 & 0.1149 & 0.1874 & 0 & 0.3193 \tabularnewline
74 & 508 & 494.6914 & 473.0822 & 517.2876 & 0.1242 & 0.0265 & 0 & 0.0921 \tabularnewline
75 & 493 & 479.3731 & 455.2694 & 504.7529 & 0.1463 & 0.0135 & 0 & 0.009 \tabularnewline
76 & 490 & 473.9666 & 447.3975 & 502.1135 & 0.1321 & 0.0925 & 1e-04 & 0.0061 \tabularnewline
77 & 469 & 460.4504 & 432.2491 & 490.4917 & 0.2885 & 0.0269 & 5e-04 & 6e-04 \tabularnewline
78 & 478 & 449.6375 & 419.9639 & 481.4078 & 0.0401 & 0.1161 & 0.0012 & 1e-04 \tabularnewline
79 & 528 & 500.0978 & 464.8953 & 537.9659 & 0.0743 & 0.8736 & 0.0022 & 0.3041 \tabularnewline
80 & 534 & 509.1086 & 471.1792 & 550.0913 & 0.1169 & 0.1831 & 0.0038 & 0.483 \tabularnewline
81 & 518 & 488.3838 & 450.108 & 529.9146 & 0.0811 & 0.0157 & 0.0057 & 0.1538 \tabularnewline
82 & 506 & 474.8677 & 435.91 & 517.307 & 0.0752 & 0.0232 & 0.008 & 0.0523 \tabularnewline
83 & 502 & 459.5494 & 420.2447 & 502.5301 & 0.0264 & 0.0171 & 0.0107 & 0.0107 \tabularnewline
84 & 516 & 452.2506 & 407.9048 & 501.4175 & 0.0055 & 0.0237 & 0.0069 & 0.0107 \tabularnewline
85 & 528 & 455.4984 & 405.8538 & 511.2156 & 0.0054 & 0.0167 & 0.0153 & 0.0276 \tabularnewline
86 & 533 & 445.7551 & 392.8174 & 505.8269 & 0.0022 & 0.0036 & 0.0211 & 0.018 \tabularnewline
87 & 536 & 431.9521 & 376.814 & 495.1585 & 6e-04 & 9e-04 & 0.0292 & 0.0078 \tabularnewline
88 & 537 & 427.0805 & 369.0652 & 494.2154 & 7e-04 & 7e-04 & 0.0331 & 0.0077 \tabularnewline
89 & 524 & 414.9014 & 355.3772 & 484.3956 & 0.001 & 3e-04 & 0.0635 & 0.0037 \tabularnewline
90 & 536 & 405.1581 & 344.1352 & 477.0017 & 2e-04 & 6e-04 & 0.0234 & 0.0021 \tabularnewline
91 & 587 & 450.6268 & 379.7165 & 534.7792 & 7e-04 & 0.0234 & 0.0358 & 0.0834 \tabularnewline
92 & 597 & 458.7462 & 383.625 & 548.5774 & 0.0013 & 0.0026 & 0.0503 & 0.1317 \tabularnewline
93 & 581 & 440.0715 & 365.3298 & 530.1045 & 0.0011 & 3e-04 & 0.0449 & 0.064 \tabularnewline
94 & 564 & 427.8924 & 352.731 & 519.0696 & 0.0017 & 5e-04 & 0.0466 & 0.0388 \tabularnewline
95 & 558 & 414.0894 & 339.0452 & 505.7439 & 0.001 & 7e-04 & 0.0301 & 0.0201 \tabularnewline
\hline
\end{tabular}
%Source: https://freestatistics.org/blog/index.php?pk=69484&T=1

[TABLE]
[ROW][C]Univariate ARIMA Extrapolation Forecast[/C][/ROW]
[ROW][C]time[/C][C]Y[t][/C][C]F[t][/C][C]95% LB[/C][C]95% UB[/C][C]p-value(H0: Y[t] = F[t])[/C][C]P(F[t]>Y[t-1])[/C][C]P(F[t]>Y[t-s])[/C][C]P(F[t]>Y[71])[/C][/ROW]
[ROW][C]59[/C][C]566[/C][C]-[/C][C]-[/C][C]-[/C][C]-[/C][C]-[/C][C]-[/C][C]-[/C][/ROW]
[ROW][C]60[/C][C]557[/C][C]-[/C][C]-[/C][C]-[/C][C]-[/C][C]-[/C][C]-[/C][C]-[/C][/ROW]
[ROW][C]61[/C][C]561[/C][C]-[/C][C]-[/C][C]-[/C][C]-[/C][C]-[/C][C]-[/C][C]-[/C][/ROW]
[ROW][C]62[/C][C]549[/C][C]-[/C][C]-[/C][C]-[/C][C]-[/C][C]-[/C][C]-[/C][C]-[/C][/ROW]
[ROW][C]63[/C][C]532[/C][C]-[/C][C]-[/C][C]-[/C][C]-[/C][C]-[/C][C]-[/C][C]-[/C][/ROW]
[ROW][C]64[/C][C]526[/C][C]-[/C][C]-[/C][C]-[/C][C]-[/C][C]-[/C][C]-[/C][C]-[/C][/ROW]
[ROW][C]65[/C][C]511[/C][C]-[/C][C]-[/C][C]-[/C][C]-[/C][C]-[/C][C]-[/C][C]-[/C][/ROW]
[ROW][C]66[/C][C]499[/C][C]-[/C][C]-[/C][C]-[/C][C]-[/C][C]-[/C][C]-[/C][C]-[/C][/ROW]
[ROW][C]67[/C][C]555[/C][C]-[/C][C]-[/C][C]-[/C][C]-[/C][C]-[/C][C]-[/C][C]-[/C][/ROW]
[ROW][C]68[/C][C]565[/C][C]-[/C][C]-[/C][C]-[/C][C]-[/C][C]-[/C][C]-[/C][C]-[/C][/ROW]
[ROW][C]69[/C][C]542[/C][C]-[/C][C]-[/C][C]-[/C][C]-[/C][C]-[/C][C]-[/C][C]-[/C][/ROW]
[ROW][C]70[/C][C]527[/C][C]-[/C][C]-[/C][C]-[/C][C]-[/C][C]-[/C][C]-[/C][C]-[/C][/ROW]
[ROW][C]71[/C][C]510[/C][C]-[/C][C]-[/C][C]-[/C][C]-[/C][C]-[/C][C]-[/C][C]-[/C][/ROW]
[ROW][C]72[/C][C]514[/C][C]501.9[/C][C]489.1526[/C][C]514.9795[/C][C]0.0349[/C][C]0.1124[/C][C]0[/C][C]0.1124[/C][/ROW]
[ROW][C]73[/C][C]517[/C][C]505.5043[/C][C]487.4119[/C][C]524.2683[/C][C]0.1149[/C][C]0.1874[/C][C]0[/C][C]0.3193[/C][/ROW]
[ROW][C]74[/C][C]508[/C][C]494.6914[/C][C]473.0822[/C][C]517.2876[/C][C]0.1242[/C][C]0.0265[/C][C]0[/C][C]0.0921[/C][/ROW]
[ROW][C]75[/C][C]493[/C][C]479.3731[/C][C]455.2694[/C][C]504.7529[/C][C]0.1463[/C][C]0.0135[/C][C]0[/C][C]0.009[/C][/ROW]
[ROW][C]76[/C][C]490[/C][C]473.9666[/C][C]447.3975[/C][C]502.1135[/C][C]0.1321[/C][C]0.0925[/C][C]1e-04[/C][C]0.0061[/C][/ROW]
[ROW][C]77[/C][C]469[/C][C]460.4504[/C][C]432.2491[/C][C]490.4917[/C][C]0.2885[/C][C]0.0269[/C][C]5e-04[/C][C]6e-04[/C][/ROW]
[ROW][C]78[/C][C]478[/C][C]449.6375[/C][C]419.9639[/C][C]481.4078[/C][C]0.0401[/C][C]0.1161[/C][C]0.0012[/C][C]1e-04[/C][/ROW]
[ROW][C]79[/C][C]528[/C][C]500.0978[/C][C]464.8953[/C][C]537.9659[/C][C]0.0743[/C][C]0.8736[/C][C]0.0022[/C][C]0.3041[/C][/ROW]
[ROW][C]80[/C][C]534[/C][C]509.1086[/C][C]471.1792[/C][C]550.0913[/C][C]0.1169[/C][C]0.1831[/C][C]0.0038[/C][C]0.483[/C][/ROW]
[ROW][C]81[/C][C]518[/C][C]488.3838[/C][C]450.108[/C][C]529.9146[/C][C]0.0811[/C][C]0.0157[/C][C]0.0057[/C][C]0.1538[/C][/ROW]
[ROW][C]82[/C][C]506[/C][C]474.8677[/C][C]435.91[/C][C]517.307[/C][C]0.0752[/C][C]0.0232[/C][C]0.008[/C][C]0.0523[/C][/ROW]
[ROW][C]83[/C][C]502[/C][C]459.5494[/C][C]420.2447[/C][C]502.5301[/C][C]0.0264[/C][C]0.0171[/C][C]0.0107[/C][C]0.0107[/C][/ROW]
[ROW][C]84[/C][C]516[/C][C]452.2506[/C][C]407.9048[/C][C]501.4175[/C][C]0.0055[/C][C]0.0237[/C][C]0.0069[/C][C]0.0107[/C][/ROW]
[ROW][C]85[/C][C]528[/C][C]455.4984[/C][C]405.8538[/C][C]511.2156[/C][C]0.0054[/C][C]0.0167[/C][C]0.0153[/C][C]0.0276[/C][/ROW]
[ROW][C]86[/C][C]533[/C][C]445.7551[/C][C]392.8174[/C][C]505.8269[/C][C]0.0022[/C][C]0.0036[/C][C]0.0211[/C][C]0.018[/C][/ROW]
[ROW][C]87[/C][C]536[/C][C]431.9521[/C][C]376.814[/C][C]495.1585[/C][C]6e-04[/C][C]9e-04[/C][C]0.0292[/C][C]0.0078[/C][/ROW]
[ROW][C]88[/C][C]537[/C][C]427.0805[/C][C]369.0652[/C][C]494.2154[/C][C]7e-04[/C][C]7e-04[/C][C]0.0331[/C][C]0.0077[/C][/ROW]
[ROW][C]89[/C][C]524[/C][C]414.9014[/C][C]355.3772[/C][C]484.3956[/C][C]0.001[/C][C]3e-04[/C][C]0.0635[/C][C]0.0037[/C][/ROW]
[ROW][C]90[/C][C]536[/C][C]405.1581[/C][C]344.1352[/C][C]477.0017[/C][C]2e-04[/C][C]6e-04[/C][C]0.0234[/C][C]0.0021[/C][/ROW]
[ROW][C]91[/C][C]587[/C][C]450.6268[/C][C]379.7165[/C][C]534.7792[/C][C]7e-04[/C][C]0.0234[/C][C]0.0358[/C][C]0.0834[/C][/ROW]
[ROW][C]92[/C][C]597[/C][C]458.7462[/C][C]383.625[/C][C]548.5774[/C][C]0.0013[/C][C]0.0026[/C][C]0.0503[/C][C]0.1317[/C][/ROW]
[ROW][C]93[/C][C]581[/C][C]440.0715[/C][C]365.3298[/C][C]530.1045[/C][C]0.0011[/C][C]3e-04[/C][C]0.0449[/C][C]0.064[/C][/ROW]
[ROW][C]94[/C][C]564[/C][C]427.8924[/C][C]352.731[/C][C]519.0696[/C][C]0.0017[/C][C]5e-04[/C][C]0.0466[/C][C]0.0388[/C][/ROW]
[ROW][C]95[/C][C]558[/C][C]414.0894[/C][C]339.0452[/C][C]505.7439[/C][C]0.001[/C][C]7e-04[/C][C]0.0301[/C][C]0.0201[/C][/ROW]
[/TABLE]
Source: https://freestatistics.org/blog/index.php?pk=69484&T=1

Globally Unique Identifier (entire table): ba.freestatistics.org/blog/index.php?pk=69484&T=1

As an alternative you can also use a QR Code:  

The GUIDs for individual cells are displayed in the table below:

Univariate ARIMA Extrapolation Forecast
timeY[t]F[t]95% LB95% UBp-value(H0: Y[t] = F[t])P(F[t]>Y[t-1])P(F[t]>Y[t-s])P(F[t]>Y[71])
59566-------
60557-------
61561-------
62549-------
63532-------
64526-------
65511-------
66499-------
67555-------
68565-------
69542-------
70527-------
71510-------
72514501.9489.1526514.97950.03490.112400.1124
73517505.5043487.4119524.26830.11490.187400.3193
74508494.6914473.0822517.28760.12420.026500.0921
75493479.3731455.2694504.75290.14630.013500.009
76490473.9666447.3975502.11350.13210.09251e-040.0061
77469460.4504432.2491490.49170.28850.02695e-046e-04
78478449.6375419.9639481.40780.04010.11610.00121e-04
79528500.0978464.8953537.96590.07430.87360.00220.3041
80534509.1086471.1792550.09130.11690.18310.00380.483
81518488.3838450.108529.91460.08110.01570.00570.1538
82506474.8677435.91517.3070.07520.02320.0080.0523
83502459.5494420.2447502.53010.02640.01710.01070.0107
84516452.2506407.9048501.41750.00550.02370.00690.0107
85528455.4984405.8538511.21560.00540.01670.01530.0276
86533445.7551392.8174505.82690.00220.00360.02110.018
87536431.9521376.814495.15856e-049e-040.02920.0078
88537427.0805369.0652494.21547e-047e-040.03310.0077
89524414.9014355.3772484.39560.0013e-040.06350.0037
90536405.1581344.1352477.00172e-046e-040.02340.0021
91587450.6268379.7165534.77927e-040.02340.03580.0834
92597458.7462383.625548.57740.00130.00260.05030.1317
93581440.0715365.3298530.10450.00113e-040.04490.064
94564427.8924352.731519.06960.00175e-040.04660.0388
95558414.0894339.0452505.74390.0017e-040.03010.0201


Univariate ARIMA Extrapolation Forecast Performance
time% S.E.PEMAPESq.EMSERMSE
720.01330.02410146.41100
730.01890.02270.0234132.1511139.281111.8017
740.02330.02690.0246177.1195151.893912.3245
750.0270.02840.0255185.6934160.343812.6627
760.03030.03380.0272257.0699179.68913.4048
770.03330.01860.025873.095161.923312.7249
780.0360.06310.0311804.4305253.710115.9283
790.03860.05580.0342778.5307319.312617.8693
800.04110.04890.0358619.5813352.675818.7797
810.04340.06060.0383877.1173405.1220.1276
820.04560.06560.0408969.2216456.401921.3636
830.04770.09240.04511802.0565568.539823.8441
840.05550.1410.05254063.9858837.420328.9382
850.06240.15920.06015256.48311153.067633.9568
860.06880.19570.06917611.67061583.641239.795
870.07470.24090.079910825.95942161.28646.4896
880.08020.25740.090312082.29892744.87552.3916
890.08550.2630.099911902.50723253.632457.0406
900.09050.32290.111617119.60113983.420263.1143
910.09530.30260.121218597.66294714.132368.6595
920.09990.30140.129819114.12635399.846373.4836
930.10440.32020.138419860.83356057.163977.8278
940.10870.31810.146218525.27096599.255581.2358
950.11290.34750.154620710.24717187.213584.7774

\begin{tabular}{lllllllll}
\hline
Univariate ARIMA Extrapolation Forecast Performance \tabularnewline
time & % S.E. & PE & MAPE & Sq.E & MSE & RMSE \tabularnewline
72 & 0.0133 & 0.0241 & 0 & 146.411 & 0 & 0 \tabularnewline
73 & 0.0189 & 0.0227 & 0.0234 & 132.1511 & 139.2811 & 11.8017 \tabularnewline
74 & 0.0233 & 0.0269 & 0.0246 & 177.1195 & 151.8939 & 12.3245 \tabularnewline
75 & 0.027 & 0.0284 & 0.0255 & 185.6934 & 160.3438 & 12.6627 \tabularnewline
76 & 0.0303 & 0.0338 & 0.0272 & 257.0699 & 179.689 & 13.4048 \tabularnewline
77 & 0.0333 & 0.0186 & 0.0258 & 73.095 & 161.9233 & 12.7249 \tabularnewline
78 & 0.036 & 0.0631 & 0.0311 & 804.4305 & 253.7101 & 15.9283 \tabularnewline
79 & 0.0386 & 0.0558 & 0.0342 & 778.5307 & 319.3126 & 17.8693 \tabularnewline
80 & 0.0411 & 0.0489 & 0.0358 & 619.5813 & 352.6758 & 18.7797 \tabularnewline
81 & 0.0434 & 0.0606 & 0.0383 & 877.1173 & 405.12 & 20.1276 \tabularnewline
82 & 0.0456 & 0.0656 & 0.0408 & 969.2216 & 456.4019 & 21.3636 \tabularnewline
83 & 0.0477 & 0.0924 & 0.0451 & 1802.0565 & 568.5398 & 23.8441 \tabularnewline
84 & 0.0555 & 0.141 & 0.0525 & 4063.9858 & 837.4203 & 28.9382 \tabularnewline
85 & 0.0624 & 0.1592 & 0.0601 & 5256.4831 & 1153.0676 & 33.9568 \tabularnewline
86 & 0.0688 & 0.1957 & 0.0691 & 7611.6706 & 1583.6412 & 39.795 \tabularnewline
87 & 0.0747 & 0.2409 & 0.0799 & 10825.9594 & 2161.286 & 46.4896 \tabularnewline
88 & 0.0802 & 0.2574 & 0.0903 & 12082.2989 & 2744.875 & 52.3916 \tabularnewline
89 & 0.0855 & 0.263 & 0.0999 & 11902.5072 & 3253.6324 & 57.0406 \tabularnewline
90 & 0.0905 & 0.3229 & 0.1116 & 17119.6011 & 3983.4202 & 63.1143 \tabularnewline
91 & 0.0953 & 0.3026 & 0.1212 & 18597.6629 & 4714.1323 & 68.6595 \tabularnewline
92 & 0.0999 & 0.3014 & 0.1298 & 19114.1263 & 5399.8463 & 73.4836 \tabularnewline
93 & 0.1044 & 0.3202 & 0.1384 & 19860.8335 & 6057.1639 & 77.8278 \tabularnewline
94 & 0.1087 & 0.3181 & 0.1462 & 18525.2709 & 6599.2555 & 81.2358 \tabularnewline
95 & 0.1129 & 0.3475 & 0.1546 & 20710.2471 & 7187.2135 & 84.7774 \tabularnewline
\hline
\end{tabular}
%Source: https://freestatistics.org/blog/index.php?pk=69484&T=2

[TABLE]
[ROW][C]Univariate ARIMA Extrapolation Forecast Performance[/C][/ROW]
[ROW][C]time[/C][C]% S.E.[/C][C]PE[/C][C]MAPE[/C][C]Sq.E[/C][C]MSE[/C][C]RMSE[/C][/ROW]
[ROW][C]72[/C][C]0.0133[/C][C]0.0241[/C][C]0[/C][C]146.411[/C][C]0[/C][C]0[/C][/ROW]
[ROW][C]73[/C][C]0.0189[/C][C]0.0227[/C][C]0.0234[/C][C]132.1511[/C][C]139.2811[/C][C]11.8017[/C][/ROW]
[ROW][C]74[/C][C]0.0233[/C][C]0.0269[/C][C]0.0246[/C][C]177.1195[/C][C]151.8939[/C][C]12.3245[/C][/ROW]
[ROW][C]75[/C][C]0.027[/C][C]0.0284[/C][C]0.0255[/C][C]185.6934[/C][C]160.3438[/C][C]12.6627[/C][/ROW]
[ROW][C]76[/C][C]0.0303[/C][C]0.0338[/C][C]0.0272[/C][C]257.0699[/C][C]179.689[/C][C]13.4048[/C][/ROW]
[ROW][C]77[/C][C]0.0333[/C][C]0.0186[/C][C]0.0258[/C][C]73.095[/C][C]161.9233[/C][C]12.7249[/C][/ROW]
[ROW][C]78[/C][C]0.036[/C][C]0.0631[/C][C]0.0311[/C][C]804.4305[/C][C]253.7101[/C][C]15.9283[/C][/ROW]
[ROW][C]79[/C][C]0.0386[/C][C]0.0558[/C][C]0.0342[/C][C]778.5307[/C][C]319.3126[/C][C]17.8693[/C][/ROW]
[ROW][C]80[/C][C]0.0411[/C][C]0.0489[/C][C]0.0358[/C][C]619.5813[/C][C]352.6758[/C][C]18.7797[/C][/ROW]
[ROW][C]81[/C][C]0.0434[/C][C]0.0606[/C][C]0.0383[/C][C]877.1173[/C][C]405.12[/C][C]20.1276[/C][/ROW]
[ROW][C]82[/C][C]0.0456[/C][C]0.0656[/C][C]0.0408[/C][C]969.2216[/C][C]456.4019[/C][C]21.3636[/C][/ROW]
[ROW][C]83[/C][C]0.0477[/C][C]0.0924[/C][C]0.0451[/C][C]1802.0565[/C][C]568.5398[/C][C]23.8441[/C][/ROW]
[ROW][C]84[/C][C]0.0555[/C][C]0.141[/C][C]0.0525[/C][C]4063.9858[/C][C]837.4203[/C][C]28.9382[/C][/ROW]
[ROW][C]85[/C][C]0.0624[/C][C]0.1592[/C][C]0.0601[/C][C]5256.4831[/C][C]1153.0676[/C][C]33.9568[/C][/ROW]
[ROW][C]86[/C][C]0.0688[/C][C]0.1957[/C][C]0.0691[/C][C]7611.6706[/C][C]1583.6412[/C][C]39.795[/C][/ROW]
[ROW][C]87[/C][C]0.0747[/C][C]0.2409[/C][C]0.0799[/C][C]10825.9594[/C][C]2161.286[/C][C]46.4896[/C][/ROW]
[ROW][C]88[/C][C]0.0802[/C][C]0.2574[/C][C]0.0903[/C][C]12082.2989[/C][C]2744.875[/C][C]52.3916[/C][/ROW]
[ROW][C]89[/C][C]0.0855[/C][C]0.263[/C][C]0.0999[/C][C]11902.5072[/C][C]3253.6324[/C][C]57.0406[/C][/ROW]
[ROW][C]90[/C][C]0.0905[/C][C]0.3229[/C][C]0.1116[/C][C]17119.6011[/C][C]3983.4202[/C][C]63.1143[/C][/ROW]
[ROW][C]91[/C][C]0.0953[/C][C]0.3026[/C][C]0.1212[/C][C]18597.6629[/C][C]4714.1323[/C][C]68.6595[/C][/ROW]
[ROW][C]92[/C][C]0.0999[/C][C]0.3014[/C][C]0.1298[/C][C]19114.1263[/C][C]5399.8463[/C][C]73.4836[/C][/ROW]
[ROW][C]93[/C][C]0.1044[/C][C]0.3202[/C][C]0.1384[/C][C]19860.8335[/C][C]6057.1639[/C][C]77.8278[/C][/ROW]
[ROW][C]94[/C][C]0.1087[/C][C]0.3181[/C][C]0.1462[/C][C]18525.2709[/C][C]6599.2555[/C][C]81.2358[/C][/ROW]
[ROW][C]95[/C][C]0.1129[/C][C]0.3475[/C][C]0.1546[/C][C]20710.2471[/C][C]7187.2135[/C][C]84.7774[/C][/ROW]
[/TABLE]
Source: https://freestatistics.org/blog/index.php?pk=69484&T=2

Globally Unique Identifier (entire table): ba.freestatistics.org/blog/index.php?pk=69484&T=2

As an alternative you can also use a QR Code:  

The GUIDs for individual cells are displayed in the table below:

Univariate ARIMA Extrapolation Forecast Performance
time% S.E.PEMAPESq.EMSERMSE
720.01330.02410146.41100
730.01890.02270.0234132.1511139.281111.8017
740.02330.02690.0246177.1195151.893912.3245
750.0270.02840.0255185.6934160.343812.6627
760.03030.03380.0272257.0699179.68913.4048
770.03330.01860.025873.095161.923312.7249
780.0360.06310.0311804.4305253.710115.9283
790.03860.05580.0342778.5307319.312617.8693
800.04110.04890.0358619.5813352.675818.7797
810.04340.06060.0383877.1173405.1220.1276
820.04560.06560.0408969.2216456.401921.3636
830.04770.09240.04511802.0565568.539823.8441
840.05550.1410.05254063.9858837.420328.9382
850.06240.15920.06015256.48311153.067633.9568
860.06880.19570.06917611.67061583.641239.795
870.07470.24090.079910825.95942161.28646.4896
880.08020.25740.090312082.29892744.87552.3916
890.08550.2630.099911902.50723253.632457.0406
900.09050.32290.111617119.60113983.420263.1143
910.09530.30260.121218597.66294714.132368.6595
920.09990.30140.129819114.12635399.846373.4836
930.10440.32020.138419860.83356057.163977.8278
940.10870.31810.146218525.27096599.255581.2358
950.11290.34750.154620710.24717187.213584.7774


Parameters (Session):
par1 = 24 ; par2 = 0.0 ; par3 = 1 ; par4 = 1 ; par5 = 12 ; par6 = 1 ; par7 = 0 ; par8 = 0 ; par9 = 0 ; par10 = FALSE ;
Parameters (R input):
par1 = 24 ; par2 = 0.0 ; par3 = 1 ; par4 = 1 ; par5 = 12 ; par6 = 1 ; par7 = 0 ; par8 = 0 ; par9 = 0 ; par10 = FALSE ;
R code (references can be found in the software module):
par1 <- as.numeric(par1) #cut off periods
par2 <- as.numeric(par2) #lambda
par3 <- as.numeric(par3) #degree of non-seasonal differencing
par4 <- as.numeric(par4) #degree of seasonal differencing
par5 <- as.numeric(par5) #seasonal period
par6 <- as.numeric(par6) #p
par7 <- as.numeric(par7) #q
par8 <- as.numeric(par8) #P
par9 <- as.numeric(par9) #Q
if (par10 == 'TRUE') par10 <- TRUE
if (par10 == 'FALSE') par10 <- FALSE
if (par2 == 0) x <- log(x)
if (par2 != 0) x <- x^par2
lx <- length(x)
first <- lx - 2*par1
nx <- lx - par1
nx1 <- nx + 1
fx <- lx - nx
if (fx < 1) {
fx <- par5
nx1 <- lx + fx - 1
first <- lx - 2*fx
}
first <- 1
if (fx < 3) fx <- round(lx/10,0)
(arima.out <- arima(x[1:nx], order=c(par6,par3,par7), seasonal=list(order=c(par8,par4,par9), period=par5), include.mean=par10, method='ML'))
(forecast <- predict(arima.out,par1))
(lb <- forecast$pred - 1.96 * forecast$se)
(ub <- forecast$pred + 1.96 * forecast$se)
if (par2 == 0) {
x <- exp(x)
forecast$pred <- exp(forecast$pred)
lb <- exp(lb)
ub <- exp(ub)
}
if (par2 != 0) {
x <- x^(1/par2)
forecast$pred <- forecast$pred^(1/par2)
lb <- lb^(1/par2)
ub <- ub^(1/par2)
}
if (par2 < 0) {
olb <- lb
lb <- ub
ub <- olb
}
(actandfor <- c(x[1:nx], forecast$pred))
(perc.se <- (ub-forecast$pred)/1.96/forecast$pred)
bitmap(file='test1.png')
opar <- par(mar=c(4,4,2,2),las=1)
ylim <- c( min(x[first:nx],lb), max(x[first:nx],ub))
plot(x,ylim=ylim,type='n',xlim=c(first,lx))
usr <- par('usr')
rect(usr[1],usr[3],nx+1,usr[4],border=NA,col='lemonchiffon')
rect(nx1,usr[3],usr[2],usr[4],border=NA,col='lavender')
abline(h= (-3:3)*2 , col ='gray', lty =3)
polygon( c(nx1:lx,lx:nx1), c(lb,rev(ub)), col = 'orange', lty=2,border=NA)
lines(nx1:lx, lb , lty=2)
lines(nx1:lx, ub , lty=2)
lines(x, lwd=2)
lines(nx1:lx, forecast$pred , lwd=2 , col ='white')
box()
par(opar)
dev.off()
prob.dec <- array(NA, dim=fx)
prob.sdec <- array(NA, dim=fx)
prob.ldec <- array(NA, dim=fx)
prob.pval <- array(NA, dim=fx)
perf.pe <- array(0, dim=fx)
perf.mape <- array(0, dim=fx)
perf.mape1 <- array(0, dim=fx)
perf.se <- array(0, dim=fx)
perf.mse <- array(0, dim=fx)
perf.mse1 <- array(0, dim=fx)
perf.rmse <- array(0, dim=fx)
for (i in 1:fx) {
locSD <- (ub[i] - forecast$pred[i]) / 1.96
perf.pe[i] = (x[nx+i] - forecast$pred[i]) / forecast$pred[i]
perf.se[i] = (x[nx+i] - forecast$pred[i])^2
prob.dec[i] = pnorm((x[nx+i-1] - forecast$pred[i]) / locSD)
prob.sdec[i] = pnorm((x[nx+i-par5] - forecast$pred[i]) / locSD)
prob.ldec[i] = pnorm((x[nx] - forecast$pred[i]) / locSD)
prob.pval[i] = pnorm(abs(x[nx+i] - forecast$pred[i]) / locSD)
}
perf.mape[1] = abs(perf.pe[1])
perf.mse[1] = abs(perf.se[1])
for (i in 2:fx) {
perf.mape[i] = perf.mape[i-1] + abs(perf.pe[i])
perf.mape1[i] = perf.mape[i] / i
perf.mse[i] = perf.mse[i-1] + perf.se[i]
perf.mse1[i] = perf.mse[i] / i
}
perf.rmse = sqrt(perf.mse1)
bitmap(file='test2.png')
plot(forecast$pred, pch=19, type='b',main='ARIMA Extrapolation Forecast', ylab='Forecast and 95% CI', xlab='time',ylim=c(min(lb),max(ub)))
dum <- forecast$pred
dum[1:par1] <- x[(nx+1):lx]
lines(dum, lty=1)
lines(ub,lty=3)
lines(lb,lty=3)
dev.off()
load(file='createtable')
a<-table.start()
a<-table.row.start(a)
a<-table.element(a,'Univariate ARIMA Extrapolation Forecast',9,TRUE)
a<-table.row.end(a)
a<-table.row.start(a)
a<-table.element(a,'time',1,header=TRUE)
a<-table.element(a,'Y[t]',1,header=TRUE)
a<-table.element(a,'F[t]',1,header=TRUE)
a<-table.element(a,'95% LB',1,header=TRUE)
a<-table.element(a,'95% UB',1,header=TRUE)
a<-table.element(a,'p-value
(H0: Y[t] = F[t])',1,header=TRUE)
a<-table.element(a,'P(F[t]>Y[t-1])',1,header=TRUE)
a<-table.element(a,'P(F[t]>Y[t-s])',1,header=TRUE)
mylab <- paste('P(F[t]>Y[',nx,sep='')
mylab <- paste(mylab,'])',sep='')
a<-table.element(a,mylab,1,header=TRUE)
a<-table.row.end(a)
for (i in (nx-par5):nx) {
a<-table.row.start(a)
a<-table.element(a,i,header=TRUE)
a<-table.element(a,x[i])
a<-table.element(a,'-')
a<-table.row.end(a)
}
for (i in 1:fx) {
a<-table.row.start(a)
a<-table.element(a,nx+i,header=TRUE)
a<-table.element(a,round(x[nx+i],4))
a<-table.element(a,round(forecast$pred[i],4))
a<-table.element(a,round(lb[i],4))
a<-table.element(a,round(ub[i],4))
a<-table.element(a,round((1-prob.pval[i]),4))
a<-table.element(a,round((1-prob.dec[i]),4))
a<-table.element(a,round((1-prob.sdec[i]),4))
a<-table.element(a,round((1-prob.ldec[i]),4))
a<-table.row.end(a)
}
a<-table.end(a)
table.save(a,file='mytable.tab')
a<-table.start()
a<-table.row.start(a)
a<-table.element(a,'Univariate ARIMA Extrapolation Forecast Performance',7,TRUE)
a<-table.row.end(a)
a<-table.row.start(a)
a<-table.element(a,'time',1,header=TRUE)
a<-table.element(a,'% S.E.',1,header=TRUE)
a<-table.element(a,'PE',1,header=TRUE)
a<-table.element(a,'MAPE',1,header=TRUE)
a<-table.element(a,'Sq.E',1,header=TRUE)
a<-table.element(a,'MSE',1,header=TRUE)
a<-table.element(a,'RMSE',1,header=TRUE)
a<-table.row.end(a)
for (i in 1:fx) {
a<-table.row.start(a)
a<-table.element(a,nx+i,header=TRUE)
a<-table.element(a,round(perc.se[i],4))
a<-table.element(a,round(perf.pe[i],4))
a<-table.element(a,round(perf.mape1[i],4))
a<-table.element(a,round(perf.se[i],4))
a<-table.element(a,round(perf.mse1[i],4))
a<-table.element(a,round(perf.rmse[i],4))
a<-table.row.end(a)
}
a<-table.end(a)
table.save(a,file='mytable1.tab')