Free Statistics

of Irreproducible Research!

Author's title

Author*The author of this computation has been verified*
R Software Modulerwasp_autocorrelation.wasp
Title produced by software(Partial) Autocorrelation Function
Date of computationSat, 19 Dec 2009 04:29:26 -0700
Cite this page as followsStatistical Computations at FreeStatistics.org, Office for Research Development and Education, URL https://freestatistics.org/blog/index.php?v=date/2009/Dec/19/t1261222196csbs2sz7xebe1xa.htm/, Retrieved Fri, 03 May 2024 00:32:37 +0000
Statistical Computations at FreeStatistics.org, Office for Research Development and Education, URL https://freestatistics.org/blog/index.php?pk=69512, Retrieved Fri, 03 May 2024 00:32:37 +0000
QR Codes:

Original text written by user:
IsPrivate?No (this computation is public)
User-defined keywords
Estimated Impact138
Family? (F = Feedback message, R = changed R code, M = changed R Module, P = changed Parameters, D = changed Data)
-     [(Partial) Autocorrelation Function] [Identifying integ...] [2009-11-23 18:42:00] [d46757a0a8c9b00540ab7e7e0c34bfc4]
-    D  [(Partial) Autocorrelation Function] [ACF met: d=1, D=0...] [2009-12-03 22:52:29] [34d27ebe78dc2d31581e8710befe8733]
-   P     [(Partial) Autocorrelation Function] [ACF met: d=0, D=1...] [2009-12-04 14:13:45] [34d27ebe78dc2d31581e8710befe8733]
-    D      [(Partial) Autocorrelation Function] [ACF met: d=0, D=1...] [2009-12-16 22:43:21] [34d27ebe78dc2d31581e8710befe8733]
-               [(Partial) Autocorrelation Function] [ACF met: d=1, D=0...] [2009-12-19 11:29:26] [371dc2189c569d90e2c1567f632c3ec0] [Current]
Feedback Forum

Post a new message
Dataseries X:
441
449
452
462
455
461
461
463
462
456
455
456
472
472
471
465
459
465
468
467
463
460
462
461
476
476
471
453
443
442
444
438
427
424
416
406
431
434
418
412
404
409
412
406
398
397
385
390
413
413
401
397
397
409
419
424
428
430
424
433
456


Summary of computational transaction
Raw Inputview raw input (R code)
Raw Outputview raw output of R engine
Computing time1 seconds
R Server'Gwilym Jenkins' @ 72.249.127.135

\begin{tabular}{lllllllll}
\hline
Summary of computational transaction \tabularnewline
Raw Input & view raw input (R code)  \tabularnewline
Raw Output & view raw output of R engine  \tabularnewline
Computing time & 1 seconds \tabularnewline
R Server & 'Gwilym Jenkins' @ 72.249.127.135 \tabularnewline
\hline
\end{tabular}
%Source: https://freestatistics.org/blog/index.php?pk=69512&T=0

[TABLE]
[ROW][C]Summary of computational transaction[/C][/ROW]
[ROW][C]Raw Input[/C][C]view raw input (R code) [/C][/ROW]
[ROW][C]Raw Output[/C][C]view raw output of R engine [/C][/ROW]
[ROW][C]Computing time[/C][C]1 seconds[/C][/ROW]
[ROW][C]R Server[/C][C]'Gwilym Jenkins' @ 72.249.127.135[/C][/ROW]
[/TABLE]
Source: https://freestatistics.org/blog/index.php?pk=69512&T=0

Globally Unique Identifier (entire table): ba.freestatistics.org/blog/index.php?pk=69512&T=0

As an alternative you can also use a QR Code:  

The GUIDs for individual cells are displayed in the table below:

Summary of computational transaction
Raw Inputview raw input (R code)
Raw Outputview raw output of R engine
Computing time1 seconds
R Server'Gwilym Jenkins' @ 72.249.127.135


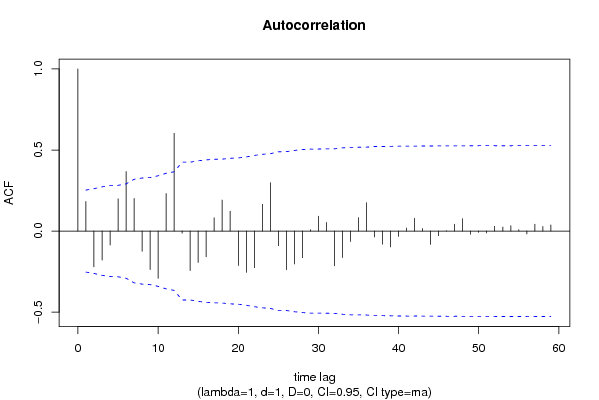
Autocorrelation Function
Time lag kACF(k)T-STATP-value
10.1818731.40880.08203
2-0.220581-1.70860.046346
3-0.178471-1.38240.085982
4-0.086299-0.66850.253199
50.1989391.5410.064291
60.3670412.84310.003049
70.2015581.56130.061861
8-0.124912-0.96760.168573
9-0.237579-1.84030.035337
10-0.291435-2.25740.013816
110.2311521.79050.039209
120.6031214.67189e-06
13-0.013461-0.10430.458653
14-0.243965-1.88970.031813
15-0.193106-1.49580.069974
16-0.158719-1.22940.111855
170.0818030.63360.26436
180.1913651.48230.071746
190.122550.94930.173147
20-0.212237-1.6440.052705
21-0.254752-1.97330.026536
22-0.226036-1.75090.04254
230.1661851.28730.101473
240.2986982.31370.012063
25-0.090309-0.69950.243462
26-0.239321-1.85380.034345
27-0.202503-1.56860.061002
28-0.164335-1.27290.103975
290.0082490.06390.474632
300.0920510.7130.239299
310.053370.41340.340393
32-0.214506-1.66160.05091
33-0.163161-1.26380.105588
34-0.064346-0.49840.310004
350.0836660.64810.259704
360.1750821.35620.090062
37-0.03652-0.28290.389119
38-0.081304-0.62980.265616
39-0.097951-0.75870.225495
40-0.033321-0.25810.398606
410.0183480.14210.443729
420.0791430.6130.271082
430.0161070.12480.450564
44-0.082087-0.63580.263649
45-0.028258-0.21890.413742
460.0016470.01280.494931
470.0422450.32720.372317
480.076740.59440.27723
49-0.019401-0.15030.440524
50-0.007696-0.05960.476332
51-0.011219-0.08690.465518
520.029270.22670.410703
530.0246670.19110.424559
540.0332940.25790.398686
550.0087080.06750.473222
56-0.017983-0.13930.44484
570.042650.33040.371137
580.0281630.21820.414025
590.0380870.2950.384499
60NANANA

\begin{tabular}{lllllllll}
\hline
Autocorrelation Function \tabularnewline
Time lag k & ACF(k) & T-STAT & P-value \tabularnewline
1 & 0.181873 & 1.4088 & 0.08203 \tabularnewline
2 & -0.220581 & -1.7086 & 0.046346 \tabularnewline
3 & -0.178471 & -1.3824 & 0.085982 \tabularnewline
4 & -0.086299 & -0.6685 & 0.253199 \tabularnewline
5 & 0.198939 & 1.541 & 0.064291 \tabularnewline
6 & 0.367041 & 2.8431 & 0.003049 \tabularnewline
7 & 0.201558 & 1.5613 & 0.061861 \tabularnewline
8 & -0.124912 & -0.9676 & 0.168573 \tabularnewline
9 & -0.237579 & -1.8403 & 0.035337 \tabularnewline
10 & -0.291435 & -2.2574 & 0.013816 \tabularnewline
11 & 0.231152 & 1.7905 & 0.039209 \tabularnewline
12 & 0.603121 & 4.6718 & 9e-06 \tabularnewline
13 & -0.013461 & -0.1043 & 0.458653 \tabularnewline
14 & -0.243965 & -1.8897 & 0.031813 \tabularnewline
15 & -0.193106 & -1.4958 & 0.069974 \tabularnewline
16 & -0.158719 & -1.2294 & 0.111855 \tabularnewline
17 & 0.081803 & 0.6336 & 0.26436 \tabularnewline
18 & 0.191365 & 1.4823 & 0.071746 \tabularnewline
19 & 0.12255 & 0.9493 & 0.173147 \tabularnewline
20 & -0.212237 & -1.644 & 0.052705 \tabularnewline
21 & -0.254752 & -1.9733 & 0.026536 \tabularnewline
22 & -0.226036 & -1.7509 & 0.04254 \tabularnewline
23 & 0.166185 & 1.2873 & 0.101473 \tabularnewline
24 & 0.298698 & 2.3137 & 0.012063 \tabularnewline
25 & -0.090309 & -0.6995 & 0.243462 \tabularnewline
26 & -0.239321 & -1.8538 & 0.034345 \tabularnewline
27 & -0.202503 & -1.5686 & 0.061002 \tabularnewline
28 & -0.164335 & -1.2729 & 0.103975 \tabularnewline
29 & 0.008249 & 0.0639 & 0.474632 \tabularnewline
30 & 0.092051 & 0.713 & 0.239299 \tabularnewline
31 & 0.05337 & 0.4134 & 0.340393 \tabularnewline
32 & -0.214506 & -1.6616 & 0.05091 \tabularnewline
33 & -0.163161 & -1.2638 & 0.105588 \tabularnewline
34 & -0.064346 & -0.4984 & 0.310004 \tabularnewline
35 & 0.083666 & 0.6481 & 0.259704 \tabularnewline
36 & 0.175082 & 1.3562 & 0.090062 \tabularnewline
37 & -0.03652 & -0.2829 & 0.389119 \tabularnewline
38 & -0.081304 & -0.6298 & 0.265616 \tabularnewline
39 & -0.097951 & -0.7587 & 0.225495 \tabularnewline
40 & -0.033321 & -0.2581 & 0.398606 \tabularnewline
41 & 0.018348 & 0.1421 & 0.443729 \tabularnewline
42 & 0.079143 & 0.613 & 0.271082 \tabularnewline
43 & 0.016107 & 0.1248 & 0.450564 \tabularnewline
44 & -0.082087 & -0.6358 & 0.263649 \tabularnewline
45 & -0.028258 & -0.2189 & 0.413742 \tabularnewline
46 & 0.001647 & 0.0128 & 0.494931 \tabularnewline
47 & 0.042245 & 0.3272 & 0.372317 \tabularnewline
48 & 0.07674 & 0.5944 & 0.27723 \tabularnewline
49 & -0.019401 & -0.1503 & 0.440524 \tabularnewline
50 & -0.007696 & -0.0596 & 0.476332 \tabularnewline
51 & -0.011219 & -0.0869 & 0.465518 \tabularnewline
52 & 0.02927 & 0.2267 & 0.410703 \tabularnewline
53 & 0.024667 & 0.1911 & 0.424559 \tabularnewline
54 & 0.033294 & 0.2579 & 0.398686 \tabularnewline
55 & 0.008708 & 0.0675 & 0.473222 \tabularnewline
56 & -0.017983 & -0.1393 & 0.44484 \tabularnewline
57 & 0.04265 & 0.3304 & 0.371137 \tabularnewline
58 & 0.028163 & 0.2182 & 0.414025 \tabularnewline
59 & 0.038087 & 0.295 & 0.384499 \tabularnewline
60 & NA & NA & NA \tabularnewline
\hline
\end{tabular}
%Source: https://freestatistics.org/blog/index.php?pk=69512&T=1

[TABLE]
[ROW][C]Autocorrelation Function[/C][/ROW]
[ROW][C]Time lag k[/C][C]ACF(k)[/C][C]T-STAT[/C][C]P-value[/C][/ROW]
[ROW][C]1[/C][C]0.181873[/C][C]1.4088[/C][C]0.08203[/C][/ROW]
[ROW][C]2[/C][C]-0.220581[/C][C]-1.7086[/C][C]0.046346[/C][/ROW]
[ROW][C]3[/C][C]-0.178471[/C][C]-1.3824[/C][C]0.085982[/C][/ROW]
[ROW][C]4[/C][C]-0.086299[/C][C]-0.6685[/C][C]0.253199[/C][/ROW]
[ROW][C]5[/C][C]0.198939[/C][C]1.541[/C][C]0.064291[/C][/ROW]
[ROW][C]6[/C][C]0.367041[/C][C]2.8431[/C][C]0.003049[/C][/ROW]
[ROW][C]7[/C][C]0.201558[/C][C]1.5613[/C][C]0.061861[/C][/ROW]
[ROW][C]8[/C][C]-0.124912[/C][C]-0.9676[/C][C]0.168573[/C][/ROW]
[ROW][C]9[/C][C]-0.237579[/C][C]-1.8403[/C][C]0.035337[/C][/ROW]
[ROW][C]10[/C][C]-0.291435[/C][C]-2.2574[/C][C]0.013816[/C][/ROW]
[ROW][C]11[/C][C]0.231152[/C][C]1.7905[/C][C]0.039209[/C][/ROW]
[ROW][C]12[/C][C]0.603121[/C][C]4.6718[/C][C]9e-06[/C][/ROW]
[ROW][C]13[/C][C]-0.013461[/C][C]-0.1043[/C][C]0.458653[/C][/ROW]
[ROW][C]14[/C][C]-0.243965[/C][C]-1.8897[/C][C]0.031813[/C][/ROW]
[ROW][C]15[/C][C]-0.193106[/C][C]-1.4958[/C][C]0.069974[/C][/ROW]
[ROW][C]16[/C][C]-0.158719[/C][C]-1.2294[/C][C]0.111855[/C][/ROW]
[ROW][C]17[/C][C]0.081803[/C][C]0.6336[/C][C]0.26436[/C][/ROW]
[ROW][C]18[/C][C]0.191365[/C][C]1.4823[/C][C]0.071746[/C][/ROW]
[ROW][C]19[/C][C]0.12255[/C][C]0.9493[/C][C]0.173147[/C][/ROW]
[ROW][C]20[/C][C]-0.212237[/C][C]-1.644[/C][C]0.052705[/C][/ROW]
[ROW][C]21[/C][C]-0.254752[/C][C]-1.9733[/C][C]0.026536[/C][/ROW]
[ROW][C]22[/C][C]-0.226036[/C][C]-1.7509[/C][C]0.04254[/C][/ROW]
[ROW][C]23[/C][C]0.166185[/C][C]1.2873[/C][C]0.101473[/C][/ROW]
[ROW][C]24[/C][C]0.298698[/C][C]2.3137[/C][C]0.012063[/C][/ROW]
[ROW][C]25[/C][C]-0.090309[/C][C]-0.6995[/C][C]0.243462[/C][/ROW]
[ROW][C]26[/C][C]-0.239321[/C][C]-1.8538[/C][C]0.034345[/C][/ROW]
[ROW][C]27[/C][C]-0.202503[/C][C]-1.5686[/C][C]0.061002[/C][/ROW]
[ROW][C]28[/C][C]-0.164335[/C][C]-1.2729[/C][C]0.103975[/C][/ROW]
[ROW][C]29[/C][C]0.008249[/C][C]0.0639[/C][C]0.474632[/C][/ROW]
[ROW][C]30[/C][C]0.092051[/C][C]0.713[/C][C]0.239299[/C][/ROW]
[ROW][C]31[/C][C]0.05337[/C][C]0.4134[/C][C]0.340393[/C][/ROW]
[ROW][C]32[/C][C]-0.214506[/C][C]-1.6616[/C][C]0.05091[/C][/ROW]
[ROW][C]33[/C][C]-0.163161[/C][C]-1.2638[/C][C]0.105588[/C][/ROW]
[ROW][C]34[/C][C]-0.064346[/C][C]-0.4984[/C][C]0.310004[/C][/ROW]
[ROW][C]35[/C][C]0.083666[/C][C]0.6481[/C][C]0.259704[/C][/ROW]
[ROW][C]36[/C][C]0.175082[/C][C]1.3562[/C][C]0.090062[/C][/ROW]
[ROW][C]37[/C][C]-0.03652[/C][C]-0.2829[/C][C]0.389119[/C][/ROW]
[ROW][C]38[/C][C]-0.081304[/C][C]-0.6298[/C][C]0.265616[/C][/ROW]
[ROW][C]39[/C][C]-0.097951[/C][C]-0.7587[/C][C]0.225495[/C][/ROW]
[ROW][C]40[/C][C]-0.033321[/C][C]-0.2581[/C][C]0.398606[/C][/ROW]
[ROW][C]41[/C][C]0.018348[/C][C]0.1421[/C][C]0.443729[/C][/ROW]
[ROW][C]42[/C][C]0.079143[/C][C]0.613[/C][C]0.271082[/C][/ROW]
[ROW][C]43[/C][C]0.016107[/C][C]0.1248[/C][C]0.450564[/C][/ROW]
[ROW][C]44[/C][C]-0.082087[/C][C]-0.6358[/C][C]0.263649[/C][/ROW]
[ROW][C]45[/C][C]-0.028258[/C][C]-0.2189[/C][C]0.413742[/C][/ROW]
[ROW][C]46[/C][C]0.001647[/C][C]0.0128[/C][C]0.494931[/C][/ROW]
[ROW][C]47[/C][C]0.042245[/C][C]0.3272[/C][C]0.372317[/C][/ROW]
[ROW][C]48[/C][C]0.07674[/C][C]0.5944[/C][C]0.27723[/C][/ROW]
[ROW][C]49[/C][C]-0.019401[/C][C]-0.1503[/C][C]0.440524[/C][/ROW]
[ROW][C]50[/C][C]-0.007696[/C][C]-0.0596[/C][C]0.476332[/C][/ROW]
[ROW][C]51[/C][C]-0.011219[/C][C]-0.0869[/C][C]0.465518[/C][/ROW]
[ROW][C]52[/C][C]0.02927[/C][C]0.2267[/C][C]0.410703[/C][/ROW]
[ROW][C]53[/C][C]0.024667[/C][C]0.1911[/C][C]0.424559[/C][/ROW]
[ROW][C]54[/C][C]0.033294[/C][C]0.2579[/C][C]0.398686[/C][/ROW]
[ROW][C]55[/C][C]0.008708[/C][C]0.0675[/C][C]0.473222[/C][/ROW]
[ROW][C]56[/C][C]-0.017983[/C][C]-0.1393[/C][C]0.44484[/C][/ROW]
[ROW][C]57[/C][C]0.04265[/C][C]0.3304[/C][C]0.371137[/C][/ROW]
[ROW][C]58[/C][C]0.028163[/C][C]0.2182[/C][C]0.414025[/C][/ROW]
[ROW][C]59[/C][C]0.038087[/C][C]0.295[/C][C]0.384499[/C][/ROW]
[ROW][C]60[/C][C]NA[/C][C]NA[/C][C]NA[/C][/ROW]
[/TABLE]
Source: https://freestatistics.org/blog/index.php?pk=69512&T=1

Globally Unique Identifier (entire table): ba.freestatistics.org/blog/index.php?pk=69512&T=1

As an alternative you can also use a QR Code:  

The GUIDs for individual cells are displayed in the table below:

Autocorrelation Function
Time lag kACF(k)T-STATP-value
10.1818731.40880.08203
2-0.220581-1.70860.046346
3-0.178471-1.38240.085982
4-0.086299-0.66850.253199
50.1989391.5410.064291
60.3670412.84310.003049
70.2015581.56130.061861
8-0.124912-0.96760.168573
9-0.237579-1.84030.035337
10-0.291435-2.25740.013816
110.2311521.79050.039209
120.6031214.67189e-06
13-0.013461-0.10430.458653
14-0.243965-1.88970.031813
15-0.193106-1.49580.069974
16-0.158719-1.22940.111855
170.0818030.63360.26436
180.1913651.48230.071746
190.122550.94930.173147
20-0.212237-1.6440.052705
21-0.254752-1.97330.026536
22-0.226036-1.75090.04254
230.1661851.28730.101473
240.2986982.31370.012063
25-0.090309-0.69950.243462
26-0.239321-1.85380.034345
27-0.202503-1.56860.061002
28-0.164335-1.27290.103975
290.0082490.06390.474632
300.0920510.7130.239299
310.053370.41340.340393
32-0.214506-1.66160.05091
33-0.163161-1.26380.105588
34-0.064346-0.49840.310004
350.0836660.64810.259704
360.1750821.35620.090062
37-0.03652-0.28290.389119
38-0.081304-0.62980.265616
39-0.097951-0.75870.225495
40-0.033321-0.25810.398606
410.0183480.14210.443729
420.0791430.6130.271082
430.0161070.12480.450564
44-0.082087-0.63580.263649
45-0.028258-0.21890.413742
460.0016470.01280.494931
470.0422450.32720.372317
480.076740.59440.27723
49-0.019401-0.15030.440524
50-0.007696-0.05960.476332
51-0.011219-0.08690.465518
520.029270.22670.410703
530.0246670.19110.424559
540.0332940.25790.398686
550.0087080.06750.473222
56-0.017983-0.13930.44484
570.042650.33040.371137
580.0281630.21820.414025
590.0380870.2950.384499
60NANANA


Partial Autocorrelation Function
Time lag kPACF(k)T-STATP-value
10.1818731.40880.08203
2-0.262337-2.03210.023291
3-0.088981-0.68920.246662
4-0.097025-0.75160.227629
50.1933261.49750.069753
60.2748442.12890.018687
70.1918351.48590.071264
8-0.018808-0.14570.44233
9-0.079247-0.61380.27082
10-0.328721-2.54630.006737
110.1963171.52070.066798
120.4174283.23340.000995
13-0.232995-1.80480.038065
14-0.074012-0.57330.284293
150.0085960.06660.473568
16-0.094874-0.73490.232634
17-0.10059-0.77920.219472
18-0.213079-1.65050.052033
190.0683890.52970.299124
20-0.127837-0.99020.163021
210.0970410.75170.227593
220.0228410.17690.430081
23-0.089004-0.68940.246609
24-0.053638-0.41550.339638
250.0202370.15680.437983
26-0.151613-1.17440.122439
27-0.062235-0.48210.315756
28-0.112795-0.87370.192881
29-0.000406-0.00310.498752
30-0.157943-1.22340.112978
310.027190.21060.416953
32-0.035236-0.27290.39292
330.0992860.76910.222436
340.0857770.66440.254481
35-0.084438-0.65410.257789
36-0.015932-0.12340.451099
370.0873560.67670.250613
380.0607510.47060.319825
390.0025290.01960.492217
40-0.03385-0.26220.397032
410.0061350.04750.481127
42-0.082464-0.63880.262705
43-0.098182-0.76050.224963
440.0513820.3980.346019
45-0.119623-0.92660.178924
46-0.062155-0.48150.315974
470.0550940.42680.335541
48-0.103282-0.80.213427
49-0.030561-0.23670.406839
50-0.013416-0.10390.458789
510.0508970.39420.3474
52-0.040493-0.31370.377435
53-0.008527-0.06610.473778
540.0814480.63090.265253
55-0.059638-0.4620.322892
56-0.077665-0.60160.274857
570.0091860.07120.471756
58-0.066686-0.51650.303686
590.0336210.26040.397714
60NANANA

\begin{tabular}{lllllllll}
\hline
Partial Autocorrelation Function \tabularnewline
Time lag k & PACF(k) & T-STAT & P-value \tabularnewline
1 & 0.181873 & 1.4088 & 0.08203 \tabularnewline
2 & -0.262337 & -2.0321 & 0.023291 \tabularnewline
3 & -0.088981 & -0.6892 & 0.246662 \tabularnewline
4 & -0.097025 & -0.7516 & 0.227629 \tabularnewline
5 & 0.193326 & 1.4975 & 0.069753 \tabularnewline
6 & 0.274844 & 2.1289 & 0.018687 \tabularnewline
7 & 0.191835 & 1.4859 & 0.071264 \tabularnewline
8 & -0.018808 & -0.1457 & 0.44233 \tabularnewline
9 & -0.079247 & -0.6138 & 0.27082 \tabularnewline
10 & -0.328721 & -2.5463 & 0.006737 \tabularnewline
11 & 0.196317 & 1.5207 & 0.066798 \tabularnewline
12 & 0.417428 & 3.2334 & 0.000995 \tabularnewline
13 & -0.232995 & -1.8048 & 0.038065 \tabularnewline
14 & -0.074012 & -0.5733 & 0.284293 \tabularnewline
15 & 0.008596 & 0.0666 & 0.473568 \tabularnewline
16 & -0.094874 & -0.7349 & 0.232634 \tabularnewline
17 & -0.10059 & -0.7792 & 0.219472 \tabularnewline
18 & -0.213079 & -1.6505 & 0.052033 \tabularnewline
19 & 0.068389 & 0.5297 & 0.299124 \tabularnewline
20 & -0.127837 & -0.9902 & 0.163021 \tabularnewline
21 & 0.097041 & 0.7517 & 0.227593 \tabularnewline
22 & 0.022841 & 0.1769 & 0.430081 \tabularnewline
23 & -0.089004 & -0.6894 & 0.246609 \tabularnewline
24 & -0.053638 & -0.4155 & 0.339638 \tabularnewline
25 & 0.020237 & 0.1568 & 0.437983 \tabularnewline
26 & -0.151613 & -1.1744 & 0.122439 \tabularnewline
27 & -0.062235 & -0.4821 & 0.315756 \tabularnewline
28 & -0.112795 & -0.8737 & 0.192881 \tabularnewline
29 & -0.000406 & -0.0031 & 0.498752 \tabularnewline
30 & -0.157943 & -1.2234 & 0.112978 \tabularnewline
31 & 0.02719 & 0.2106 & 0.416953 \tabularnewline
32 & -0.035236 & -0.2729 & 0.39292 \tabularnewline
33 & 0.099286 & 0.7691 & 0.222436 \tabularnewline
34 & 0.085777 & 0.6644 & 0.254481 \tabularnewline
35 & -0.084438 & -0.6541 & 0.257789 \tabularnewline
36 & -0.015932 & -0.1234 & 0.451099 \tabularnewline
37 & 0.087356 & 0.6767 & 0.250613 \tabularnewline
38 & 0.060751 & 0.4706 & 0.319825 \tabularnewline
39 & 0.002529 & 0.0196 & 0.492217 \tabularnewline
40 & -0.03385 & -0.2622 & 0.397032 \tabularnewline
41 & 0.006135 & 0.0475 & 0.481127 \tabularnewline
42 & -0.082464 & -0.6388 & 0.262705 \tabularnewline
43 & -0.098182 & -0.7605 & 0.224963 \tabularnewline
44 & 0.051382 & 0.398 & 0.346019 \tabularnewline
45 & -0.119623 & -0.9266 & 0.178924 \tabularnewline
46 & -0.062155 & -0.4815 & 0.315974 \tabularnewline
47 & 0.055094 & 0.4268 & 0.335541 \tabularnewline
48 & -0.103282 & -0.8 & 0.213427 \tabularnewline
49 & -0.030561 & -0.2367 & 0.406839 \tabularnewline
50 & -0.013416 & -0.1039 & 0.458789 \tabularnewline
51 & 0.050897 & 0.3942 & 0.3474 \tabularnewline
52 & -0.040493 & -0.3137 & 0.377435 \tabularnewline
53 & -0.008527 & -0.0661 & 0.473778 \tabularnewline
54 & 0.081448 & 0.6309 & 0.265253 \tabularnewline
55 & -0.059638 & -0.462 & 0.322892 \tabularnewline
56 & -0.077665 & -0.6016 & 0.274857 \tabularnewline
57 & 0.009186 & 0.0712 & 0.471756 \tabularnewline
58 & -0.066686 & -0.5165 & 0.303686 \tabularnewline
59 & 0.033621 & 0.2604 & 0.397714 \tabularnewline
60 & NA & NA & NA \tabularnewline
\hline
\end{tabular}
%Source: https://freestatistics.org/blog/index.php?pk=69512&T=2

[TABLE]
[ROW][C]Partial Autocorrelation Function[/C][/ROW]
[ROW][C]Time lag k[/C][C]PACF(k)[/C][C]T-STAT[/C][C]P-value[/C][/ROW]
[ROW][C]1[/C][C]0.181873[/C][C]1.4088[/C][C]0.08203[/C][/ROW]
[ROW][C]2[/C][C]-0.262337[/C][C]-2.0321[/C][C]0.023291[/C][/ROW]
[ROW][C]3[/C][C]-0.088981[/C][C]-0.6892[/C][C]0.246662[/C][/ROW]
[ROW][C]4[/C][C]-0.097025[/C][C]-0.7516[/C][C]0.227629[/C][/ROW]
[ROW][C]5[/C][C]0.193326[/C][C]1.4975[/C][C]0.069753[/C][/ROW]
[ROW][C]6[/C][C]0.274844[/C][C]2.1289[/C][C]0.018687[/C][/ROW]
[ROW][C]7[/C][C]0.191835[/C][C]1.4859[/C][C]0.071264[/C][/ROW]
[ROW][C]8[/C][C]-0.018808[/C][C]-0.1457[/C][C]0.44233[/C][/ROW]
[ROW][C]9[/C][C]-0.079247[/C][C]-0.6138[/C][C]0.27082[/C][/ROW]
[ROW][C]10[/C][C]-0.328721[/C][C]-2.5463[/C][C]0.006737[/C][/ROW]
[ROW][C]11[/C][C]0.196317[/C][C]1.5207[/C][C]0.066798[/C][/ROW]
[ROW][C]12[/C][C]0.417428[/C][C]3.2334[/C][C]0.000995[/C][/ROW]
[ROW][C]13[/C][C]-0.232995[/C][C]-1.8048[/C][C]0.038065[/C][/ROW]
[ROW][C]14[/C][C]-0.074012[/C][C]-0.5733[/C][C]0.284293[/C][/ROW]
[ROW][C]15[/C][C]0.008596[/C][C]0.0666[/C][C]0.473568[/C][/ROW]
[ROW][C]16[/C][C]-0.094874[/C][C]-0.7349[/C][C]0.232634[/C][/ROW]
[ROW][C]17[/C][C]-0.10059[/C][C]-0.7792[/C][C]0.219472[/C][/ROW]
[ROW][C]18[/C][C]-0.213079[/C][C]-1.6505[/C][C]0.052033[/C][/ROW]
[ROW][C]19[/C][C]0.068389[/C][C]0.5297[/C][C]0.299124[/C][/ROW]
[ROW][C]20[/C][C]-0.127837[/C][C]-0.9902[/C][C]0.163021[/C][/ROW]
[ROW][C]21[/C][C]0.097041[/C][C]0.7517[/C][C]0.227593[/C][/ROW]
[ROW][C]22[/C][C]0.022841[/C][C]0.1769[/C][C]0.430081[/C][/ROW]
[ROW][C]23[/C][C]-0.089004[/C][C]-0.6894[/C][C]0.246609[/C][/ROW]
[ROW][C]24[/C][C]-0.053638[/C][C]-0.4155[/C][C]0.339638[/C][/ROW]
[ROW][C]25[/C][C]0.020237[/C][C]0.1568[/C][C]0.437983[/C][/ROW]
[ROW][C]26[/C][C]-0.151613[/C][C]-1.1744[/C][C]0.122439[/C][/ROW]
[ROW][C]27[/C][C]-0.062235[/C][C]-0.4821[/C][C]0.315756[/C][/ROW]
[ROW][C]28[/C][C]-0.112795[/C][C]-0.8737[/C][C]0.192881[/C][/ROW]
[ROW][C]29[/C][C]-0.000406[/C][C]-0.0031[/C][C]0.498752[/C][/ROW]
[ROW][C]30[/C][C]-0.157943[/C][C]-1.2234[/C][C]0.112978[/C][/ROW]
[ROW][C]31[/C][C]0.02719[/C][C]0.2106[/C][C]0.416953[/C][/ROW]
[ROW][C]32[/C][C]-0.035236[/C][C]-0.2729[/C][C]0.39292[/C][/ROW]
[ROW][C]33[/C][C]0.099286[/C][C]0.7691[/C][C]0.222436[/C][/ROW]
[ROW][C]34[/C][C]0.085777[/C][C]0.6644[/C][C]0.254481[/C][/ROW]
[ROW][C]35[/C][C]-0.084438[/C][C]-0.6541[/C][C]0.257789[/C][/ROW]
[ROW][C]36[/C][C]-0.015932[/C][C]-0.1234[/C][C]0.451099[/C][/ROW]
[ROW][C]37[/C][C]0.087356[/C][C]0.6767[/C][C]0.250613[/C][/ROW]
[ROW][C]38[/C][C]0.060751[/C][C]0.4706[/C][C]0.319825[/C][/ROW]
[ROW][C]39[/C][C]0.002529[/C][C]0.0196[/C][C]0.492217[/C][/ROW]
[ROW][C]40[/C][C]-0.03385[/C][C]-0.2622[/C][C]0.397032[/C][/ROW]
[ROW][C]41[/C][C]0.006135[/C][C]0.0475[/C][C]0.481127[/C][/ROW]
[ROW][C]42[/C][C]-0.082464[/C][C]-0.6388[/C][C]0.262705[/C][/ROW]
[ROW][C]43[/C][C]-0.098182[/C][C]-0.7605[/C][C]0.224963[/C][/ROW]
[ROW][C]44[/C][C]0.051382[/C][C]0.398[/C][C]0.346019[/C][/ROW]
[ROW][C]45[/C][C]-0.119623[/C][C]-0.9266[/C][C]0.178924[/C][/ROW]
[ROW][C]46[/C][C]-0.062155[/C][C]-0.4815[/C][C]0.315974[/C][/ROW]
[ROW][C]47[/C][C]0.055094[/C][C]0.4268[/C][C]0.335541[/C][/ROW]
[ROW][C]48[/C][C]-0.103282[/C][C]-0.8[/C][C]0.213427[/C][/ROW]
[ROW][C]49[/C][C]-0.030561[/C][C]-0.2367[/C][C]0.406839[/C][/ROW]
[ROW][C]50[/C][C]-0.013416[/C][C]-0.1039[/C][C]0.458789[/C][/ROW]
[ROW][C]51[/C][C]0.050897[/C][C]0.3942[/C][C]0.3474[/C][/ROW]
[ROW][C]52[/C][C]-0.040493[/C][C]-0.3137[/C][C]0.377435[/C][/ROW]
[ROW][C]53[/C][C]-0.008527[/C][C]-0.0661[/C][C]0.473778[/C][/ROW]
[ROW][C]54[/C][C]0.081448[/C][C]0.6309[/C][C]0.265253[/C][/ROW]
[ROW][C]55[/C][C]-0.059638[/C][C]-0.462[/C][C]0.322892[/C][/ROW]
[ROW][C]56[/C][C]-0.077665[/C][C]-0.6016[/C][C]0.274857[/C][/ROW]
[ROW][C]57[/C][C]0.009186[/C][C]0.0712[/C][C]0.471756[/C][/ROW]
[ROW][C]58[/C][C]-0.066686[/C][C]-0.5165[/C][C]0.303686[/C][/ROW]
[ROW][C]59[/C][C]0.033621[/C][C]0.2604[/C][C]0.397714[/C][/ROW]
[ROW][C]60[/C][C]NA[/C][C]NA[/C][C]NA[/C][/ROW]
[/TABLE]
Source: https://freestatistics.org/blog/index.php?pk=69512&T=2

Globally Unique Identifier (entire table): ba.freestatistics.org/blog/index.php?pk=69512&T=2

As an alternative you can also use a QR Code:  

The GUIDs for individual cells are displayed in the table below:

Partial Autocorrelation Function
Time lag kPACF(k)T-STATP-value
10.1818731.40880.08203
2-0.262337-2.03210.023291
3-0.088981-0.68920.246662
4-0.097025-0.75160.227629
50.1933261.49750.069753
60.2748442.12890.018687
70.1918351.48590.071264
8-0.018808-0.14570.44233
9-0.079247-0.61380.27082
10-0.328721-2.54630.006737
110.1963171.52070.066798
120.4174283.23340.000995
13-0.232995-1.80480.038065
14-0.074012-0.57330.284293
150.0085960.06660.473568
16-0.094874-0.73490.232634
17-0.10059-0.77920.219472
18-0.213079-1.65050.052033
190.0683890.52970.299124
20-0.127837-0.99020.163021
210.0970410.75170.227593
220.0228410.17690.430081
23-0.089004-0.68940.246609
24-0.053638-0.41550.339638
250.0202370.15680.437983
26-0.151613-1.17440.122439
27-0.062235-0.48210.315756
28-0.112795-0.87370.192881
29-0.000406-0.00310.498752
30-0.157943-1.22340.112978
310.027190.21060.416953
32-0.035236-0.27290.39292
330.0992860.76910.222436
340.0857770.66440.254481
35-0.084438-0.65410.257789
36-0.015932-0.12340.451099
370.0873560.67670.250613
380.0607510.47060.319825
390.0025290.01960.492217
40-0.03385-0.26220.397032
410.0061350.04750.481127
42-0.082464-0.63880.262705
43-0.098182-0.76050.224963
440.0513820.3980.346019
45-0.119623-0.92660.178924
46-0.062155-0.48150.315974
470.0550940.42680.335541
48-0.103282-0.80.213427
49-0.030561-0.23670.406839
50-0.013416-0.10390.458789
510.0508970.39420.3474
52-0.040493-0.31370.377435
53-0.008527-0.06610.473778
540.0814480.63090.265253
55-0.059638-0.4620.322892
56-0.077665-0.60160.274857
570.0091860.07120.471756
58-0.066686-0.51650.303686
590.0336210.26040.397714
60NANANA


Parameters (Session):
par1 = 36 ; par2 = 1 ; par3 = 0 ; par4 = 1 ; par5 = 12 ; par6 = MA ; par7 = 0.95 ;
Parameters (R input):
par1 = 60 ; par2 = 1 ; par3 = 1 ; par4 = 0 ; par5 = 12 ; par6 = MA ; par7 = 0.95 ;
R code (references can be found in the software module):
if (par1 == 'Default') {
par1 = 10*log10(length(x))
} else {
par1 <- as.numeric(par1)
}
par2 <- as.numeric(par2)
par3 <- as.numeric(par3)
par4 <- as.numeric(par4)
par5 <- as.numeric(par5)
if (par6 == 'White Noise') par6 <- 'white' else par6 <- 'ma'
par7 <- as.numeric(par7)
if (par2 == 0) {
x <- log(x)
} else {
x <- (x ^ par2 - 1) / par2
}
if (par3 > 0) x <- diff(x,lag=1,difference=par3)
if (par4 > 0) x <- diff(x,lag=par5,difference=par4)
bitmap(file='pic1.png')
racf <- acf(x, par1, main='Autocorrelation', xlab='time lag', ylab='ACF', ci.type=par6, ci=par7, sub=paste('(lambda=',par2,', d=',par3,', D=',par4,', CI=', par7, ', CI type=',par6,')',sep=''))
dev.off()
bitmap(file='pic2.png')
rpacf <- pacf(x,par1,main='Partial Autocorrelation',xlab='lags',ylab='PACF')
dev.off()
(myacf <- c(racf$acf))
(mypacf <- c(rpacf$acf))
lengthx <- length(x)
sqrtn <- sqrt(lengthx)
load(file='createtable')
a<-table.start()
a<-table.row.start(a)
a<-table.element(a,'Autocorrelation Function',4,TRUE)
a<-table.row.end(a)
a<-table.row.start(a)
a<-table.element(a,'Time lag k',header=TRUE)
a<-table.element(a,hyperlink('basics.htm','ACF(k)','click here for more information about the Autocorrelation Function'),header=TRUE)
a<-table.element(a,'T-STAT',header=TRUE)
a<-table.element(a,'P-value',header=TRUE)
a<-table.row.end(a)
for (i in 2:(par1+1)) {
a<-table.row.start(a)
a<-table.element(a,i-1,header=TRUE)
a<-table.element(a,round(myacf[i],6))
mytstat <- myacf[i]*sqrtn
a<-table.element(a,round(mytstat,4))
a<-table.element(a,round(1-pt(abs(mytstat),lengthx),6))
a<-table.row.end(a)
}
a<-table.end(a)
table.save(a,file='mytable.tab')
a<-table.start()
a<-table.row.start(a)
a<-table.element(a,'Partial Autocorrelation Function',4,TRUE)
a<-table.row.end(a)
a<-table.row.start(a)
a<-table.element(a,'Time lag k',header=TRUE)
a<-table.element(a,hyperlink('basics.htm','PACF(k)','click here for more information about the Partial Autocorrelation Function'),header=TRUE)
a<-table.element(a,'T-STAT',header=TRUE)
a<-table.element(a,'P-value',header=TRUE)
a<-table.row.end(a)
for (i in 1:par1) {
a<-table.row.start(a)
a<-table.element(a,i,header=TRUE)
a<-table.element(a,round(mypacf[i],6))
mytstat <- mypacf[i]*sqrtn
a<-table.element(a,round(mytstat,4))
a<-table.element(a,round(1-pt(abs(mytstat),lengthx),6))
a<-table.row.end(a)
}
a<-table.end(a)
table.save(a,file='mytable1.tab')