Free Statistics
of Irreproducible Research!
Description of Statistical Computation | |
|---|---|
| Author's title | |
| Author | *The author of this computation has been verified* |
| R Software Module | Rscript (source code is shown below) |
| Title produced by software | R console |
| Date of computation | Tue, 28 Jul 2009 16:08:27 -0600 |
| Cite this page as follows | Statistical Computations at FreeStatistics.org, Office for Research Development and Education, URL https://freestatistics.org/blog/index.php?v=date/2009/Jul/29/t1248818908nlkjwbma6asy3qs.htm/, Retrieved Fri, 23 Oct 2026 04:58:58 +0000 |
| Statistical Computations at FreeStatistics.org, Office for Research Development and Education, URL https://freestatistics.org/blog/index.php?pk=42424, Retrieved Fri, 23 Oct 2026 04:58:58 +0000 | |
| QR Codes: | |
|
| |
| Original text written by user: | This example is used in the manual files of the RC package. |
| IsPrivate? | No (this computation is public) |
| User-defined keywords | blogtest |
| Estimated Impact | 527 |
Tree of Dependent Computations | |
| Family? (F = Feedback message, R = changed R code, M = changed R Module, P = changed Parameters, D = changed Data) | |
| - [R console] [correlation test] [2009-07-28 22:08:27] [256f657a32c6b2b7628dddcfa9a822d0] [Current] | |
| Feedback Forum | |
Post a new message | |
Dataset | |
| Dataseries X: | |
0.167698157875643 0.128585805877406 -1.27166648698129 0.224028383475311 -0.409267210296097 -0.205208496602628 -2.51006455996522 0.65477769838233 1.21084430535155 1.09880086996651 0.346244694661568 -1.07459429337768 -1.05789226487261 -0.176645785072253 -0.201734738352174 -0.566113560895960 -0.454764987355255 0.202367258768720 1.32332891136775 -2.09725040743443 -0.849783815939303 1.19870791534279 0.377524613813533 0.318442918400162 -1.04385381636503 0.0954739783081889 -0.802076016224185 1.01936255740523 0.901612455312435 -0.499712116021276 0.41878879462004 0.51296752223962 0.238028310807357 0.158577873795645 -2.26706317953902 -0.841884559826959 -0.0523826050930246 1.33660217455155 0.0559955500869793 -0.0720696899061008 1.27670007034395 1.29510296602668 -1.15433149628975 -1.36705537074423 0.517919674928019 -0.0738985887598068 -1.65536118746867 1.05394056252521 -1.58210846911678 0.247946897561322 -0.069688939798707 0.415634414797401 -1.01662249876943 -0.526522941674415 -1.03189352137431 -0.226784748527976 1.06641284502673 -0.119090459969553 -1.73810607166448 0.467847020377473 -1.77660614412138 0.085883476729444 -1.32935163641185 0.579341744128304 -0.886788144862885 0.64047367481587 -0.778100720553998 -0.402265395417499 -0.789424079031658 -1.92837394605025 -1.22314144233604 0.245168741264782 -0.208317667195824 1.00097528275514 1.51529274331996 1.15490336535553 -0.283494101676942 0.80830710668425 0.0387660349791526 -0.181907305275108 -0.99315046527919 0.309455217621773 -0.403998491004056 -0.183645508280740 -1.04118867405437 -0.42985142366764 -0.695080653810786 0.518799695984861 -0.885924953258937 -0.273322659708894 0.80653308268787 -0.365338084287396 0.63391294333764 -0.651200811328586 0.410464597112548 -1.99035463885733 -1.05616789709746 -0.725592015213079 -0.372889402350189 -1.23190753237663 | |
Tables (Output of Computation) | |
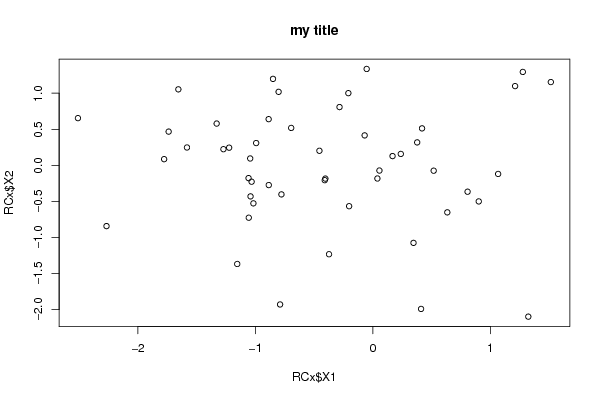
> title = 'my title'


> {
+     plot(RCx$X1, RCx$X2, main = title)
+     res <- cor.test(RCx$X1, RCx$X2)
+     print(res)
+ }

	Pearson's product-moment correlation

data:  RCx$X1 and RCx$X2
t = -0.3192, df = 48, p-value = 0.751
alternative hypothesis: true correlation is not equal to 0
95 percent confidence interval:
 -0.3202715  0.2353358
sample estimates:
        cor
-0.04602694
| |
Figures (Output of Computation) | |
Input Parameters & R Code | |
| Parameters (Session): | |
| par1 = 'mytitle' ; | |
| Parameters (R input): | |
| R code (body of R function): | |
{ | |