Free Statistics

of Irreproducible Research!

Author's title

Author*Unverified author*
R Software Modulerwasp_centraltendency.wasp
Title produced by softwareCentral Tendency
Date of computationSat, 06 Jun 2009 10:53:22 -0600
Cite this page as followsStatistical Computations at FreeStatistics.org, Office for Research Development and Education, URL https://freestatistics.org/blog/index.php?v=date/2009/Jun/06/t1244307301s52s98xwqqhcs2h.htm/, Retrieved Tue, 16 Apr 2024 15:24:28 +0000
Statistical Computations at FreeStatistics.org, Office for Research Development and Education, URL https://freestatistics.org/blog/index.php?pk=42037, Retrieved Tue, 16 Apr 2024 15:24:28 +0000
QR Codes:

Original text written by user:
IsPrivate?No (this computation is public)
User-defined keywords
Estimated Impact128
Family? (F = Feedback message, R = changed R code, M = changed R Module, P = changed Parameters, D = changed Data)
-     [Central Tendency] [Brutoschuld van d...] [2009-03-13 14:22:07] [ef653b42671acc8de32235b938c43afe]
-    D    [Central Tendency] [Bruto schuld van ...] [2009-06-06 16:53:22] [2eea656d1ea82c4ced0e8e79cdac0617] [Current]
Feedback Forum

Post a new message
Dataseries X:
266433
267722
266003
262971
265521
264676
270223
269508
268457
265814
266680
263018
269285
269829
270911
266844
271244
269907
271296
270157
271322
267179
264101
265518
269419
268714
272482
268351
268175
270674
272764
272599
270333
270846
270491
269160
274027
273784
276663
274525
271344
271115
270798
273911
273985
271917
273338
270601
273547
275363
281229
277793
279913
282500
280041
282166
290304
283519
287816
285226
287595
289741
289148
288301
290155
289648
288225
289351
294735
305333
309030
310215
321935


Summary of computational transaction
Raw Inputview raw input (R code)
Raw Outputview raw output of R engine
Computing time1 seconds
R Server'Gwilym Jenkins' @ 72.249.127.135

\begin{tabular}{lllllllll}
\hline
Summary of computational transaction \tabularnewline
Raw Input & view raw input (R code)  \tabularnewline
Raw Output & view raw output of R engine  \tabularnewline
Computing time & 1 seconds \tabularnewline
R Server & 'Gwilym Jenkins' @ 72.249.127.135 \tabularnewline
\hline
\end{tabular}
%Source: https://freestatistics.org/blog/index.php?pk=42037&T=0

[TABLE]
[ROW][C]Summary of computational transaction[/C][/ROW]
[ROW][C]Raw Input[/C][C]view raw input (R code) [/C][/ROW]
[ROW][C]Raw Output[/C][C]view raw output of R engine [/C][/ROW]
[ROW][C]Computing time[/C][C]1 seconds[/C][/ROW]
[ROW][C]R Server[/C][C]'Gwilym Jenkins' @ 72.249.127.135[/C][/ROW]
[/TABLE]
Source: https://freestatistics.org/blog/index.php?pk=42037&T=0

Globally Unique Identifier (entire table): ba.freestatistics.org/blog/index.php?pk=42037&T=0

As an alternative you can also use a QR Code:  

The GUIDs for individual cells are displayed in the table below:

Summary of computational transaction
Raw Inputview raw input (R code)
Raw Outputview raw output of R engine
Computing time1 seconds
R Server'Gwilym Jenkins' @ 72.249.127.135


Central Tendency - Ungrouped Data
MeasureValueS.E.Value/S.E.
Arithmetic Mean276403.6164383561375.70031102332200.918480735642
Geometric Mean276167.753528262
Harmonic Mean275941.920589930
Quadratic Mean276650.000681540
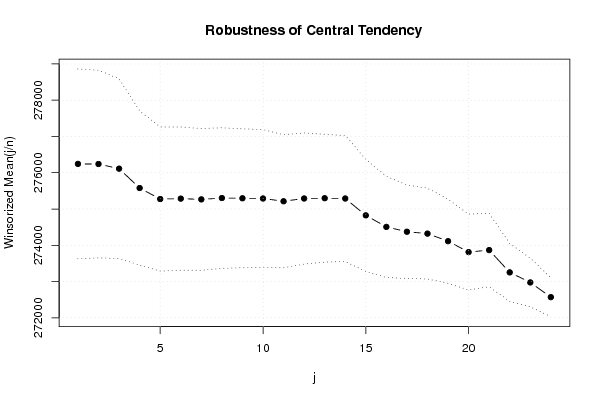
Winsorized Mean ( 1 / 24 )276243.7123287671309.59356930805210.938507032167
Winsorized Mean ( 2 / 24 )276240.9178082191294.01661279846213.475557482075
Winsorized Mean ( 3 / 24 )276112.6164383561239.31084835674222.795287239249
Winsorized Mean ( 4 / 24 )275578.0410958901063.92270161276259.020735884433
Winsorized Mean ( 5 / 24 )275274.753424658993.868134431354276.973115334015
Winsorized Mean ( 6 / 24 )275286.589041096988.057593349755278.613909648533
Winsorized Mean ( 7 / 24 )275265.01369863977.426447869276281.622227737636
Winsorized Mean ( 8 / 24 )275301.945205479969.234798935837284.040508561749
Winsorized Mean ( 9 / 24 )275295.780821918957.902508529574287.394362547928
Winsorized Mean ( 10 / 24 )275290.438356164949.459196984029289.944464417880
Winsorized Mean ( 11 / 24 )275213.287671233917.689370235551299.898088173988
Winsorized Mean ( 12 / 24 )275290.054794521904.59703914547304.323409077896
Winsorized Mean ( 13 / 24 )275297.890410959880.958066180773312.498291325558
Winsorized Mean ( 14 / 24 )275289.260273973868.839720360188316.847001607901
Winsorized Mean ( 15 / 24 )274824.260273973772.874921709248355.586981223541
Winsorized Mean ( 16 / 24 )274506.452054795697.810282709353393.382641180038
Winsorized Mean ( 17 / 24 )274373.01369863643.874189006146426.128300191905
Winsorized Mean ( 18 / 24 )274321.479452055626.033199912991438.189986553718
Winsorized Mean ( 19 / 24 )274112.479452055580.110937177427472.517344330327
Winsorized Mean ( 20 / 24 )273811.383561644522.637507715561523.903048517257
Winsorized Mean ( 21 / 24 )273866.904109589506.136332923722541.093152762978
Winsorized Mean ( 22 / 24 )273251.506849315399.766176960655683.528328801584
Winsorized Mean ( 23 / 24 )272974.246575342335.223782442984814.304535871558
Winsorized Mean ( 24 / 24 )272568.547945205268.9503527662321013.45302261834
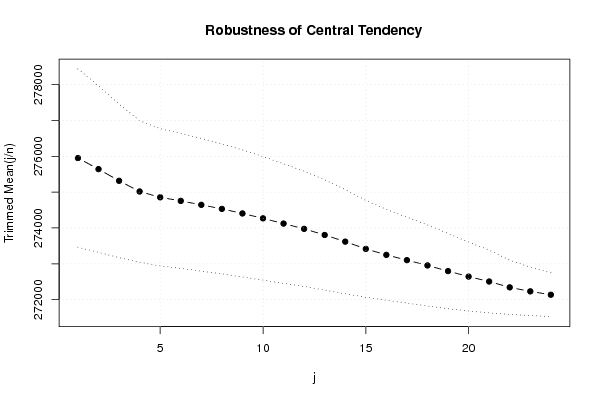
Trimmed Mean ( 1 / 24 )275951.5211267611243.02448842191222.000068137914
Trimmed Mean ( 2 / 24 )275642.3913043481161.63270486560237.28876619072
Trimmed Mean ( 3 / 24 )275316.3283582091071.42915593021256.96176628606
Trimmed Mean ( 4 / 24 )275018.230769231987.455919602634278.511906516194
Trimmed Mean ( 5 / 24 )274856.063492063956.775188499215287.273402149150
Trimmed Mean ( 6 / 24 )274755.852459016942.21442335731291.606502350073
Trimmed Mean ( 7 / 24 )274646.406779661925.550329638285296.738489507098
Trimmed Mean ( 8 / 24 )274533.228070175907.388979800075302.552967009433
Trimmed Mean ( 9 / 24 )274405.690909091886.331628761634309.597087596305
Trimmed Mean ( 10 / 24 )274269.471698113862.278292576644318.075352307138
Trimmed Mean ( 11 / 24 )274123.333333333833.502962186612328.881054740583
Trimmed Mean ( 12 / 24 )273975.714285714804.234264720809340.666552401650
Trimmed Mean ( 13 / 24 )273805.595744681768.76622846198356.162361986771
Trimmed Mean ( 14 / 24 )273619.377777778727.591074023642376.062032021144
Trimmed Mean ( 15 / 24 )273416.883720930675.202598863454404.940508495026
Trimmed Mean ( 16 / 24 )273249.829268293633.492502797417431.338694714868
Trimmed Mean ( 17 / 24 )273102.820512821598.739367159449456.129721031173
Trimmed Mean ( 18 / 24 )272955.405405405565.939898892407482.304580291304
Trimmed Mean ( 19 / 24 )272797.114285714524.556382036454520.052988825816
Trimmed Mean ( 20 / 24 )272643.969696970480.842628615674567.012892517247
Trimmed Mean ( 21 / 24 )272506.516129032438.743699819283621.106391365338
Trimmed Mean ( 22 / 24 )272343.448275862378.330974897658719.855011473839
Trimmed Mean ( 23 / 24 )272231.851851852338.117225847945805.140439589072
Trimmed Mean ( 24 / 24 )272137.6305.757959830975890.042568803244
Median271344
Midrange292453
Midmean - Weighted Average at Xnp272699.555555556
Midmean - Weighted Average at X(n+1)p272955.405405405
Midmean - Empirical Distribution Function272955.405405405
Midmean - Empirical Distribution Function - Averaging272955.405405405
Midmean - Empirical Distribution Function - Interpolation272955.405405405
Midmean - Closest Observation272855.526315789
Midmean - True Basic - Statistics Graphics Toolkit272955.405405405
Midmean - MS Excel (old versions)272955.405405405
Number of observations73

\begin{tabular}{lllllllll}
\hline
Central Tendency - Ungrouped Data \tabularnewline
Measure & Value & S.E. & Value/S.E. \tabularnewline
Arithmetic Mean & 276403.616438356 & 1375.70031102332 & 200.918480735642 \tabularnewline
Geometric Mean & 276167.753528262 &  &  \tabularnewline
Harmonic Mean & 275941.920589930 &  &  \tabularnewline
Quadratic Mean & 276650.000681540 &  &  \tabularnewline
Winsorized Mean ( 1 / 24 ) & 276243.712328767 & 1309.59356930805 & 210.938507032167 \tabularnewline
Winsorized Mean ( 2 / 24 ) & 276240.917808219 & 1294.01661279846 & 213.475557482075 \tabularnewline
Winsorized Mean ( 3 / 24 ) & 276112.616438356 & 1239.31084835674 & 222.795287239249 \tabularnewline
Winsorized Mean ( 4 / 24 ) & 275578.041095890 & 1063.92270161276 & 259.020735884433 \tabularnewline
Winsorized Mean ( 5 / 24 ) & 275274.753424658 & 993.868134431354 & 276.973115334015 \tabularnewline
Winsorized Mean ( 6 / 24 ) & 275286.589041096 & 988.057593349755 & 278.613909648533 \tabularnewline
Winsorized Mean ( 7 / 24 ) & 275265.01369863 & 977.426447869276 & 281.622227737636 \tabularnewline
Winsorized Mean ( 8 / 24 ) & 275301.945205479 & 969.234798935837 & 284.040508561749 \tabularnewline
Winsorized Mean ( 9 / 24 ) & 275295.780821918 & 957.902508529574 & 287.394362547928 \tabularnewline
Winsorized Mean ( 10 / 24 ) & 275290.438356164 & 949.459196984029 & 289.944464417880 \tabularnewline
Winsorized Mean ( 11 / 24 ) & 275213.287671233 & 917.689370235551 & 299.898088173988 \tabularnewline
Winsorized Mean ( 12 / 24 ) & 275290.054794521 & 904.59703914547 & 304.323409077896 \tabularnewline
Winsorized Mean ( 13 / 24 ) & 275297.890410959 & 880.958066180773 & 312.498291325558 \tabularnewline
Winsorized Mean ( 14 / 24 ) & 275289.260273973 & 868.839720360188 & 316.847001607901 \tabularnewline
Winsorized Mean ( 15 / 24 ) & 274824.260273973 & 772.874921709248 & 355.586981223541 \tabularnewline
Winsorized Mean ( 16 / 24 ) & 274506.452054795 & 697.810282709353 & 393.382641180038 \tabularnewline
Winsorized Mean ( 17 / 24 ) & 274373.01369863 & 643.874189006146 & 426.128300191905 \tabularnewline
Winsorized Mean ( 18 / 24 ) & 274321.479452055 & 626.033199912991 & 438.189986553718 \tabularnewline
Winsorized Mean ( 19 / 24 ) & 274112.479452055 & 580.110937177427 & 472.517344330327 \tabularnewline
Winsorized Mean ( 20 / 24 ) & 273811.383561644 & 522.637507715561 & 523.903048517257 \tabularnewline
Winsorized Mean ( 21 / 24 ) & 273866.904109589 & 506.136332923722 & 541.093152762978 \tabularnewline
Winsorized Mean ( 22 / 24 ) & 273251.506849315 & 399.766176960655 & 683.528328801584 \tabularnewline
Winsorized Mean ( 23 / 24 ) & 272974.246575342 & 335.223782442984 & 814.304535871558 \tabularnewline
Winsorized Mean ( 24 / 24 ) & 272568.547945205 & 268.950352766232 & 1013.45302261834 \tabularnewline
Trimmed Mean ( 1 / 24 ) & 275951.521126761 & 1243.02448842191 & 222.000068137914 \tabularnewline
Trimmed Mean ( 2 / 24 ) & 275642.391304348 & 1161.63270486560 & 237.28876619072 \tabularnewline
Trimmed Mean ( 3 / 24 ) & 275316.328358209 & 1071.42915593021 & 256.96176628606 \tabularnewline
Trimmed Mean ( 4 / 24 ) & 275018.230769231 & 987.455919602634 & 278.511906516194 \tabularnewline
Trimmed Mean ( 5 / 24 ) & 274856.063492063 & 956.775188499215 & 287.273402149150 \tabularnewline
Trimmed Mean ( 6 / 24 ) & 274755.852459016 & 942.21442335731 & 291.606502350073 \tabularnewline
Trimmed Mean ( 7 / 24 ) & 274646.406779661 & 925.550329638285 & 296.738489507098 \tabularnewline
Trimmed Mean ( 8 / 24 ) & 274533.228070175 & 907.388979800075 & 302.552967009433 \tabularnewline
Trimmed Mean ( 9 / 24 ) & 274405.690909091 & 886.331628761634 & 309.597087596305 \tabularnewline
Trimmed Mean ( 10 / 24 ) & 274269.471698113 & 862.278292576644 & 318.075352307138 \tabularnewline
Trimmed Mean ( 11 / 24 ) & 274123.333333333 & 833.502962186612 & 328.881054740583 \tabularnewline
Trimmed Mean ( 12 / 24 ) & 273975.714285714 & 804.234264720809 & 340.666552401650 \tabularnewline
Trimmed Mean ( 13 / 24 ) & 273805.595744681 & 768.76622846198 & 356.162361986771 \tabularnewline
Trimmed Mean ( 14 / 24 ) & 273619.377777778 & 727.591074023642 & 376.062032021144 \tabularnewline
Trimmed Mean ( 15 / 24 ) & 273416.883720930 & 675.202598863454 & 404.940508495026 \tabularnewline
Trimmed Mean ( 16 / 24 ) & 273249.829268293 & 633.492502797417 & 431.338694714868 \tabularnewline
Trimmed Mean ( 17 / 24 ) & 273102.820512821 & 598.739367159449 & 456.129721031173 \tabularnewline
Trimmed Mean ( 18 / 24 ) & 272955.405405405 & 565.939898892407 & 482.304580291304 \tabularnewline
Trimmed Mean ( 19 / 24 ) & 272797.114285714 & 524.556382036454 & 520.052988825816 \tabularnewline
Trimmed Mean ( 20 / 24 ) & 272643.969696970 & 480.842628615674 & 567.012892517247 \tabularnewline
Trimmed Mean ( 21 / 24 ) & 272506.516129032 & 438.743699819283 & 621.106391365338 \tabularnewline
Trimmed Mean ( 22 / 24 ) & 272343.448275862 & 378.330974897658 & 719.855011473839 \tabularnewline
Trimmed Mean ( 23 / 24 ) & 272231.851851852 & 338.117225847945 & 805.140439589072 \tabularnewline
Trimmed Mean ( 24 / 24 ) & 272137.6 & 305.757959830975 & 890.042568803244 \tabularnewline
Median & 271344 &  &  \tabularnewline
Midrange & 292453 &  &  \tabularnewline
Midmean - Weighted Average at Xnp & 272699.555555556 &  &  \tabularnewline
Midmean - Weighted Average at X(n+1)p & 272955.405405405 &  &  \tabularnewline
Midmean - Empirical Distribution Function & 272955.405405405 &  &  \tabularnewline
Midmean - Empirical Distribution Function - Averaging & 272955.405405405 &  &  \tabularnewline
Midmean - Empirical Distribution Function - Interpolation & 272955.405405405 &  &  \tabularnewline
Midmean - Closest Observation & 272855.526315789 &  &  \tabularnewline
Midmean - True Basic - Statistics Graphics Toolkit & 272955.405405405 &  &  \tabularnewline
Midmean - MS Excel (old versions) & 272955.405405405 &  &  \tabularnewline
Number of observations & 73 &  &  \tabularnewline
\hline
\end{tabular}
%Source: https://freestatistics.org/blog/index.php?pk=42037&T=1

[TABLE]
[ROW][C]Central Tendency - Ungrouped Data[/C][/ROW]
[ROW][C]Measure[/C][C]Value[/C][C]S.E.[/C][C]Value/S.E.[/C][/ROW]
[ROW][C]Arithmetic Mean[/C][C]276403.616438356[/C][C]1375.70031102332[/C][C]200.918480735642[/C][/ROW]
[ROW][C]Geometric Mean[/C][C]276167.753528262[/C][C][/C][C][/C][/ROW]
[ROW][C]Harmonic Mean[/C][C]275941.920589930[/C][C][/C][C][/C][/ROW]
[ROW][C]Quadratic Mean[/C][C]276650.000681540[/C][C][/C][C][/C][/ROW]
[ROW][C]Winsorized Mean ( 1 / 24 )[/C][C]276243.712328767[/C][C]1309.59356930805[/C][C]210.938507032167[/C][/ROW]
[ROW][C]Winsorized Mean ( 2 / 24 )[/C][C]276240.917808219[/C][C]1294.01661279846[/C][C]213.475557482075[/C][/ROW]
[ROW][C]Winsorized Mean ( 3 / 24 )[/C][C]276112.616438356[/C][C]1239.31084835674[/C][C]222.795287239249[/C][/ROW]
[ROW][C]Winsorized Mean ( 4 / 24 )[/C][C]275578.041095890[/C][C]1063.92270161276[/C][C]259.020735884433[/C][/ROW]
[ROW][C]Winsorized Mean ( 5 / 24 )[/C][C]275274.753424658[/C][C]993.868134431354[/C][C]276.973115334015[/C][/ROW]
[ROW][C]Winsorized Mean ( 6 / 24 )[/C][C]275286.589041096[/C][C]988.057593349755[/C][C]278.613909648533[/C][/ROW]
[ROW][C]Winsorized Mean ( 7 / 24 )[/C][C]275265.01369863[/C][C]977.426447869276[/C][C]281.622227737636[/C][/ROW]
[ROW][C]Winsorized Mean ( 8 / 24 )[/C][C]275301.945205479[/C][C]969.234798935837[/C][C]284.040508561749[/C][/ROW]
[ROW][C]Winsorized Mean ( 9 / 24 )[/C][C]275295.780821918[/C][C]957.902508529574[/C][C]287.394362547928[/C][/ROW]
[ROW][C]Winsorized Mean ( 10 / 24 )[/C][C]275290.438356164[/C][C]949.459196984029[/C][C]289.944464417880[/C][/ROW]
[ROW][C]Winsorized Mean ( 11 / 24 )[/C][C]275213.287671233[/C][C]917.689370235551[/C][C]299.898088173988[/C][/ROW]
[ROW][C]Winsorized Mean ( 12 / 24 )[/C][C]275290.054794521[/C][C]904.59703914547[/C][C]304.323409077896[/C][/ROW]
[ROW][C]Winsorized Mean ( 13 / 24 )[/C][C]275297.890410959[/C][C]880.958066180773[/C][C]312.498291325558[/C][/ROW]
[ROW][C]Winsorized Mean ( 14 / 24 )[/C][C]275289.260273973[/C][C]868.839720360188[/C][C]316.847001607901[/C][/ROW]
[ROW][C]Winsorized Mean ( 15 / 24 )[/C][C]274824.260273973[/C][C]772.874921709248[/C][C]355.586981223541[/C][/ROW]
[ROW][C]Winsorized Mean ( 16 / 24 )[/C][C]274506.452054795[/C][C]697.810282709353[/C][C]393.382641180038[/C][/ROW]
[ROW][C]Winsorized Mean ( 17 / 24 )[/C][C]274373.01369863[/C][C]643.874189006146[/C][C]426.128300191905[/C][/ROW]
[ROW][C]Winsorized Mean ( 18 / 24 )[/C][C]274321.479452055[/C][C]626.033199912991[/C][C]438.189986553718[/C][/ROW]
[ROW][C]Winsorized Mean ( 19 / 24 )[/C][C]274112.479452055[/C][C]580.110937177427[/C][C]472.517344330327[/C][/ROW]
[ROW][C]Winsorized Mean ( 20 / 24 )[/C][C]273811.383561644[/C][C]522.637507715561[/C][C]523.903048517257[/C][/ROW]
[ROW][C]Winsorized Mean ( 21 / 24 )[/C][C]273866.904109589[/C][C]506.136332923722[/C][C]541.093152762978[/C][/ROW]
[ROW][C]Winsorized Mean ( 22 / 24 )[/C][C]273251.506849315[/C][C]399.766176960655[/C][C]683.528328801584[/C][/ROW]
[ROW][C]Winsorized Mean ( 23 / 24 )[/C][C]272974.246575342[/C][C]335.223782442984[/C][C]814.304535871558[/C][/ROW]
[ROW][C]Winsorized Mean ( 24 / 24 )[/C][C]272568.547945205[/C][C]268.950352766232[/C][C]1013.45302261834[/C][/ROW]
[ROW][C]Trimmed Mean ( 1 / 24 )[/C][C]275951.521126761[/C][C]1243.02448842191[/C][C]222.000068137914[/C][/ROW]
[ROW][C]Trimmed Mean ( 2 / 24 )[/C][C]275642.391304348[/C][C]1161.63270486560[/C][C]237.28876619072[/C][/ROW]
[ROW][C]Trimmed Mean ( 3 / 24 )[/C][C]275316.328358209[/C][C]1071.42915593021[/C][C]256.96176628606[/C][/ROW]
[ROW][C]Trimmed Mean ( 4 / 24 )[/C][C]275018.230769231[/C][C]987.455919602634[/C][C]278.511906516194[/C][/ROW]
[ROW][C]Trimmed Mean ( 5 / 24 )[/C][C]274856.063492063[/C][C]956.775188499215[/C][C]287.273402149150[/C][/ROW]
[ROW][C]Trimmed Mean ( 6 / 24 )[/C][C]274755.852459016[/C][C]942.21442335731[/C][C]291.606502350073[/C][/ROW]
[ROW][C]Trimmed Mean ( 7 / 24 )[/C][C]274646.406779661[/C][C]925.550329638285[/C][C]296.738489507098[/C][/ROW]
[ROW][C]Trimmed Mean ( 8 / 24 )[/C][C]274533.228070175[/C][C]907.388979800075[/C][C]302.552967009433[/C][/ROW]
[ROW][C]Trimmed Mean ( 9 / 24 )[/C][C]274405.690909091[/C][C]886.331628761634[/C][C]309.597087596305[/C][/ROW]
[ROW][C]Trimmed Mean ( 10 / 24 )[/C][C]274269.471698113[/C][C]862.278292576644[/C][C]318.075352307138[/C][/ROW]
[ROW][C]Trimmed Mean ( 11 / 24 )[/C][C]274123.333333333[/C][C]833.502962186612[/C][C]328.881054740583[/C][/ROW]
[ROW][C]Trimmed Mean ( 12 / 24 )[/C][C]273975.714285714[/C][C]804.234264720809[/C][C]340.666552401650[/C][/ROW]
[ROW][C]Trimmed Mean ( 13 / 24 )[/C][C]273805.595744681[/C][C]768.76622846198[/C][C]356.162361986771[/C][/ROW]
[ROW][C]Trimmed Mean ( 14 / 24 )[/C][C]273619.377777778[/C][C]727.591074023642[/C][C]376.062032021144[/C][/ROW]
[ROW][C]Trimmed Mean ( 15 / 24 )[/C][C]273416.883720930[/C][C]675.202598863454[/C][C]404.940508495026[/C][/ROW]
[ROW][C]Trimmed Mean ( 16 / 24 )[/C][C]273249.829268293[/C][C]633.492502797417[/C][C]431.338694714868[/C][/ROW]
[ROW][C]Trimmed Mean ( 17 / 24 )[/C][C]273102.820512821[/C][C]598.739367159449[/C][C]456.129721031173[/C][/ROW]
[ROW][C]Trimmed Mean ( 18 / 24 )[/C][C]272955.405405405[/C][C]565.939898892407[/C][C]482.304580291304[/C][/ROW]
[ROW][C]Trimmed Mean ( 19 / 24 )[/C][C]272797.114285714[/C][C]524.556382036454[/C][C]520.052988825816[/C][/ROW]
[ROW][C]Trimmed Mean ( 20 / 24 )[/C][C]272643.969696970[/C][C]480.842628615674[/C][C]567.012892517247[/C][/ROW]
[ROW][C]Trimmed Mean ( 21 / 24 )[/C][C]272506.516129032[/C][C]438.743699819283[/C][C]621.106391365338[/C][/ROW]
[ROW][C]Trimmed Mean ( 22 / 24 )[/C][C]272343.448275862[/C][C]378.330974897658[/C][C]719.855011473839[/C][/ROW]
[ROW][C]Trimmed Mean ( 23 / 24 )[/C][C]272231.851851852[/C][C]338.117225847945[/C][C]805.140439589072[/C][/ROW]
[ROW][C]Trimmed Mean ( 24 / 24 )[/C][C]272137.6[/C][C]305.757959830975[/C][C]890.042568803244[/C][/ROW]
[ROW][C]Median[/C][C]271344[/C][C][/C][C][/C][/ROW]
[ROW][C]Midrange[/C][C]292453[/C][C][/C][C][/C][/ROW]
[ROW][C]Midmean - Weighted Average at Xnp[/C][C]272699.555555556[/C][C][/C][C][/C][/ROW]
[ROW][C]Midmean - Weighted Average at X(n+1)p[/C][C]272955.405405405[/C][C][/C][C][/C][/ROW]
[ROW][C]Midmean - Empirical Distribution Function[/C][C]272955.405405405[/C][C][/C][C][/C][/ROW]
[ROW][C]Midmean - Empirical Distribution Function - Averaging[/C][C]272955.405405405[/C][C][/C][C][/C][/ROW]
[ROW][C]Midmean - Empirical Distribution Function - Interpolation[/C][C]272955.405405405[/C][C][/C][C][/C][/ROW]
[ROW][C]Midmean - Closest Observation[/C][C]272855.526315789[/C][C][/C][C][/C][/ROW]
[ROW][C]Midmean - True Basic - Statistics Graphics Toolkit[/C][C]272955.405405405[/C][C][/C][C][/C][/ROW]
[ROW][C]Midmean - MS Excel (old versions)[/C][C]272955.405405405[/C][C][/C][C][/C][/ROW]
[ROW][C]Number of observations[/C][C]73[/C][C][/C][C][/C][/ROW]
[/TABLE]
Source: https://freestatistics.org/blog/index.php?pk=42037&T=1

Globally Unique Identifier (entire table): ba.freestatistics.org/blog/index.php?pk=42037&T=1

As an alternative you can also use a QR Code:  

The GUIDs for individual cells are displayed in the table below:

Central Tendency - Ungrouped Data
MeasureValueS.E.Value/S.E.
Arithmetic Mean276403.6164383561375.70031102332200.918480735642
Geometric Mean276167.753528262
Harmonic Mean275941.920589930
Quadratic Mean276650.000681540
Winsorized Mean ( 1 / 24 )276243.7123287671309.59356930805210.938507032167
Winsorized Mean ( 2 / 24 )276240.9178082191294.01661279846213.475557482075
Winsorized Mean ( 3 / 24 )276112.6164383561239.31084835674222.795287239249
Winsorized Mean ( 4 / 24 )275578.0410958901063.92270161276259.020735884433
Winsorized Mean ( 5 / 24 )275274.753424658993.868134431354276.973115334015
Winsorized Mean ( 6 / 24 )275286.589041096988.057593349755278.613909648533
Winsorized Mean ( 7 / 24 )275265.01369863977.426447869276281.622227737636
Winsorized Mean ( 8 / 24 )275301.945205479969.234798935837284.040508561749
Winsorized Mean ( 9 / 24 )275295.780821918957.902508529574287.394362547928
Winsorized Mean ( 10 / 24 )275290.438356164949.459196984029289.944464417880
Winsorized Mean ( 11 / 24 )275213.287671233917.689370235551299.898088173988
Winsorized Mean ( 12 / 24 )275290.054794521904.59703914547304.323409077896
Winsorized Mean ( 13 / 24 )275297.890410959880.958066180773312.498291325558
Winsorized Mean ( 14 / 24 )275289.260273973868.839720360188316.847001607901
Winsorized Mean ( 15 / 24 )274824.260273973772.874921709248355.586981223541
Winsorized Mean ( 16 / 24 )274506.452054795697.810282709353393.382641180038
Winsorized Mean ( 17 / 24 )274373.01369863643.874189006146426.128300191905
Winsorized Mean ( 18 / 24 )274321.479452055626.033199912991438.189986553718
Winsorized Mean ( 19 / 24 )274112.479452055580.110937177427472.517344330327
Winsorized Mean ( 20 / 24 )273811.383561644522.637507715561523.903048517257
Winsorized Mean ( 21 / 24 )273866.904109589506.136332923722541.093152762978
Winsorized Mean ( 22 / 24 )273251.506849315399.766176960655683.528328801584
Winsorized Mean ( 23 / 24 )272974.246575342335.223782442984814.304535871558
Winsorized Mean ( 24 / 24 )272568.547945205268.9503527662321013.45302261834
Trimmed Mean ( 1 / 24 )275951.5211267611243.02448842191222.000068137914
Trimmed Mean ( 2 / 24 )275642.3913043481161.63270486560237.28876619072
Trimmed Mean ( 3 / 24 )275316.3283582091071.42915593021256.96176628606
Trimmed Mean ( 4 / 24 )275018.230769231987.455919602634278.511906516194
Trimmed Mean ( 5 / 24 )274856.063492063956.775188499215287.273402149150
Trimmed Mean ( 6 / 24 )274755.852459016942.21442335731291.606502350073
Trimmed Mean ( 7 / 24 )274646.406779661925.550329638285296.738489507098
Trimmed Mean ( 8 / 24 )274533.228070175907.388979800075302.552967009433
Trimmed Mean ( 9 / 24 )274405.690909091886.331628761634309.597087596305
Trimmed Mean ( 10 / 24 )274269.471698113862.278292576644318.075352307138
Trimmed Mean ( 11 / 24 )274123.333333333833.502962186612328.881054740583
Trimmed Mean ( 12 / 24 )273975.714285714804.234264720809340.666552401650
Trimmed Mean ( 13 / 24 )273805.595744681768.76622846198356.162361986771
Trimmed Mean ( 14 / 24 )273619.377777778727.591074023642376.062032021144
Trimmed Mean ( 15 / 24 )273416.883720930675.202598863454404.940508495026
Trimmed Mean ( 16 / 24 )273249.829268293633.492502797417431.338694714868
Trimmed Mean ( 17 / 24 )273102.820512821598.739367159449456.129721031173
Trimmed Mean ( 18 / 24 )272955.405405405565.939898892407482.304580291304
Trimmed Mean ( 19 / 24 )272797.114285714524.556382036454520.052988825816
Trimmed Mean ( 20 / 24 )272643.969696970480.842628615674567.012892517247
Trimmed Mean ( 21 / 24 )272506.516129032438.743699819283621.106391365338
Trimmed Mean ( 22 / 24 )272343.448275862378.330974897658719.855011473839
Trimmed Mean ( 23 / 24 )272231.851851852338.117225847945805.140439589072
Trimmed Mean ( 24 / 24 )272137.6305.757959830975890.042568803244
Median271344
Midrange292453
Midmean - Weighted Average at Xnp272699.555555556
Midmean - Weighted Average at X(n+1)p272955.405405405
Midmean - Empirical Distribution Function272955.405405405
Midmean - Empirical Distribution Function - Averaging272955.405405405
Midmean - Empirical Distribution Function - Interpolation272955.405405405
Midmean - Closest Observation272855.526315789
Midmean - True Basic - Statistics Graphics Toolkit272955.405405405
Midmean - MS Excel (old versions)272955.405405405
Number of observations73


Parameters (Session):
Parameters (R input):
R code (references can be found in the software module):
geomean <- function(x) {
return(exp(mean(log(x))))
}
harmean <- function(x) {
return(1/mean(1/x))
}
quamean <- function(x) {
return(sqrt(mean(x*x)))
}
winmean <- function(x) {
x <-sort(x[!is.na(x)])
n<-length(x)
denom <- 3
nodenom <- n/denom
if (nodenom>40) denom <- n/40
sqrtn = sqrt(n)
roundnodenom = floor(nodenom)
win <- array(NA,dim=c(roundnodenom,2))
for (j in 1:roundnodenom) {
win[j,1] <- (j*x[j+1]+sum(x[(j+1):(n-j)])+j*x[n-j])/n
win[j,2] <- sd(c(rep(x[j+1],j),x[(j+1):(n-j)],rep(x[n-j],j)))/sqrtn
}
return(win)
}
trimean <- function(x) {
x <-sort(x[!is.na(x)])
n<-length(x)
denom <- 3
nodenom <- n/denom
if (nodenom>40) denom <- n/40
sqrtn = sqrt(n)
roundnodenom = floor(nodenom)
tri <- array(NA,dim=c(roundnodenom,2))
for (j in 1:roundnodenom) {
tri[j,1] <- mean(x,trim=j/n)
tri[j,2] <- sd(x[(j+1):(n-j)]) / sqrt(n-j*2)
}
return(tri)
}
midrange <- function(x) {
return((max(x)+min(x))/2)
}
q1 <- function(data,n,p,i,f) {
np <- n*p;
i <<- floor(np)
f <<- np - i
qvalue <- (1-f)*data[i] + f*data[i+1]
}
q2 <- function(data,n,p,i,f) {
np <- (n+1)*p
i <<- floor(np)
f <<- np - i
qvalue <- (1-f)*data[i] + f*data[i+1]
}
q3 <- function(data,n,p,i,f) {
np <- n*p
i <<- floor(np)
f <<- np - i
if (f==0) {
qvalue <- data[i]
} else {
qvalue <- data[i+1]
}
}
q4 <- function(data,n,p,i,f) {
np <- n*p
i <<- floor(np)
f <<- np - i
if (f==0) {
qvalue <- (data[i]+data[i+1])/2
} else {
qvalue <- data[i+1]
}
}
q5 <- function(data,n,p,i,f) {
np <- (n-1)*p
i <<- floor(np)
f <<- np - i
if (f==0) {
qvalue <- data[i+1]
} else {
qvalue <- data[i+1] + f*(data[i+2]-data[i+1])
}
}
q6 <- function(data,n,p,i,f) {
np <- n*p+0.5
i <<- floor(np)
f <<- np - i
qvalue <- data[i]
}
q7 <- function(data,n,p,i,f) {
np <- (n+1)*p
i <<- floor(np)
f <<- np - i
if (f==0) {
qvalue <- data[i]
} else {
qvalue <- f*data[i] + (1-f)*data[i+1]
}
}
q8 <- function(data,n,p,i,f) {
np <- (n+1)*p
i <<- floor(np)
f <<- np - i
if (f==0) {
qvalue <- data[i]
} else {
if (f == 0.5) {
qvalue <- (data[i]+data[i+1])/2
} else {
if (f < 0.5) {
qvalue <- data[i]
} else {
qvalue <- data[i+1]
}
}
}
}
midmean <- function(x,def) {
x <-sort(x[!is.na(x)])
n<-length(x)
if (def==1) {
qvalue1 <- q1(x,n,0.25,i,f)
qvalue3 <- q1(x,n,0.75,i,f)
}
if (def==2) {
qvalue1 <- q2(x,n,0.25,i,f)
qvalue3 <- q2(x,n,0.75,i,f)
}
if (def==3) {
qvalue1 <- q3(x,n,0.25,i,f)
qvalue3 <- q3(x,n,0.75,i,f)
}
if (def==4) {
qvalue1 <- q4(x,n,0.25,i,f)
qvalue3 <- q4(x,n,0.75,i,f)
}
if (def==5) {
qvalue1 <- q5(x,n,0.25,i,f)
qvalue3 <- q5(x,n,0.75,i,f)
}
if (def==6) {
qvalue1 <- q6(x,n,0.25,i,f)
qvalue3 <- q6(x,n,0.75,i,f)
}
if (def==7) {
qvalue1 <- q7(x,n,0.25,i,f)
qvalue3 <- q7(x,n,0.75,i,f)
}
if (def==8) {
qvalue1 <- q8(x,n,0.25,i,f)
qvalue3 <- q8(x,n,0.75,i,f)
}
midm <- 0
myn <- 0
roundno4 <- round(n/4)
round3no4 <- round(3*n/4)
for (i in 1:n) {
if ((x[i]>=qvalue1) & (x[i]<=qvalue3)){
midm = midm + x[i]
myn = myn + 1
}
}
midm = midm / myn
return(midm)
}
(arm <- mean(x))
sqrtn <- sqrt(length(x))
(armse <- sd(x) / sqrtn)
(armose <- arm / armse)
(geo <- geomean(x))
(har <- harmean(x))
(qua <- quamean(x))
(win <- winmean(x))
(tri <- trimean(x))
(midr <- midrange(x))
midm <- array(NA,dim=8)
for (j in 1:8) midm[j] <- midmean(x,j)
midm
bitmap(file='test1.png')
lb <- win[,1] - 2*win[,2]
ub <- win[,1] + 2*win[,2]
if ((ylimmin == '') | (ylimmax == '')) plot(win[,1],type='b',main=main, xlab='j', pch=19, ylab='Winsorized Mean(j/n)', ylim=c(min(lb),max(ub))) else plot(win[,1],type='l',main=main, xlab='j', pch=19, ylab='Winsorized Mean(j/n)', ylim=c(ylimmin,ylimmax))
lines(ub,lty=3)
lines(lb,lty=3)
grid()
dev.off()
bitmap(file='test2.png')
lb <- tri[,1] - 2*tri[,2]
ub <- tri[,1] + 2*tri[,2]
if ((ylimmin == '') | (ylimmax == '')) plot(tri[,1],type='b',main=main, xlab='j', pch=19, ylab='Trimmed Mean(j/n)', ylim=c(min(lb),max(ub))) else plot(tri[,1],type='l',main=main, xlab='j', pch=19, ylab='Trimmed Mean(j/n)', ylim=c(ylimmin,ylimmax))
lines(ub,lty=3)
lines(lb,lty=3)
grid()
dev.off()
load(file='createtable')
a<-table.start()
a<-table.row.start(a)
a<-table.element(a,'Central Tendency - Ungrouped Data',4,TRUE)
a<-table.row.end(a)
a<-table.row.start(a)
a<-table.element(a,'Measure',header=TRUE)
a<-table.element(a,'Value',header=TRUE)
a<-table.element(a,'S.E.',header=TRUE)
a<-table.element(a,'Value/S.E.',header=TRUE)
a<-table.row.end(a)
a<-table.row.start(a)
a<-table.element(a,hyperlink('arithmetic_mean.htm', 'Arithmetic Mean', 'click to view the definition of the Arithmetic Mean'),header=TRUE)
a<-table.element(a,arm)
a<-table.element(a,hyperlink('arithmetic_mean_standard_error.htm', armse, 'click to view the definition of the Standard Error of the Arithmetic Mean'))
a<-table.element(a,armose)
a<-table.row.end(a)
a<-table.row.start(a)
a<-table.element(a,hyperlink('geometric_mean.htm', 'Geometric Mean', 'click to view the definition of the Geometric Mean'),header=TRUE)
a<-table.element(a,geo)
a<-table.element(a,'')
a<-table.row.end(a)
a<-table.row.start(a)
a<-table.element(a,hyperlink('harmonic_mean.htm', 'Harmonic Mean', 'click to view the definition of the Harmonic Mean'),header=TRUE)
a<-table.element(a,har)
a<-table.element(a,'')
a<-table.row.end(a)
a<-table.row.start(a)
a<-table.element(a,hyperlink('quadratic_mean.htm', 'Quadratic Mean', 'click to view the definition of the Quadratic Mean'),header=TRUE)
a<-table.element(a,qua)
a<-table.element(a,'')
a<-table.row.end(a)
for (j in 1:length(win[,1])) {
a<-table.row.start(a)
mylabel <- paste('Winsorized Mean (',j)
mylabel <- paste(mylabel,'/')
mylabel <- paste(mylabel,length(win[,1]))
mylabel <- paste(mylabel,')')
a<-table.element(a,hyperlink('winsorized_mean.htm', mylabel, 'click to view the definition of the Winsorized Mean'),header=TRUE)
a<-table.element(a,win[j,1])
a<-table.element(a,win[j,2])
a<-table.element(a,win[j,1]/win[j,2])
a<-table.row.end(a)
}
for (j in 1:length(tri[,1])) {
a<-table.row.start(a)
mylabel <- paste('Trimmed Mean (',j)
mylabel <- paste(mylabel,'/')
mylabel <- paste(mylabel,length(tri[,1]))
mylabel <- paste(mylabel,')')
a<-table.element(a,hyperlink('arithmetic_mean.htm', mylabel, 'click to view the definition of the Trimmed Mean'),header=TRUE)
a<-table.element(a,tri[j,1])
a<-table.element(a,tri[j,2])
a<-table.element(a,tri[j,1]/tri[j,2])
a<-table.row.end(a)
}
a<-table.row.start(a)
a<-table.element(a,hyperlink('median_1.htm', 'Median', 'click to view the definition of the Median'),header=TRUE)
a<-table.element(a,median(x))
a<-table.element(a,'')
a<-table.row.end(a)
a<-table.row.start(a)
a<-table.element(a,hyperlink('midrange.htm', 'Midrange', 'click to view the definition of the Midrange'),header=TRUE)
a<-table.element(a,midr)
a<-table.element(a,'')
a<-table.row.end(a)
a<-table.row.start(a)
mymid <- hyperlink('midmean.htm', 'Midmean', 'click to view the definition of the Midmean')
mylabel <- paste(mymid,hyperlink('method_1.htm','Weighted Average at Xnp',''),sep=' - ')
a<-table.element(a,mylabel,header=TRUE)
a<-table.element(a,midm[1])
a<-table.element(a,'')
a<-table.row.end(a)
a<-table.row.start(a)
mymid <- hyperlink('midmean.htm', 'Midmean', 'click to view the definition of the Midmean')
mylabel <- paste(mymid,hyperlink('method_2.htm','Weighted Average at X(n+1)p',''),sep=' - ')
a<-table.element(a,mylabel,header=TRUE)
a<-table.element(a,midm[2])
a<-table.element(a,'')
a<-table.row.end(a)
a<-table.row.start(a)
mymid <- hyperlink('midmean.htm', 'Midmean', 'click to view the definition of the Midmean')
mylabel <- paste(mymid,hyperlink('method_3.htm','Empirical Distribution Function',''),sep=' - ')
a<-table.element(a,mylabel,header=TRUE)
a<-table.element(a,midm[3])
a<-table.element(a,'')
a<-table.row.end(a)
a<-table.row.start(a)
mymid <- hyperlink('midmean.htm', 'Midmean', 'click to view the definition of the Midmean')
mylabel <- paste(mymid,hyperlink('method_4.htm','Empirical Distribution Function - Averaging',''),sep=' - ')
a<-table.element(a,mylabel,header=TRUE)
a<-table.element(a,midm[4])
a<-table.element(a,'')
a<-table.row.end(a)
a<-table.row.start(a)
mymid <- hyperlink('midmean.htm', 'Midmean', 'click to view the definition of the Midmean')
mylabel <- paste(mymid,hyperlink('method_5.htm','Empirical Distribution Function - Interpolation',''),sep=' - ')
a<-table.element(a,mylabel,header=TRUE)
a<-table.element(a,midm[5])
a<-table.element(a,'')
a<-table.row.end(a)
a<-table.row.start(a)
mymid <- hyperlink('midmean.htm', 'Midmean', 'click to view the definition of the Midmean')
mylabel <- paste(mymid,hyperlink('method_6.htm','Closest Observation',''),sep=' - ')
a<-table.element(a,mylabel,header=TRUE)
a<-table.element(a,midm[6])
a<-table.element(a,'')
a<-table.row.end(a)
a<-table.row.start(a)
mymid <- hyperlink('midmean.htm', 'Midmean', 'click to view the definition of the Midmean')
mylabel <- paste(mymid,hyperlink('method_7.htm','True Basic - Statistics Graphics Toolkit',''),sep=' - ')
a<-table.element(a,mylabel,header=TRUE)
a<-table.element(a,midm[7])
a<-table.element(a,'')
a<-table.row.end(a)
a<-table.row.start(a)
mymid <- hyperlink('midmean.htm', 'Midmean', 'click to view the definition of the Midmean')
mylabel <- paste(mymid,hyperlink('method_8.htm','MS Excel (old versions)',''),sep=' - ')
a<-table.element(a,mylabel,header=TRUE)
a<-table.element(a,midm[8])
a<-table.element(a,'')
a<-table.row.end(a)
a<-table.row.start(a)
a<-table.element(a,'Number of observations',header=TRUE)
a<-table.element(a,length(x))
a<-table.element(a,'')
a<-table.row.end(a)
a<-table.end(a)
table.save(a,file='mytable.tab')