Free Statistics

of Irreproducible Research!

Author's title

Author*The author of this computation has been verified*
R Software Modulerwasp_multipleregression.wasp
Title produced by softwareMultiple Regression
Date of computationTue, 17 Nov 2009 11:05:01 -0700
Cite this page as followsStatistical Computations at FreeStatistics.org, Office for Research Development and Education, URL https://freestatistics.org/blog/index.php?v=date/2009/Nov/17/t1258481426jhm8vra37iyq6nj.htm/, Retrieved Sun, 28 Apr 2024 20:14:47 +0000
Statistical Computations at FreeStatistics.org, Office for Research Development and Education, URL https://freestatistics.org/blog/index.php?pk=57390, Retrieved Sun, 28 Apr 2024 20:14:47 +0000
QR Codes:

Original text written by user:
IsPrivate?No (this computation is public)
User-defined keywords
Estimated Impact202
Family? (F = Feedback message, R = changed R code, M = changed R Module, P = changed Parameters, D = changed Data)
-       [Multiple Regression] [] [2009-11-17 18:05:01] [6e025b5370bdd3143fbe248190b38274] [Current]
- R  D    [Multiple Regression] [Model 5] [2009-11-20 19:59:48] [fa71ec4c741ffec745cb91dcbd756720]
Feedback Forum

Post a new message
Dataseries X:
16643	16196.7	18252.1	17570.4	89.1
17729	16643	16196.7	18252.1	82.6
16446.1	17729	16643	16196.7	102.7
15993.8	16446.1	17729	16643	91.8
16373.5	15993.8	16446.1	17729	94.1
17842.2	16373.5	15993.8	16446.1	103.1
22321.5	17842.2	16373.5	15993.8	93.2
22786.7	22321.5	17842.2	16373.5	91
18274.1	22786.7	22321.5	17842.2	94.3
22392.9	18274.1	22786.7	22321.5	99.4
23899.3	22392.9	18274.1	22786.7	115.7
21343.5	23899.3	22392.9	18274.1	116.8
22952.3	21343.5	23899.3	22392.9	99.8
21374.4	22952.3	21343.5	23899.3	96
21164.1	21374.4	22952.3	21343.5	115.9
20906.5	21164.1	21374.4	22952.3	109.1
17877.4	20906.5	21164.1	21374.4	117.3
20664.3	17877.4	20906.5	21164.1	109.8
22160	20664.3	17877.4	20906.5	112.8
19813.6	22160	20664.3	17877.4	110.7
17735.4	19813.6	22160	20664.3	100
19640.2	17735.4	19813.6	22160	113.3
20844.4	19640.2	17735.4	19813.6	122.4
19823.1	20844.4	19640.2	17735.4	112.5
18594.6	19823.1	20844.4	19640.2	104.2
21350.6	18594.6	19823.1	20844.4	92.5
18574.1	21350.6	18594.6	19823.1	117.2
18924.2	18574.1	21350.6	18594.6	109.3
17343.4	18924.2	18574.1	21350.6	106.1
19961.2	17343.4	18924.2	18574.1	118.8
19932.1	19961.2	17343.4	18924.2	105.3
19464.6	19932.1	19961.2	17343.4	106
16165.4	19464.6	19932.1	19961.2	102
17574.9	16165.4	19464.6	19932.1	112.9
19795.4	17574.9	16165.4	19464.6	116.5
19439.5	19795.4	17574.9	16165.4	114.8
17170	19439.5	19795.4	17574.9	100.5
21072.4	17170	19439.5	19795.4	85.4
17751.8	21072.4	17170	19439.5	114.6
17515.5	17751.8	21072.4	17170	109.9
18040.3	17515.5	17751.8	21072.4	100.7
19090.1	18040.3	17515.5	17751.8	115.5
17746.5	19090.1	18040.3	17515.5	100.7
19202.1	17746.5	19090.1	18040.3	99
15141.6	19202.1	17746.5	19090.1	102.3
16258.1	15141.6	19202.1	17746.5	108.8
18586.5	16258.1	15141.6	19202.1	105.9
17209.4	18586.5	16258.1	15141.6	113.2
17838.7	17209.4	18586.5	16258.1	95.7
19123.5	17838.7	17209.4	18586.5	80.9
16583.6	19123.5	17838.7	17209.4	113.9
15991.2	16583.6	19123.5	17838.7	98.1
16704.4	15991.2	16583.6	19123.5	102.8
17420.4	16704.4	15991.2	16583.6	104.7
17872	17420.4	16704.4	15991.2	95.9
17823.2	17872	17420.4	16704.4	94.6


Summary of computational transaction
Raw Inputview raw input (R code)
Raw Outputview raw output of R engine
Computing time3 seconds
R Server'Gwilym Jenkins' @ 72.249.127.135

\begin{tabular}{lllllllll}
\hline
Summary of computational transaction \tabularnewline
Raw Input & view raw input (R code)  \tabularnewline
Raw Output & view raw output of R engine  \tabularnewline
Computing time & 3 seconds \tabularnewline
R Server & 'Gwilym Jenkins' @ 72.249.127.135 \tabularnewline
\hline
\end{tabular}
%Source: https://freestatistics.org/blog/index.php?pk=57390&T=0

[TABLE]
[ROW][C]Summary of computational transaction[/C][/ROW]
[ROW][C]Raw Input[/C][C]view raw input (R code) [/C][/ROW]
[ROW][C]Raw Output[/C][C]view raw output of R engine [/C][/ROW]
[ROW][C]Computing time[/C][C]3 seconds[/C][/ROW]
[ROW][C]R Server[/C][C]'Gwilym Jenkins' @ 72.249.127.135[/C][/ROW]
[/TABLE]
Source: https://freestatistics.org/blog/index.php?pk=57390&T=0

Globally Unique Identifier (entire table): ba.freestatistics.org/blog/index.php?pk=57390&T=0

As an alternative you can also use a QR Code:  

The GUIDs for individual cells are displayed in the table below:

Summary of computational transaction
Raw Inputview raw input (R code)
Raw Outputview raw output of R engine
Computing time3 seconds
R Server'Gwilym Jenkins' @ 72.249.127.135


Multiple Linear Regression - Estimated Regression Equation
uitvoer[t] = + 9486.87770849843 + 0.318535135680348uitvoer1[t] + 0.315810646656787uitvoer2[t] + 0.347323160619945uitvoer3[t] -70.0796722770106indproc[t] -2475.72420865457M1[t] -1731.61352082471M2[t] -1874.84363157971M3[t] -2511.57931145036M4[t] -2856.95818219675M5[t] + 289.214687944714M6[t] + 420.325783557970M7[t] -504.489001948494M8[t] -4938.92262906067M9[t] -1376.62966118202M10[t] + 1409.51340847633M11[t] -15.8575218202351t + e[t]

\begin{tabular}{lllllllll}
\hline
Multiple Linear Regression - Estimated Regression Equation \tabularnewline
uitvoer[t] =  +  9486.87770849843 +  0.318535135680348uitvoer1[t] +  0.315810646656787uitvoer2[t] +  0.347323160619945uitvoer3[t] -70.0796722770106indproc[t] -2475.72420865457M1[t] -1731.61352082471M2[t] -1874.84363157971M3[t] -2511.57931145036M4[t] -2856.95818219675M5[t] +  289.214687944714M6[t] +  420.325783557970M7[t] -504.489001948494M8[t] -4938.92262906067M9[t] -1376.62966118202M10[t] +  1409.51340847633M11[t] -15.8575218202351t  + e[t] \tabularnewline
\hline
\end{tabular}
%Source: https://freestatistics.org/blog/index.php?pk=57390&T=1

[TABLE]
[ROW][C]Multiple Linear Regression - Estimated Regression Equation[/C][/ROW]
[ROW][C]uitvoer[t] =  +  9486.87770849843 +  0.318535135680348uitvoer1[t] +  0.315810646656787uitvoer2[t] +  0.347323160619945uitvoer3[t] -70.0796722770106indproc[t] -2475.72420865457M1[t] -1731.61352082471M2[t] -1874.84363157971M3[t] -2511.57931145036M4[t] -2856.95818219675M5[t] +  289.214687944714M6[t] +  420.325783557970M7[t] -504.489001948494M8[t] -4938.92262906067M9[t] -1376.62966118202M10[t] +  1409.51340847633M11[t] -15.8575218202351t  + e[t][/C][/ROW]
[/TABLE]
Source: https://freestatistics.org/blog/index.php?pk=57390&T=1

Globally Unique Identifier (entire table): ba.freestatistics.org/blog/index.php?pk=57390&T=1

As an alternative you can also use a QR Code:  

The GUIDs for individual cells are displayed in the table below:

Multiple Linear Regression - Estimated Regression Equation
uitvoer[t] = + 9486.87770849843 + 0.318535135680348uitvoer1[t] + 0.315810646656787uitvoer2[t] + 0.347323160619945uitvoer3[t] -70.0796722770106indproc[t] -2475.72420865457M1[t] -1731.61352082471M2[t] -1874.84363157971M3[t] -2511.57931145036M4[t] -2856.95818219675M5[t] + 289.214687944714M6[t] + 420.325783557970M7[t] -504.489001948494M8[t] -4938.92262906067M9[t] -1376.62966118202M10[t] + 1409.51340847633M11[t] -15.8575218202351t + e[t]


Multiple Linear Regression - Ordinary Least Squares
VariableParameterS.D.T-STATH0: parameter = 02-tail p-value1-tail p-value
(Intercept)9486.877708498432815.2405493.36980.0017050.000853
uitvoer10.3185351356803480.1454962.18930.0346250.017312
uitvoer20.3158106466567870.1365082.31350.0260560.013028
uitvoer30.3473231606199450.1360012.55380.0146760.007338
indproc-70.079672277010632.509416-2.15570.0373390.018669
M1-2475.72420865457993.900594-2.49090.0171060.008553
M2-1731.613520824711280.493891-1.35230.1840690.092034
M3-1874.84363157971788.041807-2.37910.0223440.011172
M4-2511.57931145036949.378819-2.64550.0116980.005849
M5-2856.958182196751048.276869-2.72540.0095670.004784
M6289.214687944714909.4290690.3180.7521680.376084
M7420.325783557970871.2041140.48250.6321720.316086
M8-504.489001948494851.274346-0.59260.5568510.278425
M9-4938.92262906067995.42483-4.96161.4e-057e-06
M10-1376.629661182021177.147116-1.16950.2493150.124658
M111409.513408476331043.0096281.35140.1843580.092179
t-15.857521820235110.67918-1.48490.1456090.072804

\begin{tabular}{lllllllll}
\hline
Multiple Linear Regression - Ordinary Least Squares \tabularnewline
Variable & Parameter & S.D. & T-STATH0: parameter = 0 & 2-tail p-value & 1-tail p-value \tabularnewline
(Intercept) & 9486.87770849843 & 2815.240549 & 3.3698 & 0.001705 & 0.000853 \tabularnewline
uitvoer1 & 0.318535135680348 & 0.145496 & 2.1893 & 0.034625 & 0.017312 \tabularnewline
uitvoer2 & 0.315810646656787 & 0.136508 & 2.3135 & 0.026056 & 0.013028 \tabularnewline
uitvoer3 & 0.347323160619945 & 0.136001 & 2.5538 & 0.014676 & 0.007338 \tabularnewline
indproc & -70.0796722770106 & 32.509416 & -2.1557 & 0.037339 & 0.018669 \tabularnewline
M1 & -2475.72420865457 & 993.900594 & -2.4909 & 0.017106 & 0.008553 \tabularnewline
M2 & -1731.61352082471 & 1280.493891 & -1.3523 & 0.184069 & 0.092034 \tabularnewline
M3 & -1874.84363157971 & 788.041807 & -2.3791 & 0.022344 & 0.011172 \tabularnewline
M4 & -2511.57931145036 & 949.378819 & -2.6455 & 0.011698 & 0.005849 \tabularnewline
M5 & -2856.95818219675 & 1048.276869 & -2.7254 & 0.009567 & 0.004784 \tabularnewline
M6 & 289.214687944714 & 909.429069 & 0.318 & 0.752168 & 0.376084 \tabularnewline
M7 & 420.325783557970 & 871.204114 & 0.4825 & 0.632172 & 0.316086 \tabularnewline
M8 & -504.489001948494 & 851.274346 & -0.5926 & 0.556851 & 0.278425 \tabularnewline
M9 & -4938.92262906067 & 995.42483 & -4.9616 & 1.4e-05 & 7e-06 \tabularnewline
M10 & -1376.62966118202 & 1177.147116 & -1.1695 & 0.249315 & 0.124658 \tabularnewline
M11 & 1409.51340847633 & 1043.009628 & 1.3514 & 0.184358 & 0.092179 \tabularnewline
t & -15.8575218202351 & 10.67918 & -1.4849 & 0.145609 & 0.072804 \tabularnewline
\hline
\end{tabular}
%Source: https://freestatistics.org/blog/index.php?pk=57390&T=2

[TABLE]
[ROW][C]Multiple Linear Regression - Ordinary Least Squares[/C][/ROW]
[ROW][C]Variable[/C][C]Parameter[/C][C]S.D.[/C][C]T-STATH0: parameter = 0[/C][C]2-tail p-value[/C][C]1-tail p-value[/C][/ROW]
[ROW][C](Intercept)[/C][C]9486.87770849843[/C][C]2815.240549[/C][C]3.3698[/C][C]0.001705[/C][C]0.000853[/C][/ROW]
[ROW][C]uitvoer1[/C][C]0.318535135680348[/C][C]0.145496[/C][C]2.1893[/C][C]0.034625[/C][C]0.017312[/C][/ROW]
[ROW][C]uitvoer2[/C][C]0.315810646656787[/C][C]0.136508[/C][C]2.3135[/C][C]0.026056[/C][C]0.013028[/C][/ROW]
[ROW][C]uitvoer3[/C][C]0.347323160619945[/C][C]0.136001[/C][C]2.5538[/C][C]0.014676[/C][C]0.007338[/C][/ROW]
[ROW][C]indproc[/C][C]-70.0796722770106[/C][C]32.509416[/C][C]-2.1557[/C][C]0.037339[/C][C]0.018669[/C][/ROW]
[ROW][C]M1[/C][C]-2475.72420865457[/C][C]993.900594[/C][C]-2.4909[/C][C]0.017106[/C][C]0.008553[/C][/ROW]
[ROW][C]M2[/C][C]-1731.61352082471[/C][C]1280.493891[/C][C]-1.3523[/C][C]0.184069[/C][C]0.092034[/C][/ROW]
[ROW][C]M3[/C][C]-1874.84363157971[/C][C]788.041807[/C][C]-2.3791[/C][C]0.022344[/C][C]0.011172[/C][/ROW]
[ROW][C]M4[/C][C]-2511.57931145036[/C][C]949.378819[/C][C]-2.6455[/C][C]0.011698[/C][C]0.005849[/C][/ROW]
[ROW][C]M5[/C][C]-2856.95818219675[/C][C]1048.276869[/C][C]-2.7254[/C][C]0.009567[/C][C]0.004784[/C][/ROW]
[ROW][C]M6[/C][C]289.214687944714[/C][C]909.429069[/C][C]0.318[/C][C]0.752168[/C][C]0.376084[/C][/ROW]
[ROW][C]M7[/C][C]420.325783557970[/C][C]871.204114[/C][C]0.4825[/C][C]0.632172[/C][C]0.316086[/C][/ROW]
[ROW][C]M8[/C][C]-504.489001948494[/C][C]851.274346[/C][C]-0.5926[/C][C]0.556851[/C][C]0.278425[/C][/ROW]
[ROW][C]M9[/C][C]-4938.92262906067[/C][C]995.42483[/C][C]-4.9616[/C][C]1.4e-05[/C][C]7e-06[/C][/ROW]
[ROW][C]M10[/C][C]-1376.62966118202[/C][C]1177.147116[/C][C]-1.1695[/C][C]0.249315[/C][C]0.124658[/C][/ROW]
[ROW][C]M11[/C][C]1409.51340847633[/C][C]1043.009628[/C][C]1.3514[/C][C]0.184358[/C][C]0.092179[/C][/ROW]
[ROW][C]t[/C][C]-15.8575218202351[/C][C]10.67918[/C][C]-1.4849[/C][C]0.145609[/C][C]0.072804[/C][/ROW]
[/TABLE]
Source: https://freestatistics.org/blog/index.php?pk=57390&T=2

Globally Unique Identifier (entire table): ba.freestatistics.org/blog/index.php?pk=57390&T=2

As an alternative you can also use a QR Code:  

The GUIDs for individual cells are displayed in the table below:

Multiple Linear Regression - Ordinary Least Squares
VariableParameterS.D.T-STATH0: parameter = 02-tail p-value1-tail p-value
(Intercept)9486.877708498432815.2405493.36980.0017050.000853
uitvoer10.3185351356803480.1454962.18930.0346250.017312
uitvoer20.3158106466567870.1365082.31350.0260560.013028
uitvoer30.3473231606199450.1360012.55380.0146760.007338
indproc-70.079672277010632.509416-2.15570.0373390.018669
M1-2475.72420865457993.900594-2.49090.0171060.008553
M2-1731.613520824711280.493891-1.35230.1840690.092034
M3-1874.84363157971788.041807-2.37910.0223440.011172
M4-2511.57931145036949.378819-2.64550.0116980.005849
M5-2856.958182196751048.276869-2.72540.0095670.004784
M6289.214687944714909.4290690.3180.7521680.376084
M7420.325783557970871.2041140.48250.6321720.316086
M8-504.489001948494851.274346-0.59260.5568510.278425
M9-4938.92262906067995.42483-4.96161.4e-057e-06
M10-1376.629661182021177.147116-1.16950.2493150.124658
M111409.513408476331043.0096281.35140.1843580.092179
t-15.857521820235110.67918-1.48490.1456090.072804


Multiple Linear Regression - Regression Statistics
Multiple R0.901321613188379
R-squared0.8123806504005
Adjusted R-squared0.735408609539168
F-TEST (value)10.5542303583197
F-TEST (DF numerator)16
F-TEST (DF denominator)39
p-value1.30710486878627e-09
Multiple Linear Regression - Residual Statistics
Residual Standard Deviation1064.52415988787
Sum Squared Residuals44195255.7924141

\begin{tabular}{lllllllll}
\hline
Multiple Linear Regression - Regression Statistics \tabularnewline
Multiple R & 0.901321613188379 \tabularnewline
R-squared & 0.8123806504005 \tabularnewline
Adjusted R-squared & 0.735408609539168 \tabularnewline
F-TEST (value) & 10.5542303583197 \tabularnewline
F-TEST (DF numerator) & 16 \tabularnewline
F-TEST (DF denominator) & 39 \tabularnewline
p-value & 1.30710486878627e-09 \tabularnewline
Multiple Linear Regression - Residual Statistics \tabularnewline
Residual Standard Deviation & 1064.52415988787 \tabularnewline
Sum Squared Residuals & 44195255.7924141 \tabularnewline
\hline
\end{tabular}
%Source: https://freestatistics.org/blog/index.php?pk=57390&T=3

[TABLE]
[ROW][C]Multiple Linear Regression - Regression Statistics[/C][/ROW]
[ROW][C]Multiple R[/C][C]0.901321613188379[/C][/ROW]
[ROW][C]R-squared[/C][C]0.8123806504005[/C][/ROW]
[ROW][C]Adjusted R-squared[/C][C]0.735408609539168[/C][/ROW]
[ROW][C]F-TEST (value)[/C][C]10.5542303583197[/C][/ROW]
[ROW][C]F-TEST (DF numerator)[/C][C]16[/C][/ROW]
[ROW][C]F-TEST (DF denominator)[/C][C]39[/C][/ROW]
[ROW][C]p-value[/C][C]1.30710486878627e-09[/C][/ROW]
[ROW][C]Multiple Linear Regression - Residual Statistics[/C][/ROW]
[ROW][C]Residual Standard Deviation[/C][C]1064.52415988787[/C][/ROW]
[ROW][C]Sum Squared Residuals[/C][C]44195255.7924141[/C][/ROW]
[/TABLE]
Source: https://freestatistics.org/blog/index.php?pk=57390&T=3

Globally Unique Identifier (entire table): ba.freestatistics.org/blog/index.php?pk=57390&T=3

As an alternative you can also use a QR Code:  

The GUIDs for individual cells are displayed in the table below:

Multiple Linear Regression - Regression Statistics
Multiple R0.901321613188379
R-squared0.8123806504005
Adjusted R-squared0.735408609539168
F-TEST (value)10.5542303583197
F-TEST (DF numerator)16
F-TEST (DF denominator)39
p-value1.30710486878627e-09
Multiple Linear Regression - Residual Statistics
Residual Standard Deviation1064.52415988787
Sum Squared Residuals44195255.7924141


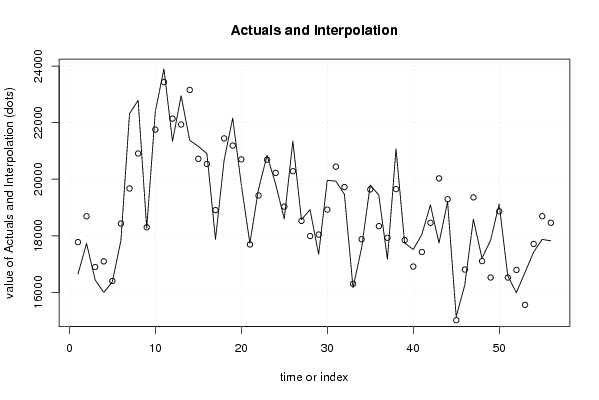
Multiple Linear Regression - Actuals, Interpolation, and Residuals
Time or IndexActualsInterpolationForecastResidualsPrediction Error
11664317777.2295754169-1134.22957541690
21772918690.8158377375-961.815837737508
316446.116896.1142170079-450.014217007912
415993.817096.7214064261-1102.92140642607
516373.516402.2677995914-28.7677995913770
617842.218434.3918501951-592.191850195139
722321.519674.08577029152647.41422970853
822786.720910.11287605941876.5871239406
918274.118301.4655093036-27.3655093036077
1022392.921755.7527196678637.14728033221
1123899.323432.1697364478467.130263552168
1221343.522142.9828918718-799.482891871844
1322952.321934.93528241961017.36471758040
1421374.423158.0092877969-1783.60928779687
1521164.120722.1072207481441.992779251905
1620906.520539.5237329529366.976267047075
1717877.418907.1231826294-1029.72318262942
1820664.321443.7664102817-779.466410281726
192216021190.4140609075969.585939092494
2019813.620701.3981731335-887.798173133549
2117735.417693.861575741141.5384242589451
2219640.219424.7308115681215.469188431897
2320844.420692.7603181686151.639681831429
2419823.120224.5072811522-401.407281152171
2518594.619031.1472335592-436.54723355919
2621350.620283.72128761451066.87871238551
2718574.118528.854060373145.2459396268812
2818924.217989.1651048186935.034895181373
2917343.418044.0771847661-700.677184766133
3019961.218927.06290461911034.13709538091
3119932.120444.6177006338-512.517700633771
3219464.619723.300908775-258.700908774991
3316165.416304.4457530732-139.045753073231
3417574.917878.3530703895-303.453070389541
3519795.419641.0310087320154.368991268029
3619439.518341.34932503001098.15067497004
371717017929.349789123-759.349789122983
3821072.419651.72458510041420.67541489965
3917751.817849.0174600632-97.2174600631835
4017515.516912.2405010206603.259498979442
4118040.317427.1803095559613.11969044408
4219090.118459.5364044228630.563595577155
4317746.520030.0322778638-2283.53227786384
4419202.119294.3248166616-92.2248166615862
4515141.615016.7271618821124.872838117894
4616258.116807.2633983746-549.163398374566
4718586.519359.6389366516-773.138936651626
4817209.417106.6605019460102.739498053976
4917838.716525.93811948131312.76188051867
5019123.518865.6290017508257.870998249224
5116583.616523.607041807759.9929581923087
5215991.216793.5492547818-802.349254781824
5316704.415558.35152345711146.04847654285
5417420.417713.4424304812-293.042430481198
551787218692.9501903034-820.95019030341
5617823.218461.0632253705-637.863225370472

\begin{tabular}{lllllllll}
\hline
Multiple Linear Regression - Actuals, Interpolation, and Residuals \tabularnewline
Time or Index & Actuals & InterpolationForecast & ResidualsPrediction Error \tabularnewline
1 & 16643 & 17777.2295754169 & -1134.22957541690 \tabularnewline
2 & 17729 & 18690.8158377375 & -961.815837737508 \tabularnewline
3 & 16446.1 & 16896.1142170079 & -450.014217007912 \tabularnewline
4 & 15993.8 & 17096.7214064261 & -1102.92140642607 \tabularnewline
5 & 16373.5 & 16402.2677995914 & -28.7677995913770 \tabularnewline
6 & 17842.2 & 18434.3918501951 & -592.191850195139 \tabularnewline
7 & 22321.5 & 19674.0857702915 & 2647.41422970853 \tabularnewline
8 & 22786.7 & 20910.1128760594 & 1876.5871239406 \tabularnewline
9 & 18274.1 & 18301.4655093036 & -27.3655093036077 \tabularnewline
10 & 22392.9 & 21755.7527196678 & 637.14728033221 \tabularnewline
11 & 23899.3 & 23432.1697364478 & 467.130263552168 \tabularnewline
12 & 21343.5 & 22142.9828918718 & -799.482891871844 \tabularnewline
13 & 22952.3 & 21934.9352824196 & 1017.36471758040 \tabularnewline
14 & 21374.4 & 23158.0092877969 & -1783.60928779687 \tabularnewline
15 & 21164.1 & 20722.1072207481 & 441.992779251905 \tabularnewline
16 & 20906.5 & 20539.5237329529 & 366.976267047075 \tabularnewline
17 & 17877.4 & 18907.1231826294 & -1029.72318262942 \tabularnewline
18 & 20664.3 & 21443.7664102817 & -779.466410281726 \tabularnewline
19 & 22160 & 21190.4140609075 & 969.585939092494 \tabularnewline
20 & 19813.6 & 20701.3981731335 & -887.798173133549 \tabularnewline
21 & 17735.4 & 17693.8615757411 & 41.5384242589451 \tabularnewline
22 & 19640.2 & 19424.7308115681 & 215.469188431897 \tabularnewline
23 & 20844.4 & 20692.7603181686 & 151.639681831429 \tabularnewline
24 & 19823.1 & 20224.5072811522 & -401.407281152171 \tabularnewline
25 & 18594.6 & 19031.1472335592 & -436.54723355919 \tabularnewline
26 & 21350.6 & 20283.7212876145 & 1066.87871238551 \tabularnewline
27 & 18574.1 & 18528.8540603731 & 45.2459396268812 \tabularnewline
28 & 18924.2 & 17989.1651048186 & 935.034895181373 \tabularnewline
29 & 17343.4 & 18044.0771847661 & -700.677184766133 \tabularnewline
30 & 19961.2 & 18927.0629046191 & 1034.13709538091 \tabularnewline
31 & 19932.1 & 20444.6177006338 & -512.517700633771 \tabularnewline
32 & 19464.6 & 19723.300908775 & -258.700908774991 \tabularnewline
33 & 16165.4 & 16304.4457530732 & -139.045753073231 \tabularnewline
34 & 17574.9 & 17878.3530703895 & -303.453070389541 \tabularnewline
35 & 19795.4 & 19641.0310087320 & 154.368991268029 \tabularnewline
36 & 19439.5 & 18341.3493250300 & 1098.15067497004 \tabularnewline
37 & 17170 & 17929.349789123 & -759.349789122983 \tabularnewline
38 & 21072.4 & 19651.7245851004 & 1420.67541489965 \tabularnewline
39 & 17751.8 & 17849.0174600632 & -97.2174600631835 \tabularnewline
40 & 17515.5 & 16912.2405010206 & 603.259498979442 \tabularnewline
41 & 18040.3 & 17427.1803095559 & 613.11969044408 \tabularnewline
42 & 19090.1 & 18459.5364044228 & 630.563595577155 \tabularnewline
43 & 17746.5 & 20030.0322778638 & -2283.53227786384 \tabularnewline
44 & 19202.1 & 19294.3248166616 & -92.2248166615862 \tabularnewline
45 & 15141.6 & 15016.7271618821 & 124.872838117894 \tabularnewline
46 & 16258.1 & 16807.2633983746 & -549.163398374566 \tabularnewline
47 & 18586.5 & 19359.6389366516 & -773.138936651626 \tabularnewline
48 & 17209.4 & 17106.6605019460 & 102.739498053976 \tabularnewline
49 & 17838.7 & 16525.9381194813 & 1312.76188051867 \tabularnewline
50 & 19123.5 & 18865.6290017508 & 257.870998249224 \tabularnewline
51 & 16583.6 & 16523.6070418077 & 59.9929581923087 \tabularnewline
52 & 15991.2 & 16793.5492547818 & -802.349254781824 \tabularnewline
53 & 16704.4 & 15558.3515234571 & 1146.04847654285 \tabularnewline
54 & 17420.4 & 17713.4424304812 & -293.042430481198 \tabularnewline
55 & 17872 & 18692.9501903034 & -820.95019030341 \tabularnewline
56 & 17823.2 & 18461.0632253705 & -637.863225370472 \tabularnewline
\hline
\end{tabular}
%Source: https://freestatistics.org/blog/index.php?pk=57390&T=4

[TABLE]
[ROW][C]Multiple Linear Regression - Actuals, Interpolation, and Residuals[/C][/ROW]
[ROW][C]Time or Index[/C][C]Actuals[/C][C]InterpolationForecast[/C][C]ResidualsPrediction Error[/C][/ROW]
[ROW][C]1[/C][C]16643[/C][C]17777.2295754169[/C][C]-1134.22957541690[/C][/ROW]
[ROW][C]2[/C][C]17729[/C][C]18690.8158377375[/C][C]-961.815837737508[/C][/ROW]
[ROW][C]3[/C][C]16446.1[/C][C]16896.1142170079[/C][C]-450.014217007912[/C][/ROW]
[ROW][C]4[/C][C]15993.8[/C][C]17096.7214064261[/C][C]-1102.92140642607[/C][/ROW]
[ROW][C]5[/C][C]16373.5[/C][C]16402.2677995914[/C][C]-28.7677995913770[/C][/ROW]
[ROW][C]6[/C][C]17842.2[/C][C]18434.3918501951[/C][C]-592.191850195139[/C][/ROW]
[ROW][C]7[/C][C]22321.5[/C][C]19674.0857702915[/C][C]2647.41422970853[/C][/ROW]
[ROW][C]8[/C][C]22786.7[/C][C]20910.1128760594[/C][C]1876.5871239406[/C][/ROW]
[ROW][C]9[/C][C]18274.1[/C][C]18301.4655093036[/C][C]-27.3655093036077[/C][/ROW]
[ROW][C]10[/C][C]22392.9[/C][C]21755.7527196678[/C][C]637.14728033221[/C][/ROW]
[ROW][C]11[/C][C]23899.3[/C][C]23432.1697364478[/C][C]467.130263552168[/C][/ROW]
[ROW][C]12[/C][C]21343.5[/C][C]22142.9828918718[/C][C]-799.482891871844[/C][/ROW]
[ROW][C]13[/C][C]22952.3[/C][C]21934.9352824196[/C][C]1017.36471758040[/C][/ROW]
[ROW][C]14[/C][C]21374.4[/C][C]23158.0092877969[/C][C]-1783.60928779687[/C][/ROW]
[ROW][C]15[/C][C]21164.1[/C][C]20722.1072207481[/C][C]441.992779251905[/C][/ROW]
[ROW][C]16[/C][C]20906.5[/C][C]20539.5237329529[/C][C]366.976267047075[/C][/ROW]
[ROW][C]17[/C][C]17877.4[/C][C]18907.1231826294[/C][C]-1029.72318262942[/C][/ROW]
[ROW][C]18[/C][C]20664.3[/C][C]21443.7664102817[/C][C]-779.466410281726[/C][/ROW]
[ROW][C]19[/C][C]22160[/C][C]21190.4140609075[/C][C]969.585939092494[/C][/ROW]
[ROW][C]20[/C][C]19813.6[/C][C]20701.3981731335[/C][C]-887.798173133549[/C][/ROW]
[ROW][C]21[/C][C]17735.4[/C][C]17693.8615757411[/C][C]41.5384242589451[/C][/ROW]
[ROW][C]22[/C][C]19640.2[/C][C]19424.7308115681[/C][C]215.469188431897[/C][/ROW]
[ROW][C]23[/C][C]20844.4[/C][C]20692.7603181686[/C][C]151.639681831429[/C][/ROW]
[ROW][C]24[/C][C]19823.1[/C][C]20224.5072811522[/C][C]-401.407281152171[/C][/ROW]
[ROW][C]25[/C][C]18594.6[/C][C]19031.1472335592[/C][C]-436.54723355919[/C][/ROW]
[ROW][C]26[/C][C]21350.6[/C][C]20283.7212876145[/C][C]1066.87871238551[/C][/ROW]
[ROW][C]27[/C][C]18574.1[/C][C]18528.8540603731[/C][C]45.2459396268812[/C][/ROW]
[ROW][C]28[/C][C]18924.2[/C][C]17989.1651048186[/C][C]935.034895181373[/C][/ROW]
[ROW][C]29[/C][C]17343.4[/C][C]18044.0771847661[/C][C]-700.677184766133[/C][/ROW]
[ROW][C]30[/C][C]19961.2[/C][C]18927.0629046191[/C][C]1034.13709538091[/C][/ROW]
[ROW][C]31[/C][C]19932.1[/C][C]20444.6177006338[/C][C]-512.517700633771[/C][/ROW]
[ROW][C]32[/C][C]19464.6[/C][C]19723.300908775[/C][C]-258.700908774991[/C][/ROW]
[ROW][C]33[/C][C]16165.4[/C][C]16304.4457530732[/C][C]-139.045753073231[/C][/ROW]
[ROW][C]34[/C][C]17574.9[/C][C]17878.3530703895[/C][C]-303.453070389541[/C][/ROW]
[ROW][C]35[/C][C]19795.4[/C][C]19641.0310087320[/C][C]154.368991268029[/C][/ROW]
[ROW][C]36[/C][C]19439.5[/C][C]18341.3493250300[/C][C]1098.15067497004[/C][/ROW]
[ROW][C]37[/C][C]17170[/C][C]17929.349789123[/C][C]-759.349789122983[/C][/ROW]
[ROW][C]38[/C][C]21072.4[/C][C]19651.7245851004[/C][C]1420.67541489965[/C][/ROW]
[ROW][C]39[/C][C]17751.8[/C][C]17849.0174600632[/C][C]-97.2174600631835[/C][/ROW]
[ROW][C]40[/C][C]17515.5[/C][C]16912.2405010206[/C][C]603.259498979442[/C][/ROW]
[ROW][C]41[/C][C]18040.3[/C][C]17427.1803095559[/C][C]613.11969044408[/C][/ROW]
[ROW][C]42[/C][C]19090.1[/C][C]18459.5364044228[/C][C]630.563595577155[/C][/ROW]
[ROW][C]43[/C][C]17746.5[/C][C]20030.0322778638[/C][C]-2283.53227786384[/C][/ROW]
[ROW][C]44[/C][C]19202.1[/C][C]19294.3248166616[/C][C]-92.2248166615862[/C][/ROW]
[ROW][C]45[/C][C]15141.6[/C][C]15016.7271618821[/C][C]124.872838117894[/C][/ROW]
[ROW][C]46[/C][C]16258.1[/C][C]16807.2633983746[/C][C]-549.163398374566[/C][/ROW]
[ROW][C]47[/C][C]18586.5[/C][C]19359.6389366516[/C][C]-773.138936651626[/C][/ROW]
[ROW][C]48[/C][C]17209.4[/C][C]17106.6605019460[/C][C]102.739498053976[/C][/ROW]
[ROW][C]49[/C][C]17838.7[/C][C]16525.9381194813[/C][C]1312.76188051867[/C][/ROW]
[ROW][C]50[/C][C]19123.5[/C][C]18865.6290017508[/C][C]257.870998249224[/C][/ROW]
[ROW][C]51[/C][C]16583.6[/C][C]16523.6070418077[/C][C]59.9929581923087[/C][/ROW]
[ROW][C]52[/C][C]15991.2[/C][C]16793.5492547818[/C][C]-802.349254781824[/C][/ROW]
[ROW][C]53[/C][C]16704.4[/C][C]15558.3515234571[/C][C]1146.04847654285[/C][/ROW]
[ROW][C]54[/C][C]17420.4[/C][C]17713.4424304812[/C][C]-293.042430481198[/C][/ROW]
[ROW][C]55[/C][C]17872[/C][C]18692.9501903034[/C][C]-820.95019030341[/C][/ROW]
[ROW][C]56[/C][C]17823.2[/C][C]18461.0632253705[/C][C]-637.863225370472[/C][/ROW]
[/TABLE]
Source: https://freestatistics.org/blog/index.php?pk=57390&T=4

Globally Unique Identifier (entire table): ba.freestatistics.org/blog/index.php?pk=57390&T=4

As an alternative you can also use a QR Code:  

The GUIDs for individual cells are displayed in the table below:

Multiple Linear Regression - Actuals, Interpolation, and Residuals
Time or IndexActualsInterpolationForecastResidualsPrediction Error
11664317777.2295754169-1134.22957541690
21772918690.8158377375-961.815837737508
316446.116896.1142170079-450.014217007912
415993.817096.7214064261-1102.92140642607
516373.516402.2677995914-28.7677995913770
617842.218434.3918501951-592.191850195139
722321.519674.08577029152647.41422970853
822786.720910.11287605941876.5871239406
918274.118301.4655093036-27.3655093036077
1022392.921755.7527196678637.14728033221
1123899.323432.1697364478467.130263552168
1221343.522142.9828918718-799.482891871844
1322952.321934.93528241961017.36471758040
1421374.423158.0092877969-1783.60928779687
1521164.120722.1072207481441.992779251905
1620906.520539.5237329529366.976267047075
1717877.418907.1231826294-1029.72318262942
1820664.321443.7664102817-779.466410281726
192216021190.4140609075969.585939092494
2019813.620701.3981731335-887.798173133549
2117735.417693.861575741141.5384242589451
2219640.219424.7308115681215.469188431897
2320844.420692.7603181686151.639681831429
2419823.120224.5072811522-401.407281152171
2518594.619031.1472335592-436.54723355919
2621350.620283.72128761451066.87871238551
2718574.118528.854060373145.2459396268812
2818924.217989.1651048186935.034895181373
2917343.418044.0771847661-700.677184766133
3019961.218927.06290461911034.13709538091
3119932.120444.6177006338-512.517700633771
3219464.619723.300908775-258.700908774991
3316165.416304.4457530732-139.045753073231
3417574.917878.3530703895-303.453070389541
3519795.419641.0310087320154.368991268029
3619439.518341.34932503001098.15067497004
371717017929.349789123-759.349789122983
3821072.419651.72458510041420.67541489965
3917751.817849.0174600632-97.2174600631835
4017515.516912.2405010206603.259498979442
4118040.317427.1803095559613.11969044408
4219090.118459.5364044228630.563595577155
4317746.520030.0322778638-2283.53227786384
4419202.119294.3248166616-92.2248166615862
4515141.615016.7271618821124.872838117894
4616258.116807.2633983746-549.163398374566
4718586.519359.6389366516-773.138936651626
4817209.417106.6605019460102.739498053976
4917838.716525.93811948131312.76188051867
5019123.518865.6290017508257.870998249224
5116583.616523.607041807759.9929581923087
5215991.216793.5492547818-802.349254781824
5316704.415558.35152345711146.04847654285
5417420.417713.4424304812-293.042430481198
551787218692.9501903034-820.95019030341
5617823.218461.0632253705-637.863225370472


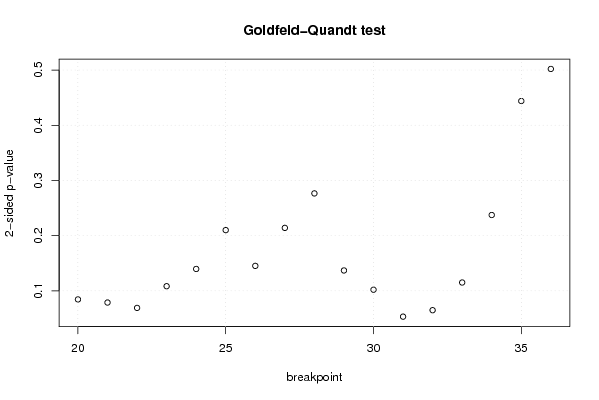
Goldfeld-Quandt test for Heteroskedasticity
p-valuesAlternative Hypothesis
breakpoint indexgreater2-sidedless
200.9577402890337930.08451942193241480.0422597109662074
210.960574474370890.078851051258220.03942552562911
220.9654417080550750.06911658388985050.0345582919449253
230.9457873638005710.1084252723988580.0542126361994288
240.930162310549880.1396753789002410.0698376894501207
250.8949634442358630.2100731115282740.105036555764137
260.9273627088833020.1452745822333970.0726372911166985
270.8929315210214540.2141369579570910.107068478978546
280.8616986963279750.2766026073440490.138301303672025
290.9314996015169010.1370007969661970.0685003984830987
300.9489434509892250.1021130980215510.0510565490107755
310.9733555567364370.05328888652712690.0266444432635634
320.9674975459388430.06500490812231450.0325024540611572
330.9424283604841570.1151432790316870.0575716395158435
340.8812841414875870.2374317170248260.118715858512413
350.7780039404458520.4439921191082960.221996059554148
360.7489530020634410.5020939958731170.251046997936559

\begin{tabular}{lllllllll}
\hline
Goldfeld-Quandt test for Heteroskedasticity \tabularnewline
p-values & Alternative Hypothesis \tabularnewline
breakpoint index & greater & 2-sided & less \tabularnewline
20 & 0.957740289033793 & 0.0845194219324148 & 0.0422597109662074 \tabularnewline
21 & 0.96057447437089 & 0.07885105125822 & 0.03942552562911 \tabularnewline
22 & 0.965441708055075 & 0.0691165838898505 & 0.0345582919449253 \tabularnewline
23 & 0.945787363800571 & 0.108425272398858 & 0.0542126361994288 \tabularnewline
24 & 0.93016231054988 & 0.139675378900241 & 0.0698376894501207 \tabularnewline
25 & 0.894963444235863 & 0.210073111528274 & 0.105036555764137 \tabularnewline
26 & 0.927362708883302 & 0.145274582233397 & 0.0726372911166985 \tabularnewline
27 & 0.892931521021454 & 0.214136957957091 & 0.107068478978546 \tabularnewline
28 & 0.861698696327975 & 0.276602607344049 & 0.138301303672025 \tabularnewline
29 & 0.931499601516901 & 0.137000796966197 & 0.0685003984830987 \tabularnewline
30 & 0.948943450989225 & 0.102113098021551 & 0.0510565490107755 \tabularnewline
31 & 0.973355556736437 & 0.0532888865271269 & 0.0266444432635634 \tabularnewline
32 & 0.967497545938843 & 0.0650049081223145 & 0.0325024540611572 \tabularnewline
33 & 0.942428360484157 & 0.115143279031687 & 0.0575716395158435 \tabularnewline
34 & 0.881284141487587 & 0.237431717024826 & 0.118715858512413 \tabularnewline
35 & 0.778003940445852 & 0.443992119108296 & 0.221996059554148 \tabularnewline
36 & 0.748953002063441 & 0.502093995873117 & 0.251046997936559 \tabularnewline
\hline
\end{tabular}
%Source: https://freestatistics.org/blog/index.php?pk=57390&T=5

[TABLE]
[ROW][C]Goldfeld-Quandt test for Heteroskedasticity[/C][/ROW]
[ROW][C]p-values[/C][C]Alternative Hypothesis[/C][/ROW]
[ROW][C]breakpoint index[/C][C]greater[/C][C]2-sided[/C][C]less[/C][/ROW]
[ROW][C]20[/C][C]0.957740289033793[/C][C]0.0845194219324148[/C][C]0.0422597109662074[/C][/ROW]
[ROW][C]21[/C][C]0.96057447437089[/C][C]0.07885105125822[/C][C]0.03942552562911[/C][/ROW]
[ROW][C]22[/C][C]0.965441708055075[/C][C]0.0691165838898505[/C][C]0.0345582919449253[/C][/ROW]
[ROW][C]23[/C][C]0.945787363800571[/C][C]0.108425272398858[/C][C]0.0542126361994288[/C][/ROW]
[ROW][C]24[/C][C]0.93016231054988[/C][C]0.139675378900241[/C][C]0.0698376894501207[/C][/ROW]
[ROW][C]25[/C][C]0.894963444235863[/C][C]0.210073111528274[/C][C]0.105036555764137[/C][/ROW]
[ROW][C]26[/C][C]0.927362708883302[/C][C]0.145274582233397[/C][C]0.0726372911166985[/C][/ROW]
[ROW][C]27[/C][C]0.892931521021454[/C][C]0.214136957957091[/C][C]0.107068478978546[/C][/ROW]
[ROW][C]28[/C][C]0.861698696327975[/C][C]0.276602607344049[/C][C]0.138301303672025[/C][/ROW]
[ROW][C]29[/C][C]0.931499601516901[/C][C]0.137000796966197[/C][C]0.0685003984830987[/C][/ROW]
[ROW][C]30[/C][C]0.948943450989225[/C][C]0.102113098021551[/C][C]0.0510565490107755[/C][/ROW]
[ROW][C]31[/C][C]0.973355556736437[/C][C]0.0532888865271269[/C][C]0.0266444432635634[/C][/ROW]
[ROW][C]32[/C][C]0.967497545938843[/C][C]0.0650049081223145[/C][C]0.0325024540611572[/C][/ROW]
[ROW][C]33[/C][C]0.942428360484157[/C][C]0.115143279031687[/C][C]0.0575716395158435[/C][/ROW]
[ROW][C]34[/C][C]0.881284141487587[/C][C]0.237431717024826[/C][C]0.118715858512413[/C][/ROW]
[ROW][C]35[/C][C]0.778003940445852[/C][C]0.443992119108296[/C][C]0.221996059554148[/C][/ROW]
[ROW][C]36[/C][C]0.748953002063441[/C][C]0.502093995873117[/C][C]0.251046997936559[/C][/ROW]
[/TABLE]
Source: https://freestatistics.org/blog/index.php?pk=57390&T=5

Globally Unique Identifier (entire table): ba.freestatistics.org/blog/index.php?pk=57390&T=5

As an alternative you can also use a QR Code:  

The GUIDs for individual cells are displayed in the table below:

Goldfeld-Quandt test for Heteroskedasticity
p-valuesAlternative Hypothesis
breakpoint indexgreater2-sidedless
200.9577402890337930.08451942193241480.0422597109662074
210.960574474370890.078851051258220.03942552562911
220.9654417080550750.06911658388985050.0345582919449253
230.9457873638005710.1084252723988580.0542126361994288
240.930162310549880.1396753789002410.0698376894501207
250.8949634442358630.2100731115282740.105036555764137
260.9273627088833020.1452745822333970.0726372911166985
270.8929315210214540.2141369579570910.107068478978546
280.8616986963279750.2766026073440490.138301303672025
290.9314996015169010.1370007969661970.0685003984830987
300.9489434509892250.1021130980215510.0510565490107755
310.9733555567364370.05328888652712690.0266444432635634
320.9674975459388430.06500490812231450.0325024540611572
330.9424283604841570.1151432790316870.0575716395158435
340.8812841414875870.2374317170248260.118715858512413
350.7780039404458520.4439921191082960.221996059554148
360.7489530020634410.5020939958731170.251046997936559


Meta Analysis of Goldfeld-Quandt test for Heteroskedasticity
Description# significant tests% significant testsOK/NOK
1% type I error level00OK
5% type I error level00OK
10% type I error level50.294117647058824NOK

\begin{tabular}{lllllllll}
\hline
Meta Analysis of Goldfeld-Quandt test for Heteroskedasticity \tabularnewline
Description & # significant tests & % significant tests & OK/NOK \tabularnewline
1% type I error level & 0 & 0 & OK \tabularnewline
5% type I error level & 0 & 0 & OK \tabularnewline
10% type I error level & 5 & 0.294117647058824 & NOK \tabularnewline
\hline
\end{tabular}
%Source: https://freestatistics.org/blog/index.php?pk=57390&T=6

[TABLE]
[ROW][C]Meta Analysis of Goldfeld-Quandt test for Heteroskedasticity[/C][/ROW]
[ROW][C]Description[/C][C]# significant tests[/C][C]% significant tests[/C][C]OK/NOK[/C][/ROW]
[ROW][C]1% type I error level[/C][C]0[/C][C]0[/C][C]OK[/C][/ROW]
[ROW][C]5% type I error level[/C][C]0[/C][C]0[/C][C]OK[/C][/ROW]
[ROW][C]10% type I error level[/C][C]5[/C][C]0.294117647058824[/C][C]NOK[/C][/ROW]
[/TABLE]
Source: https://freestatistics.org/blog/index.php?pk=57390&T=6

Globally Unique Identifier (entire table): ba.freestatistics.org/blog/index.php?pk=57390&T=6

As an alternative you can also use a QR Code:  

The GUIDs for individual cells are displayed in the table below:

Meta Analysis of Goldfeld-Quandt test for Heteroskedasticity
Description# significant tests% significant testsOK/NOK
1% type I error level00OK
5% type I error level00OK
10% type I error level50.294117647058824NOK


Parameters (Session):
par1 = 1 ; par2 = Include Monthly Dummies ; par3 = Linear Trend ;
Parameters (R input):
par1 = 1 ; par2 = Include Monthly Dummies ; par3 = Linear Trend ;
R code (references can be found in the software module):
library(lattice)
library(lmtest)
n25 <- 25 #minimum number of obs. for Goldfeld-Quandt test
par1 <- as.numeric(par1)
x <- t(y)
k <- length(x[1,])
n <- length(x[,1])
x1 <- cbind(x[,par1], x[,1:k!=par1])
mycolnames <- c(colnames(x)[par1], colnames(x)[1:k!=par1])
colnames(x1) <- mycolnames #colnames(x)[par1]
x <- x1
if (par3 == 'First Differences'){
x2 <- array(0, dim=c(n-1,k), dimnames=list(1:(n-1), paste('(1-B)',colnames(x),sep='')))
for (i in 1:n-1) {
for (j in 1:k) {
x2[i,j] <- x[i+1,j] - x[i,j]
}
}
x <- x2
}
if (par2 == 'Include Monthly Dummies'){
x2 <- array(0, dim=c(n,11), dimnames=list(1:n, paste('M', seq(1:11), sep ='')))
for (i in 1:11){
x2[seq(i,n,12),i] <- 1
}
x <- cbind(x, x2)
}
if (par2 == 'Include Quarterly Dummies'){
x2 <- array(0, dim=c(n,3), dimnames=list(1:n, paste('Q', seq(1:3), sep ='')))
for (i in 1:3){
x2[seq(i,n,4),i] <- 1
}
x <- cbind(x, x2)
}
k <- length(x[1,])
if (par3 == 'Linear Trend'){
x <- cbind(x, c(1:n))
colnames(x)[k+1] <- 't'
}
x
k <- length(x[1,])
df <- as.data.frame(x)
(mylm <- lm(df))
(mysum <- summary(mylm))
if (n > n25) {
kp3 <- k + 3
nmkm3 <- n - k - 3
gqarr <- array(NA, dim=c(nmkm3-kp3+1,3))
numgqtests <- 0
numsignificant1 <- 0
numsignificant5 <- 0
numsignificant10 <- 0
for (mypoint in kp3:nmkm3) {
j <- 0
numgqtests <- numgqtests + 1
for (myalt in c('greater', 'two.sided', 'less')) {
j <- j + 1
gqarr[mypoint-kp3+1,j] <- gqtest(mylm, point=mypoint, alternative=myalt)$p.value
}
if (gqarr[mypoint-kp3+1,2] < 0.01) numsignificant1 <- numsignificant1 + 1
if (gqarr[mypoint-kp3+1,2] < 0.05) numsignificant5 <- numsignificant5 + 1
if (gqarr[mypoint-kp3+1,2] < 0.10) numsignificant10 <- numsignificant10 + 1
}
gqarr
}
bitmap(file='test0.png')
plot(x[,1], type='l', main='Actuals and Interpolation', ylab='value of Actuals and Interpolation (dots)', xlab='time or index')
points(x[,1]-mysum$resid)
grid()
dev.off()
bitmap(file='test1.png')
plot(mysum$resid, type='b', pch=19, main='Residuals', ylab='value of Residuals', xlab='time or index')
grid()
dev.off()
bitmap(file='test2.png')
hist(mysum$resid, main='Residual Histogram', xlab='values of Residuals')
grid()
dev.off()
bitmap(file='test3.png')
densityplot(~mysum$resid,col='black',main='Residual Density Plot', xlab='values of Residuals')
dev.off()
bitmap(file='test4.png')
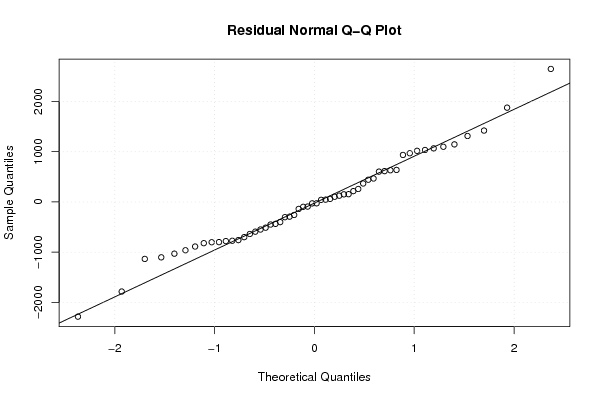
qqnorm(mysum$resid, main='Residual Normal Q-Q Plot')
qqline(mysum$resid)
grid()
dev.off()
(myerror <- as.ts(mysum$resid))
bitmap(file='test5.png')
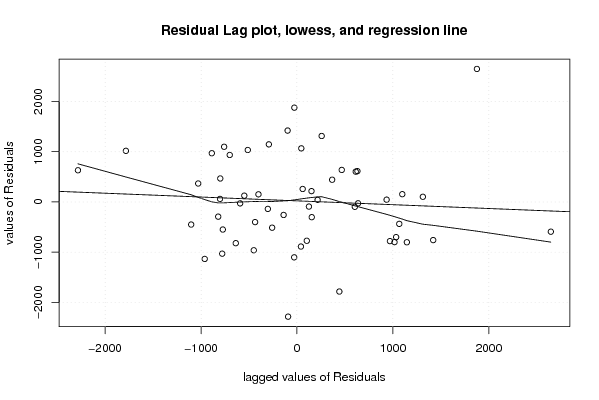
dum <- cbind(lag(myerror,k=1),myerror)
dum
dum1 <- dum[2:length(myerror),]
dum1
z <- as.data.frame(dum1)
z
plot(z,main=paste('Residual Lag plot, lowess, and regression line'), ylab='values of Residuals', xlab='lagged values of Residuals')
lines(lowess(z))
abline(lm(z))
grid()
dev.off()
bitmap(file='test6.png')
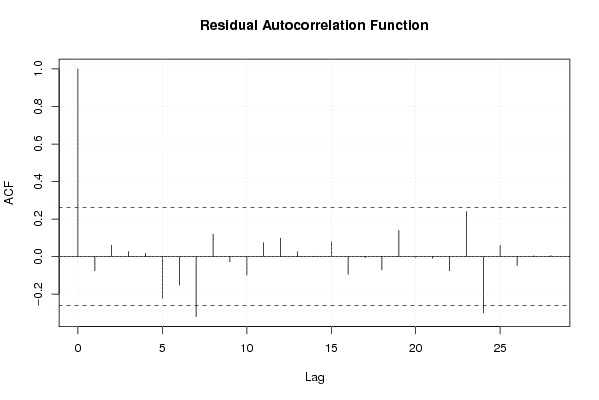
acf(mysum$resid, lag.max=length(mysum$resid)/2, main='Residual Autocorrelation Function')
grid()
dev.off()
bitmap(file='test7.png')
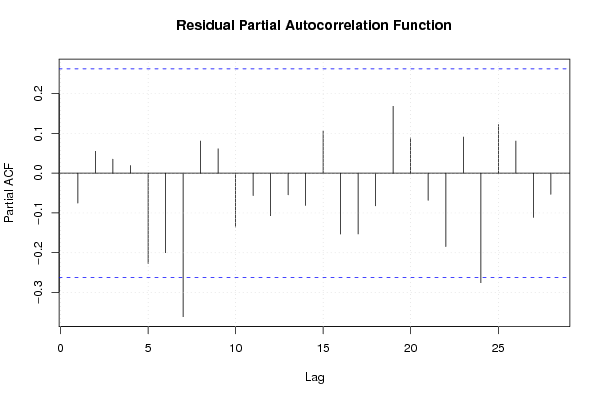
pacf(mysum$resid, lag.max=length(mysum$resid)/2, main='Residual Partial Autocorrelation Function')
grid()
dev.off()
bitmap(file='test8.png')
opar <- par(mfrow = c(2,2), oma = c(0, 0, 1.1, 0))
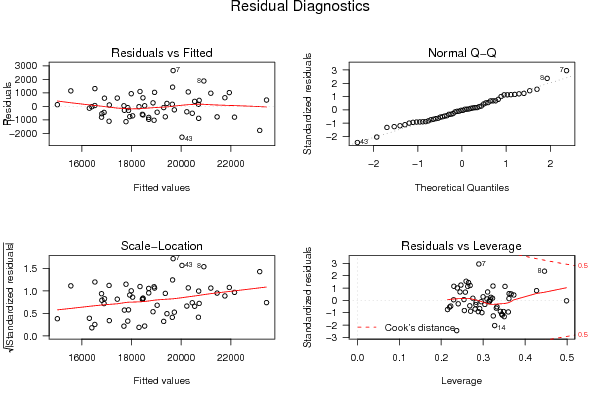
plot(mylm, las = 1, sub='Residual Diagnostics')
par(opar)
dev.off()
if (n > n25) {
bitmap(file='test9.png')
plot(kp3:nmkm3,gqarr[,2], main='Goldfeld-Quandt test',ylab='2-sided p-value',xlab='breakpoint')
grid()
dev.off()
}
load(file='createtable')
a<-table.start()
a<-table.row.start(a)
a<-table.element(a, 'Multiple Linear Regression - Estimated Regression Equation', 1, TRUE)
a<-table.row.end(a)
myeq <- colnames(x)[1]
myeq <- paste(myeq, '[t] = ', sep='')
for (i in 1:k){
if (mysum$coefficients[i,1] > 0) myeq <- paste(myeq, '+', '')
myeq <- paste(myeq, mysum$coefficients[i,1], sep=' ')
if (rownames(mysum$coefficients)[i] != '(Intercept)') {
myeq <- paste(myeq, rownames(mysum$coefficients)[i], sep='')
if (rownames(mysum$coefficients)[i] != 't') myeq <- paste(myeq, '[t]', sep='')
}
}
myeq <- paste(myeq, ' + e[t]')
a<-table.row.start(a)
a<-table.element(a, myeq)
a<-table.row.end(a)
a<-table.end(a)
table.save(a,file='mytable1.tab')
a<-table.start()
a<-table.row.start(a)
a<-table.element(a,hyperlink('ols1.htm','Multiple Linear Regression - Ordinary Least Squares',''), 6, TRUE)
a<-table.row.end(a)
a<-table.row.start(a)
a<-table.element(a,'Variable',header=TRUE)
a<-table.element(a,'Parameter',header=TRUE)
a<-table.element(a,'S.D.',header=TRUE)
a<-table.element(a,'T-STAT
H0: parameter = 0',header=TRUE)
a<-table.element(a,'2-tail p-value',header=TRUE)
a<-table.element(a,'1-tail p-value',header=TRUE)
a<-table.row.end(a)
for (i in 1:k){
a<-table.row.start(a)
a<-table.element(a,rownames(mysum$coefficients)[i],header=TRUE)
a<-table.element(a,mysum$coefficients[i,1])
a<-table.element(a, round(mysum$coefficients[i,2],6))
a<-table.element(a, round(mysum$coefficients[i,3],4))
a<-table.element(a, round(mysum$coefficients[i,4],6))
a<-table.element(a, round(mysum$coefficients[i,4]/2,6))
a<-table.row.end(a)
}
a<-table.end(a)
table.save(a,file='mytable2.tab')
a<-table.start()
a<-table.row.start(a)
a<-table.element(a, 'Multiple Linear Regression - Regression Statistics', 2, TRUE)
a<-table.row.end(a)
a<-table.row.start(a)
a<-table.element(a, 'Multiple R',1,TRUE)
a<-table.element(a, sqrt(mysum$r.squared))
a<-table.row.end(a)
a<-table.row.start(a)
a<-table.element(a, 'R-squared',1,TRUE)
a<-table.element(a, mysum$r.squared)
a<-table.row.end(a)
a<-table.row.start(a)
a<-table.element(a, 'Adjusted R-squared',1,TRUE)
a<-table.element(a, mysum$adj.r.squared)
a<-table.row.end(a)
a<-table.row.start(a)
a<-table.element(a, 'F-TEST (value)',1,TRUE)
a<-table.element(a, mysum$fstatistic[1])
a<-table.row.end(a)
a<-table.row.start(a)
a<-table.element(a, 'F-TEST (DF numerator)',1,TRUE)
a<-table.element(a, mysum$fstatistic[2])
a<-table.row.end(a)
a<-table.row.start(a)
a<-table.element(a, 'F-TEST (DF denominator)',1,TRUE)
a<-table.element(a, mysum$fstatistic[3])
a<-table.row.end(a)
a<-table.row.start(a)
a<-table.element(a, 'p-value',1,TRUE)
a<-table.element(a, 1-pf(mysum$fstatistic[1],mysum$fstatistic[2],mysum$fstatistic[3]))
a<-table.row.end(a)
a<-table.row.start(a)
a<-table.element(a, 'Multiple Linear Regression - Residual Statistics', 2, TRUE)
a<-table.row.end(a)
a<-table.row.start(a)
a<-table.element(a, 'Residual Standard Deviation',1,TRUE)
a<-table.element(a, mysum$sigma)
a<-table.row.end(a)
a<-table.row.start(a)
a<-table.element(a, 'Sum Squared Residuals',1,TRUE)
a<-table.element(a, sum(myerror*myerror))
a<-table.row.end(a)
a<-table.end(a)
table.save(a,file='mytable3.tab')
a<-table.start()
a<-table.row.start(a)
a<-table.element(a, 'Multiple Linear Regression - Actuals, Interpolation, and Residuals', 4, TRUE)
a<-table.row.end(a)
a<-table.row.start(a)
a<-table.element(a, 'Time or Index', 1, TRUE)
a<-table.element(a, 'Actuals', 1, TRUE)
a<-table.element(a, 'Interpolation
Forecast', 1, TRUE)
a<-table.element(a, 'Residuals
Prediction Error', 1, TRUE)
a<-table.row.end(a)
for (i in 1:n) {
a<-table.row.start(a)
a<-table.element(a,i, 1, TRUE)
a<-table.element(a,x[i])
a<-table.element(a,x[i]-mysum$resid[i])
a<-table.element(a,mysum$resid[i])
a<-table.row.end(a)
}
a<-table.end(a)
table.save(a,file='mytable4.tab')
if (n > n25) {
a<-table.start()
a<-table.row.start(a)
a<-table.element(a,'Goldfeld-Quandt test for Heteroskedasticity',4,TRUE)
a<-table.row.end(a)
a<-table.row.start(a)
a<-table.element(a,'p-values',header=TRUE)
a<-table.element(a,'Alternative Hypothesis',3,header=TRUE)
a<-table.row.end(a)
a<-table.row.start(a)
a<-table.element(a,'breakpoint index',header=TRUE)
a<-table.element(a,'greater',header=TRUE)
a<-table.element(a,'2-sided',header=TRUE)
a<-table.element(a,'less',header=TRUE)
a<-table.row.end(a)
for (mypoint in kp3:nmkm3) {
a<-table.row.start(a)
a<-table.element(a,mypoint,header=TRUE)
a<-table.element(a,gqarr[mypoint-kp3+1,1])
a<-table.element(a,gqarr[mypoint-kp3+1,2])
a<-table.element(a,gqarr[mypoint-kp3+1,3])
a<-table.row.end(a)
}
a<-table.end(a)
table.save(a,file='mytable5.tab')
a<-table.start()
a<-table.row.start(a)
a<-table.element(a,'Meta Analysis of Goldfeld-Quandt test for Heteroskedasticity',4,TRUE)
a<-table.row.end(a)
a<-table.row.start(a)
a<-table.element(a,'Description',header=TRUE)
a<-table.element(a,'# significant tests',header=TRUE)
a<-table.element(a,'% significant tests',header=TRUE)
a<-table.element(a,'OK/NOK',header=TRUE)
a<-table.row.end(a)
a<-table.row.start(a)
a<-table.element(a,'1% type I error level',header=TRUE)
a<-table.element(a,numsignificant1)
a<-table.element(a,numsignificant1/numgqtests)
if (numsignificant1/numgqtests < 0.01) dum <- 'OK' else dum <- 'NOK'
a<-table.element(a,dum)
a<-table.row.end(a)
a<-table.row.start(a)
a<-table.element(a,'5% type I error level',header=TRUE)
a<-table.element(a,numsignificant5)
a<-table.element(a,numsignificant5/numgqtests)
if (numsignificant5/numgqtests < 0.05) dum <- 'OK' else dum <- 'NOK'
a<-table.element(a,dum)
a<-table.row.end(a)
a<-table.row.start(a)
a<-table.element(a,'10% type I error level',header=TRUE)
a<-table.element(a,numsignificant10)
a<-table.element(a,numsignificant10/numgqtests)
if (numsignificant10/numgqtests < 0.1) dum <- 'OK' else dum <- 'NOK'
a<-table.element(a,dum)
a<-table.row.end(a)
a<-table.end(a)
table.save(a,file='mytable6.tab')
}