Free Statistics

of Irreproducible Research!

Author's title

Author*The author of this computation has been verified*
R Software Modulerwasp_multipleregression.wasp
Title produced by softwareMultiple Regression
Date of computationWed, 18 Nov 2009 09:31:11 -0700
Cite this page as followsStatistical Computations at FreeStatistics.org, Office for Research Development and Education, URL https://freestatistics.org/blog/index.php?v=date/2009/Nov/18/t1258562031h3utabkcc1niq5y.htm/, Retrieved Wed, 15 Jan 2025 10:06:13 +0000
Statistical Computations at FreeStatistics.org, Office for Research Development and Education, URL https://freestatistics.org/blog/index.php?pk=57524, Retrieved Wed, 15 Jan 2025 10:06:13 +0000
QR Codes:

Original text written by user:
IsPrivate?No (this computation is public)
User-defined keywordsws7multipleregressionincludemonthlydummieswmanecogr
Estimated Impact289
Family? (F = Feedback message, R = changed R code, M = changed R Module, P = changed Parameters, D = changed Data)
-     [Multiple Regression] [Q1 The Seatbeltlaw] [2007-11-14 19:27:43] [8cd6641b921d30ebe00b648d1481bba0]
- RMPD  [Multiple Regression] [Seatbelt] [2009-11-12 14:03:14] [b98453cac15ba1066b407e146608df68]
F    D      [Multiple Regression] [] [2009-11-18 16:31:11] [2b548c9d2e9bba6e1eaf65bd4d551f41] [Current]
Feedback Forum
2009-11-25 18:04:53 [Nick Aerts] [reply
Uit het vorige model blijkt duidelijk dat je te maken hebt met een dalende trend op lange termijn. Je merkt niet veel seizoenaliteit op in dit model. Dit is de verbetering van model 2: http://www.freestatistics.org/blog/index.php?v=date/2009/Nov/25/t1259170139ejbxbdrwasqhwp2.htm/

Uit dit model blijkt dat door het toevoegen van deze trend er een t-waarde ontstaat van -0.0192854525358532. Elke maand dalen je gegevens met deze waarde. Deze waarde is ook significant want de alfa-waarde is bijna 0. Ook de adjusted R² verbetert, deze stijgt naar 35,7%. Deze R² is ook significant door de lage p-waarde. We kunnen nog altijd maar 35,7% van de schommelingen verklaren, maar dit is al een stuk meer dan 10%.
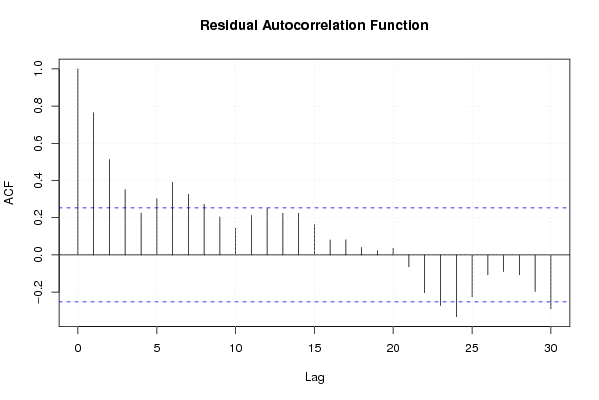
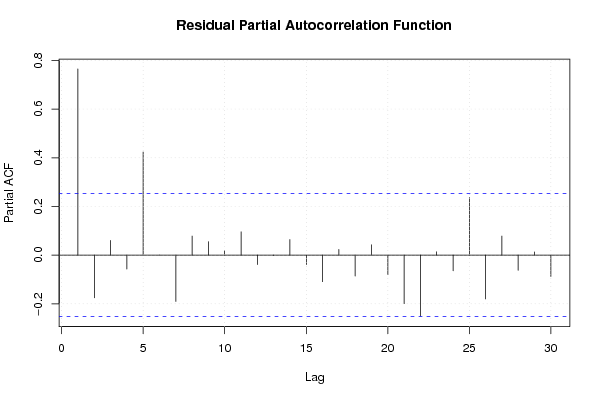
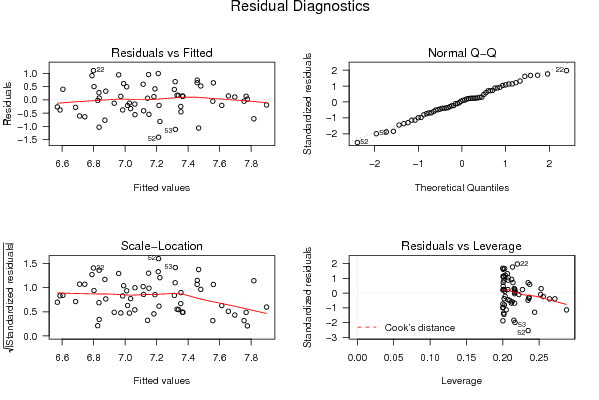
Bij de grafiek van de autocorrelatie zien we nu duidelijk een verbetering. Er zijn nu nog maar 2 waarden die buiten het betrouwbaarheidsinterval liggen, dus het model is al een heel stuk beter.
De waarden die nog buiten dit betrouwbaarheidsinterval liggen zijn te verwijderen door 2 vertragingen toe te voegen, dit omdat ze langs de linkerkant liggen (groot verband tussen deze maand en de vorige; groot verband tussen deze maand en die van twee maanden geleden).
We krijgen volgend resultaat: http://www.freestatistics.org/blog/index.php?v=date/2009/Nov/25/t1259171201rxzeiixgpinoanm.htm/

De toegevoegde vertragingen, Yt-1 en Yt-2 zijn significant, want de alfa-waarde is bijna 0. Ook R² wordt groter: 87% en is significant, want p is 0. De standaardafwijking is nu ook gehalveerd tov model 2.

Als we nu de autocorrelatiefunctie gaan bekijken zien we op lag 6 en lag 12 een hogere waarde dan het betrouwbaarheidsinterval. Misschien is dit te wijten aan seizoenaliteit?

Vandaar deze berekening: http://www.freestatistics.org/blog/index.php?v=date/2009/Nov/25/t1259171886bgqs03q5ujwq8sh.htm/

We merken op dat de p-waarden van deze maanden enorm hoog liggen, en besluiten hier dus om de nulhypothese NIET te verwerpen. De rest van de gegevens, zoals R² is hier niet meer van toepassing!

Conclusie: Het model met de dalende trend en de twee vertragingen is het beste model, maar is zeker nog niet perfect.

Post a new message
Dataseries X:
8,00	96,80
8,10	114,10
7,70	110,30
7,50	103,90
7,60	101,60
7,80	94,60
7,80	95,90
7,80	104,70
7,50	102,80
7,50	98,10
7,10	113,90
7,50	80,90
7,50	95,70
7,60	113,20
7,70	105,90
7,70	108,80
7,90	102,30
8,10	99,00
8,20	100,70
8,20	115,50
8,20	100,70
7,90	109,90
7,30	114,60
6,90	85,40
6,60	100,50
6,70	114,80
6,90	116,50
7,00	112,90
7,10	102,00
7,20	106,00
7,10	105,30
6,90	118,80
7,00	106,10
6,80	109,30
6,40	117,20
6,70	92,50
6,60	104,20
6,40	112,50
6,30	122,40
6,20	113,30
6,50	100,00
6,80	110,70
6,80	112,80
6,40	109,80
6,10	117,30
5,80	109,10
6,10	115,90
7,20	96,00
7,30	99,80
6,90	116,80
6,10	115,70
5,80	99,40
6,20	94,30
7,10	91,00
7,70	93,20
7,90	103,10
7,70	94,10
7,40	91,80
7,50	102,70
8,00	82,60


Summary of computational transaction
Raw Inputview raw input (R code)
Raw Outputview raw output of R engine
Computing time4 seconds
R Server'Gwilym Jenkins' @ 72.249.127.135

\begin{tabular}{lllllllll}
\hline
Summary of computational transaction \tabularnewline
Raw Input & view raw input (R code)  \tabularnewline
Raw Output & view raw output of R engine  \tabularnewline
Computing time & 4 seconds \tabularnewline
R Server & 'Gwilym Jenkins' @ 72.249.127.135 \tabularnewline
\hline
\end{tabular}
%Source: https://freestatistics.org/blog/index.php?pk=57524&T=0

[TABLE]
[ROW][C]Summary of computational transaction[/C][/ROW]
[ROW][C]Raw Input[/C][C]view raw input (R code) [/C][/ROW]
[ROW][C]Raw Output[/C][C]view raw output of R engine [/C][/ROW]
[ROW][C]Computing time[/C][C]4 seconds[/C][/ROW]
[ROW][C]R Server[/C][C]'Gwilym Jenkins' @ 72.249.127.135[/C][/ROW]
[/TABLE]
Source: https://freestatistics.org/blog/index.php?pk=57524&T=0

Globally Unique Identifier (entire table): ba.freestatistics.org/blog/index.php?pk=57524&T=0

As an alternative you can also use a QR Code:  

The GUIDs for individual cells are displayed in the table below:

Summary of computational transaction
Raw Inputview raw input (R code)
Raw Outputview raw output of R engine
Computing time4 seconds
R Server'Gwilym Jenkins' @ 72.249.127.135


Multiple Linear Regression - Estimated Regression Equation
Wman[t] = + 11.1977497209993 -0.0450131426726024Ecogr[t] + 0.476556660657418M1[t] + 1.08635222362574M2[t] + 0.880950646505031M3[t] + 0.488365219133116M4[t] + 0.365365071967885M5[t] + 0.715267963355858M6[t] + 0.894685311683693M7[t] + 1.21080096720259M8[t] + 0.792619745485912M9[t] + 0.547412385589255M10[t] + 0.762433561030648M11[t] + e[t]

\begin{tabular}{lllllllll}
\hline
Multiple Linear Regression - Estimated Regression Equation \tabularnewline
Wman[t] =  +  11.1977497209993 -0.0450131426726024Ecogr[t] +  0.476556660657418M1[t] +  1.08635222362574M2[t] +  0.880950646505031M3[t] +  0.488365219133116M4[t] +  0.365365071967885M5[t] +  0.715267963355858M6[t] +  0.894685311683693M7[t] +  1.21080096720259M8[t] +  0.792619745485912M9[t] +  0.547412385589255M10[t] +  0.762433561030648M11[t]  + e[t] \tabularnewline
\hline
\end{tabular}
%Source: https://freestatistics.org/blog/index.php?pk=57524&T=1

[TABLE]
[ROW][C]Multiple Linear Regression - Estimated Regression Equation[/C][/ROW]
[ROW][C]Wman[t] =  +  11.1977497209993 -0.0450131426726024Ecogr[t] +  0.476556660657418M1[t] +  1.08635222362574M2[t] +  0.880950646505031M3[t] +  0.488365219133116M4[t] +  0.365365071967885M5[t] +  0.715267963355858M6[t] +  0.894685311683693M7[t] +  1.21080096720259M8[t] +  0.792619745485912M9[t] +  0.547412385589255M10[t] +  0.762433561030648M11[t]  + e[t][/C][/ROW]
[/TABLE]
Source: https://freestatistics.org/blog/index.php?pk=57524&T=1

Globally Unique Identifier (entire table): ba.freestatistics.org/blog/index.php?pk=57524&T=1

As an alternative you can also use a QR Code:  

The GUIDs for individual cells are displayed in the table below:

Multiple Linear Regression - Estimated Regression Equation
Wman[t] = + 11.1977497209993 -0.0450131426726024Ecogr[t] + 0.476556660657418M1[t] + 1.08635222362574M2[t] + 0.880950646505031M3[t] + 0.488365219133116M4[t] + 0.365365071967885M5[t] + 0.715267963355858M6[t] + 0.894685311683693M7[t] + 1.21080096720259M8[t] + 0.792619745485912M9[t] + 0.547412385589255M10[t] + 0.762433561030648M11[t] + e[t]


Multiple Linear Regression - Ordinary Least Squares
VariableParameterS.D.T-STATH0: parameter = 02-tail p-value1-tail p-value
(Intercept)11.19774972099931.2839928.72100
Ecogr-0.04501314267260240.014316-3.14430.0028840.001442
M10.4765566606574180.4353761.09460.2792760.139638
M21.086352223625740.5546481.95860.0561050.028052
M30.8809506465050310.5534611.59170.1181540.059077
M40.4883652191331160.4938560.98890.3277850.163892
M50.3653650719678850.4390490.83220.4095190.204759
M60.7152679633558580.4403481.62430.1109950.055497
M70.8946853116836930.4485291.99470.0518920.025946
M81.210800967202590.51762.33930.0236230.011812
M90.7926197454859120.4666131.69870.0959930.047997
M100.5474123855892550.4625511.18350.2425770.121289
M110.7624335610306480.5407851.40990.1651630.082582

\begin{tabular}{lllllllll}
\hline
Multiple Linear Regression - Ordinary Least Squares \tabularnewline
Variable & Parameter & S.D. & T-STATH0: parameter = 0 & 2-tail p-value & 1-tail p-value \tabularnewline
(Intercept) & 11.1977497209993 & 1.283992 & 8.721 & 0 & 0 \tabularnewline
Ecogr & -0.0450131426726024 & 0.014316 & -3.1443 & 0.002884 & 0.001442 \tabularnewline
M1 & 0.476556660657418 & 0.435376 & 1.0946 & 0.279276 & 0.139638 \tabularnewline
M2 & 1.08635222362574 & 0.554648 & 1.9586 & 0.056105 & 0.028052 \tabularnewline
M3 & 0.880950646505031 & 0.553461 & 1.5917 & 0.118154 & 0.059077 \tabularnewline
M4 & 0.488365219133116 & 0.493856 & 0.9889 & 0.327785 & 0.163892 \tabularnewline
M5 & 0.365365071967885 & 0.439049 & 0.8322 & 0.409519 & 0.204759 \tabularnewline
M6 & 0.715267963355858 & 0.440348 & 1.6243 & 0.110995 & 0.055497 \tabularnewline
M7 & 0.894685311683693 & 0.448529 & 1.9947 & 0.051892 & 0.025946 \tabularnewline
M8 & 1.21080096720259 & 0.5176 & 2.3393 & 0.023623 & 0.011812 \tabularnewline
M9 & 0.792619745485912 & 0.466613 & 1.6987 & 0.095993 & 0.047997 \tabularnewline
M10 & 0.547412385589255 & 0.462551 & 1.1835 & 0.242577 & 0.121289 \tabularnewline
M11 & 0.762433561030648 & 0.540785 & 1.4099 & 0.165163 & 0.082582 \tabularnewline
\hline
\end{tabular}
%Source: https://freestatistics.org/blog/index.php?pk=57524&T=2

[TABLE]
[ROW][C]Multiple Linear Regression - Ordinary Least Squares[/C][/ROW]
[ROW][C]Variable[/C][C]Parameter[/C][C]S.D.[/C][C]T-STATH0: parameter = 0[/C][C]2-tail p-value[/C][C]1-tail p-value[/C][/ROW]
[ROW][C](Intercept)[/C][C]11.1977497209993[/C][C]1.283992[/C][C]8.721[/C][C]0[/C][C]0[/C][/ROW]
[ROW][C]Ecogr[/C][C]-0.0450131426726024[/C][C]0.014316[/C][C]-3.1443[/C][C]0.002884[/C][C]0.001442[/C][/ROW]
[ROW][C]M1[/C][C]0.476556660657418[/C][C]0.435376[/C][C]1.0946[/C][C]0.279276[/C][C]0.139638[/C][/ROW]
[ROW][C]M2[/C][C]1.08635222362574[/C][C]0.554648[/C][C]1.9586[/C][C]0.056105[/C][C]0.028052[/C][/ROW]
[ROW][C]M3[/C][C]0.880950646505031[/C][C]0.553461[/C][C]1.5917[/C][C]0.118154[/C][C]0.059077[/C][/ROW]
[ROW][C]M4[/C][C]0.488365219133116[/C][C]0.493856[/C][C]0.9889[/C][C]0.327785[/C][C]0.163892[/C][/ROW]
[ROW][C]M5[/C][C]0.365365071967885[/C][C]0.439049[/C][C]0.8322[/C][C]0.409519[/C][C]0.204759[/C][/ROW]
[ROW][C]M6[/C][C]0.715267963355858[/C][C]0.440348[/C][C]1.6243[/C][C]0.110995[/C][C]0.055497[/C][/ROW]
[ROW][C]M7[/C][C]0.894685311683693[/C][C]0.448529[/C][C]1.9947[/C][C]0.051892[/C][C]0.025946[/C][/ROW]
[ROW][C]M8[/C][C]1.21080096720259[/C][C]0.5176[/C][C]2.3393[/C][C]0.023623[/C][C]0.011812[/C][/ROW]
[ROW][C]M9[/C][C]0.792619745485912[/C][C]0.466613[/C][C]1.6987[/C][C]0.095993[/C][C]0.047997[/C][/ROW]
[ROW][C]M10[/C][C]0.547412385589255[/C][C]0.462551[/C][C]1.1835[/C][C]0.242577[/C][C]0.121289[/C][/ROW]
[ROW][C]M11[/C][C]0.762433561030648[/C][C]0.540785[/C][C]1.4099[/C][C]0.165163[/C][C]0.082582[/C][/ROW]
[/TABLE]
Source: https://freestatistics.org/blog/index.php?pk=57524&T=2

Globally Unique Identifier (entire table): ba.freestatistics.org/blog/index.php?pk=57524&T=2

As an alternative you can also use a QR Code:  

The GUIDs for individual cells are displayed in the table below:

Multiple Linear Regression - Ordinary Least Squares
VariableParameterS.D.T-STATH0: parameter = 02-tail p-value1-tail p-value
(Intercept)11.19774972099931.2839928.72100
Ecogr-0.04501314267260240.014316-3.14430.0028840.001442
M10.4765566606574180.4353761.09460.2792760.139638
M21.086352223625740.5546481.95860.0561050.028052
M30.8809506465050310.5534611.59170.1181540.059077
M40.4883652191331160.4938560.98890.3277850.163892
M50.3653650719678850.4390490.83220.4095190.204759
M60.7152679633558580.4403481.62430.1109950.055497
M70.8946853116836930.4485291.99470.0518920.025946
M81.210800967202590.51762.33930.0236230.011812
M90.7926197454859120.4666131.69870.0959930.047997
M100.5474123855892550.4625511.18350.2425770.121289
M110.7624335610306480.5407851.40990.1651630.082582


Multiple Linear Regression - Regression Statistics
Multiple R0.511258890378526
R-squared0.261385652991081
Adjusted R-squared0.0728032665207192
F-TEST (value)1.3860554948071
F-TEST (DF numerator)12
F-TEST (DF denominator)47
p-value0.206207758380558
Multiple Linear Regression - Residual Statistics
Residual Standard Deviation0.633309313388729
Sum Squared Residuals18.8507922619704

\begin{tabular}{lllllllll}
\hline
Multiple Linear Regression - Regression Statistics \tabularnewline
Multiple R & 0.511258890378526 \tabularnewline
R-squared & 0.261385652991081 \tabularnewline
Adjusted R-squared & 0.0728032665207192 \tabularnewline
F-TEST (value) & 1.3860554948071 \tabularnewline
F-TEST (DF numerator) & 12 \tabularnewline
F-TEST (DF denominator) & 47 \tabularnewline
p-value & 0.206207758380558 \tabularnewline
Multiple Linear Regression - Residual Statistics \tabularnewline
Residual Standard Deviation & 0.633309313388729 \tabularnewline
Sum Squared Residuals & 18.8507922619704 \tabularnewline
\hline
\end{tabular}
%Source: https://freestatistics.org/blog/index.php?pk=57524&T=3

[TABLE]
[ROW][C]Multiple Linear Regression - Regression Statistics[/C][/ROW]
[ROW][C]Multiple R[/C][C]0.511258890378526[/C][/ROW]
[ROW][C]R-squared[/C][C]0.261385652991081[/C][/ROW]
[ROW][C]Adjusted R-squared[/C][C]0.0728032665207192[/C][/ROW]
[ROW][C]F-TEST (value)[/C][C]1.3860554948071[/C][/ROW]
[ROW][C]F-TEST (DF numerator)[/C][C]12[/C][/ROW]
[ROW][C]F-TEST (DF denominator)[/C][C]47[/C][/ROW]
[ROW][C]p-value[/C][C]0.206207758380558[/C][/ROW]
[ROW][C]Multiple Linear Regression - Residual Statistics[/C][/ROW]
[ROW][C]Residual Standard Deviation[/C][C]0.633309313388729[/C][/ROW]
[ROW][C]Sum Squared Residuals[/C][C]18.8507922619704[/C][/ROW]
[/TABLE]
Source: https://freestatistics.org/blog/index.php?pk=57524&T=3

Globally Unique Identifier (entire table): ba.freestatistics.org/blog/index.php?pk=57524&T=3

As an alternative you can also use a QR Code:  

The GUIDs for individual cells are displayed in the table below:

Multiple Linear Regression - Regression Statistics
Multiple R0.511258890378526
R-squared0.261385652991081
Adjusted R-squared0.0728032665207192
F-TEST (value)1.3860554948071
F-TEST (DF numerator)12
F-TEST (DF denominator)47
p-value0.206207758380558
Multiple Linear Regression - Residual Statistics
Residual Standard Deviation0.633309313388729
Sum Squared Residuals18.8507922619704


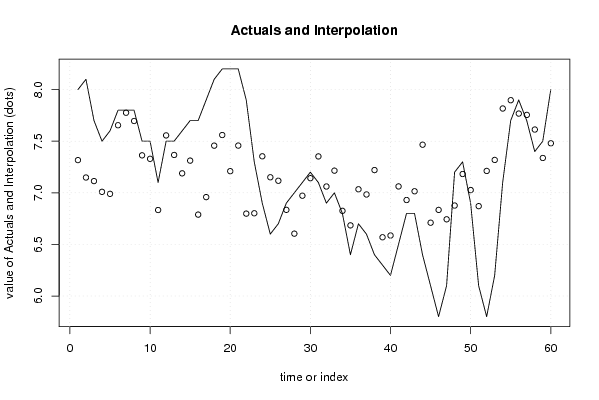
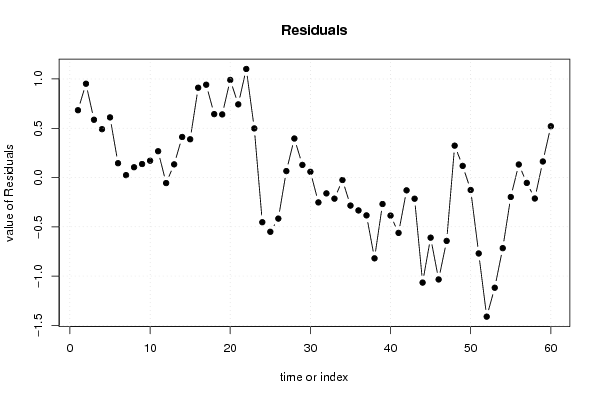
Multiple Linear Regression - Actuals, Interpolation, and Residuals
Time or IndexActualsInterpolationForecastResidualsPrediction Error
187.317034170948770.682965829051226
28.17.148102365681070.951897634318932
37.77.113750730716250.586249269283754
47.57.009249416448990.490750583551015
57.66.989779497430740.610220502569260
67.87.654774387526930.145225612473070
77.87.775674650380380.0243253496196196
87.87.695674650380380.104325349619619
97.57.363018399741640.136981600258357
107.57.329372810406220.170627189593784
117.16.833186331620490.266813668379506
127.57.55618647878572-0.056186478785724
137.57.366548627888630.133451372111374
147.67.188614194086410.411385805913589
157.77.31180855847570.388191441524305
167.76.788685017353230.911314982646767
177.96.958270297559920.941729702440082
188.17.456716559767480.643283440232521
198.27.559611565551890.640388434448109
208.27.209532709516280.990467290483723
218.27.457545999354110.742454000645891
227.96.798217726869511.10178227313049
237.36.801677131749670.498322868250328
246.97.35362733675901-0.453627336759013
256.67.15048554306014-0.550485543060135
266.77.11659316581025-0.416593165810247
276.96.834669246146110.06533075385389
2876.604131132395560.395868867604437
297.16.97177424036170.128225759638300
307.27.141624561059260.058375438940738
317.17.35255110925792-0.252551109257919
326.97.06098933869669-0.160989338696688
3377.21447502892206-0.214475028922055
346.86.82522561247307-0.0252256124730709
356.46.6846429608009-0.284642960800905
366.77.03403402378354-0.334034023783536
376.66.9839369151715-0.383936915171506
386.47.22012339395723-0.820123393957232
396.36.56909170437776-0.269091704377756
406.26.58612587532652-0.386125875326523
416.57.0618005257069-0.561800525706904
426.86.93006279049803-0.130062790498031
436.87.0149525392134-0.214952539213402
446.47.46610762275011-1.06610762275011
456.16.71032783098891-0.610327830988909
465.86.83422824100759-1.03422824100759
476.16.74316004627529-0.643160046275289
487.26.876488024429430.323511975570572
497.37.181994742930960.118005257069043
506.97.02656688046504-0.126566880465042
516.16.87067976028419-0.770679760284192
525.87.2118085584757-1.41180855847570
536.27.31837543894074-1.11837543894074
547.17.8168217011483-0.716821701148298
557.77.8972101355964-0.197210135596408
567.97.767695678656550.132304321343455
577.77.75463274099328-0.0546327409932838
587.47.61295560924361-0.212955609243612
597.57.337333529553640.16266647044636
6087.47966413624230.5203358637577

\begin{tabular}{lllllllll}
\hline
Multiple Linear Regression - Actuals, Interpolation, and Residuals \tabularnewline
Time or Index & Actuals & InterpolationForecast & ResidualsPrediction Error \tabularnewline
1 & 8 & 7.31703417094877 & 0.682965829051226 \tabularnewline
2 & 8.1 & 7.14810236568107 & 0.951897634318932 \tabularnewline
3 & 7.7 & 7.11375073071625 & 0.586249269283754 \tabularnewline
4 & 7.5 & 7.00924941644899 & 0.490750583551015 \tabularnewline
5 & 7.6 & 6.98977949743074 & 0.610220502569260 \tabularnewline
6 & 7.8 & 7.65477438752693 & 0.145225612473070 \tabularnewline
7 & 7.8 & 7.77567465038038 & 0.0243253496196196 \tabularnewline
8 & 7.8 & 7.69567465038038 & 0.104325349619619 \tabularnewline
9 & 7.5 & 7.36301839974164 & 0.136981600258357 \tabularnewline
10 & 7.5 & 7.32937281040622 & 0.170627189593784 \tabularnewline
11 & 7.1 & 6.83318633162049 & 0.266813668379506 \tabularnewline
12 & 7.5 & 7.55618647878572 & -0.056186478785724 \tabularnewline
13 & 7.5 & 7.36654862788863 & 0.133451372111374 \tabularnewline
14 & 7.6 & 7.18861419408641 & 0.411385805913589 \tabularnewline
15 & 7.7 & 7.3118085584757 & 0.388191441524305 \tabularnewline
16 & 7.7 & 6.78868501735323 & 0.911314982646767 \tabularnewline
17 & 7.9 & 6.95827029755992 & 0.941729702440082 \tabularnewline
18 & 8.1 & 7.45671655976748 & 0.643283440232521 \tabularnewline
19 & 8.2 & 7.55961156555189 & 0.640388434448109 \tabularnewline
20 & 8.2 & 7.20953270951628 & 0.990467290483723 \tabularnewline
21 & 8.2 & 7.45754599935411 & 0.742454000645891 \tabularnewline
22 & 7.9 & 6.79821772686951 & 1.10178227313049 \tabularnewline
23 & 7.3 & 6.80167713174967 & 0.498322868250328 \tabularnewline
24 & 6.9 & 7.35362733675901 & -0.453627336759013 \tabularnewline
25 & 6.6 & 7.15048554306014 & -0.550485543060135 \tabularnewline
26 & 6.7 & 7.11659316581025 & -0.416593165810247 \tabularnewline
27 & 6.9 & 6.83466924614611 & 0.06533075385389 \tabularnewline
28 & 7 & 6.60413113239556 & 0.395868867604437 \tabularnewline
29 & 7.1 & 6.9717742403617 & 0.128225759638300 \tabularnewline
30 & 7.2 & 7.14162456105926 & 0.058375438940738 \tabularnewline
31 & 7.1 & 7.35255110925792 & -0.252551109257919 \tabularnewline
32 & 6.9 & 7.06098933869669 & -0.160989338696688 \tabularnewline
33 & 7 & 7.21447502892206 & -0.214475028922055 \tabularnewline
34 & 6.8 & 6.82522561247307 & -0.0252256124730709 \tabularnewline
35 & 6.4 & 6.6846429608009 & -0.284642960800905 \tabularnewline
36 & 6.7 & 7.03403402378354 & -0.334034023783536 \tabularnewline
37 & 6.6 & 6.9839369151715 & -0.383936915171506 \tabularnewline
38 & 6.4 & 7.22012339395723 & -0.820123393957232 \tabularnewline
39 & 6.3 & 6.56909170437776 & -0.269091704377756 \tabularnewline
40 & 6.2 & 6.58612587532652 & -0.386125875326523 \tabularnewline
41 & 6.5 & 7.0618005257069 & -0.561800525706904 \tabularnewline
42 & 6.8 & 6.93006279049803 & -0.130062790498031 \tabularnewline
43 & 6.8 & 7.0149525392134 & -0.214952539213402 \tabularnewline
44 & 6.4 & 7.46610762275011 & -1.06610762275011 \tabularnewline
45 & 6.1 & 6.71032783098891 & -0.610327830988909 \tabularnewline
46 & 5.8 & 6.83422824100759 & -1.03422824100759 \tabularnewline
47 & 6.1 & 6.74316004627529 & -0.643160046275289 \tabularnewline
48 & 7.2 & 6.87648802442943 & 0.323511975570572 \tabularnewline
49 & 7.3 & 7.18199474293096 & 0.118005257069043 \tabularnewline
50 & 6.9 & 7.02656688046504 & -0.126566880465042 \tabularnewline
51 & 6.1 & 6.87067976028419 & -0.770679760284192 \tabularnewline
52 & 5.8 & 7.2118085584757 & -1.41180855847570 \tabularnewline
53 & 6.2 & 7.31837543894074 & -1.11837543894074 \tabularnewline
54 & 7.1 & 7.8168217011483 & -0.716821701148298 \tabularnewline
55 & 7.7 & 7.8972101355964 & -0.197210135596408 \tabularnewline
56 & 7.9 & 7.76769567865655 & 0.132304321343455 \tabularnewline
57 & 7.7 & 7.75463274099328 & -0.0546327409932838 \tabularnewline
58 & 7.4 & 7.61295560924361 & -0.212955609243612 \tabularnewline
59 & 7.5 & 7.33733352955364 & 0.16266647044636 \tabularnewline
60 & 8 & 7.4796641362423 & 0.5203358637577 \tabularnewline
\hline
\end{tabular}
%Source: https://freestatistics.org/blog/index.php?pk=57524&T=4

[TABLE]
[ROW][C]Multiple Linear Regression - Actuals, Interpolation, and Residuals[/C][/ROW]
[ROW][C]Time or Index[/C][C]Actuals[/C][C]InterpolationForecast[/C][C]ResidualsPrediction Error[/C][/ROW]
[ROW][C]1[/C][C]8[/C][C]7.31703417094877[/C][C]0.682965829051226[/C][/ROW]
[ROW][C]2[/C][C]8.1[/C][C]7.14810236568107[/C][C]0.951897634318932[/C][/ROW]
[ROW][C]3[/C][C]7.7[/C][C]7.11375073071625[/C][C]0.586249269283754[/C][/ROW]
[ROW][C]4[/C][C]7.5[/C][C]7.00924941644899[/C][C]0.490750583551015[/C][/ROW]
[ROW][C]5[/C][C]7.6[/C][C]6.98977949743074[/C][C]0.610220502569260[/C][/ROW]
[ROW][C]6[/C][C]7.8[/C][C]7.65477438752693[/C][C]0.145225612473070[/C][/ROW]
[ROW][C]7[/C][C]7.8[/C][C]7.77567465038038[/C][C]0.0243253496196196[/C][/ROW]
[ROW][C]8[/C][C]7.8[/C][C]7.69567465038038[/C][C]0.104325349619619[/C][/ROW]
[ROW][C]9[/C][C]7.5[/C][C]7.36301839974164[/C][C]0.136981600258357[/C][/ROW]
[ROW][C]10[/C][C]7.5[/C][C]7.32937281040622[/C][C]0.170627189593784[/C][/ROW]
[ROW][C]11[/C][C]7.1[/C][C]6.83318633162049[/C][C]0.266813668379506[/C][/ROW]
[ROW][C]12[/C][C]7.5[/C][C]7.55618647878572[/C][C]-0.056186478785724[/C][/ROW]
[ROW][C]13[/C][C]7.5[/C][C]7.36654862788863[/C][C]0.133451372111374[/C][/ROW]
[ROW][C]14[/C][C]7.6[/C][C]7.18861419408641[/C][C]0.411385805913589[/C][/ROW]
[ROW][C]15[/C][C]7.7[/C][C]7.3118085584757[/C][C]0.388191441524305[/C][/ROW]
[ROW][C]16[/C][C]7.7[/C][C]6.78868501735323[/C][C]0.911314982646767[/C][/ROW]
[ROW][C]17[/C][C]7.9[/C][C]6.95827029755992[/C][C]0.941729702440082[/C][/ROW]
[ROW][C]18[/C][C]8.1[/C][C]7.45671655976748[/C][C]0.643283440232521[/C][/ROW]
[ROW][C]19[/C][C]8.2[/C][C]7.55961156555189[/C][C]0.640388434448109[/C][/ROW]
[ROW][C]20[/C][C]8.2[/C][C]7.20953270951628[/C][C]0.990467290483723[/C][/ROW]
[ROW][C]21[/C][C]8.2[/C][C]7.45754599935411[/C][C]0.742454000645891[/C][/ROW]
[ROW][C]22[/C][C]7.9[/C][C]6.79821772686951[/C][C]1.10178227313049[/C][/ROW]
[ROW][C]23[/C][C]7.3[/C][C]6.80167713174967[/C][C]0.498322868250328[/C][/ROW]
[ROW][C]24[/C][C]6.9[/C][C]7.35362733675901[/C][C]-0.453627336759013[/C][/ROW]
[ROW][C]25[/C][C]6.6[/C][C]7.15048554306014[/C][C]-0.550485543060135[/C][/ROW]
[ROW][C]26[/C][C]6.7[/C][C]7.11659316581025[/C][C]-0.416593165810247[/C][/ROW]
[ROW][C]27[/C][C]6.9[/C][C]6.83466924614611[/C][C]0.06533075385389[/C][/ROW]
[ROW][C]28[/C][C]7[/C][C]6.60413113239556[/C][C]0.395868867604437[/C][/ROW]
[ROW][C]29[/C][C]7.1[/C][C]6.9717742403617[/C][C]0.128225759638300[/C][/ROW]
[ROW][C]30[/C][C]7.2[/C][C]7.14162456105926[/C][C]0.058375438940738[/C][/ROW]
[ROW][C]31[/C][C]7.1[/C][C]7.35255110925792[/C][C]-0.252551109257919[/C][/ROW]
[ROW][C]32[/C][C]6.9[/C][C]7.06098933869669[/C][C]-0.160989338696688[/C][/ROW]
[ROW][C]33[/C][C]7[/C][C]7.21447502892206[/C][C]-0.214475028922055[/C][/ROW]
[ROW][C]34[/C][C]6.8[/C][C]6.82522561247307[/C][C]-0.0252256124730709[/C][/ROW]
[ROW][C]35[/C][C]6.4[/C][C]6.6846429608009[/C][C]-0.284642960800905[/C][/ROW]
[ROW][C]36[/C][C]6.7[/C][C]7.03403402378354[/C][C]-0.334034023783536[/C][/ROW]
[ROW][C]37[/C][C]6.6[/C][C]6.9839369151715[/C][C]-0.383936915171506[/C][/ROW]
[ROW][C]38[/C][C]6.4[/C][C]7.22012339395723[/C][C]-0.820123393957232[/C][/ROW]
[ROW][C]39[/C][C]6.3[/C][C]6.56909170437776[/C][C]-0.269091704377756[/C][/ROW]
[ROW][C]40[/C][C]6.2[/C][C]6.58612587532652[/C][C]-0.386125875326523[/C][/ROW]
[ROW][C]41[/C][C]6.5[/C][C]7.0618005257069[/C][C]-0.561800525706904[/C][/ROW]
[ROW][C]42[/C][C]6.8[/C][C]6.93006279049803[/C][C]-0.130062790498031[/C][/ROW]
[ROW][C]43[/C][C]6.8[/C][C]7.0149525392134[/C][C]-0.214952539213402[/C][/ROW]
[ROW][C]44[/C][C]6.4[/C][C]7.46610762275011[/C][C]-1.06610762275011[/C][/ROW]
[ROW][C]45[/C][C]6.1[/C][C]6.71032783098891[/C][C]-0.610327830988909[/C][/ROW]
[ROW][C]46[/C][C]5.8[/C][C]6.83422824100759[/C][C]-1.03422824100759[/C][/ROW]
[ROW][C]47[/C][C]6.1[/C][C]6.74316004627529[/C][C]-0.643160046275289[/C][/ROW]
[ROW][C]48[/C][C]7.2[/C][C]6.87648802442943[/C][C]0.323511975570572[/C][/ROW]
[ROW][C]49[/C][C]7.3[/C][C]7.18199474293096[/C][C]0.118005257069043[/C][/ROW]
[ROW][C]50[/C][C]6.9[/C][C]7.02656688046504[/C][C]-0.126566880465042[/C][/ROW]
[ROW][C]51[/C][C]6.1[/C][C]6.87067976028419[/C][C]-0.770679760284192[/C][/ROW]
[ROW][C]52[/C][C]5.8[/C][C]7.2118085584757[/C][C]-1.41180855847570[/C][/ROW]
[ROW][C]53[/C][C]6.2[/C][C]7.31837543894074[/C][C]-1.11837543894074[/C][/ROW]
[ROW][C]54[/C][C]7.1[/C][C]7.8168217011483[/C][C]-0.716821701148298[/C][/ROW]
[ROW][C]55[/C][C]7.7[/C][C]7.8972101355964[/C][C]-0.197210135596408[/C][/ROW]
[ROW][C]56[/C][C]7.9[/C][C]7.76769567865655[/C][C]0.132304321343455[/C][/ROW]
[ROW][C]57[/C][C]7.7[/C][C]7.75463274099328[/C][C]-0.0546327409932838[/C][/ROW]
[ROW][C]58[/C][C]7.4[/C][C]7.61295560924361[/C][C]-0.212955609243612[/C][/ROW]
[ROW][C]59[/C][C]7.5[/C][C]7.33733352955364[/C][C]0.16266647044636[/C][/ROW]
[ROW][C]60[/C][C]8[/C][C]7.4796641362423[/C][C]0.5203358637577[/C][/ROW]
[/TABLE]
Source: https://freestatistics.org/blog/index.php?pk=57524&T=4

Globally Unique Identifier (entire table): ba.freestatistics.org/blog/index.php?pk=57524&T=4

As an alternative you can also use a QR Code:  

The GUIDs for individual cells are displayed in the table below:

Multiple Linear Regression - Actuals, Interpolation, and Residuals
Time or IndexActualsInterpolationForecastResidualsPrediction Error
187.317034170948770.682965829051226
28.17.148102365681070.951897634318932
37.77.113750730716250.586249269283754
47.57.009249416448990.490750583551015
57.66.989779497430740.610220502569260
67.87.654774387526930.145225612473070
77.87.775674650380380.0243253496196196
87.87.695674650380380.104325349619619
97.57.363018399741640.136981600258357
107.57.329372810406220.170627189593784
117.16.833186331620490.266813668379506
127.57.55618647878572-0.056186478785724
137.57.366548627888630.133451372111374
147.67.188614194086410.411385805913589
157.77.31180855847570.388191441524305
167.76.788685017353230.911314982646767
177.96.958270297559920.941729702440082
188.17.456716559767480.643283440232521
198.27.559611565551890.640388434448109
208.27.209532709516280.990467290483723
218.27.457545999354110.742454000645891
227.96.798217726869511.10178227313049
237.36.801677131749670.498322868250328
246.97.35362733675901-0.453627336759013
256.67.15048554306014-0.550485543060135
266.77.11659316581025-0.416593165810247
276.96.834669246146110.06533075385389
2876.604131132395560.395868867604437
297.16.97177424036170.128225759638300
307.27.141624561059260.058375438940738
317.17.35255110925792-0.252551109257919
326.97.06098933869669-0.160989338696688
3377.21447502892206-0.214475028922055
346.86.82522561247307-0.0252256124730709
356.46.6846429608009-0.284642960800905
366.77.03403402378354-0.334034023783536
376.66.9839369151715-0.383936915171506
386.47.22012339395723-0.820123393957232
396.36.56909170437776-0.269091704377756
406.26.58612587532652-0.386125875326523
416.57.0618005257069-0.561800525706904
426.86.93006279049803-0.130062790498031
436.87.0149525392134-0.214952539213402
446.47.46610762275011-1.06610762275011
456.16.71032783098891-0.610327830988909
465.86.83422824100759-1.03422824100759
476.16.74316004627529-0.643160046275289
487.26.876488024429430.323511975570572
497.37.181994742930960.118005257069043
506.97.02656688046504-0.126566880465042
516.16.87067976028419-0.770679760284192
525.87.2118085584757-1.41180855847570
536.27.31837543894074-1.11837543894074
547.17.8168217011483-0.716821701148298
557.77.8972101355964-0.197210135596408
567.97.767695678656550.132304321343455
577.77.75463274099328-0.0546327409932838
587.47.61295560924361-0.212955609243612
597.57.337333529553640.16266647044636
6087.47966413624230.5203358637577


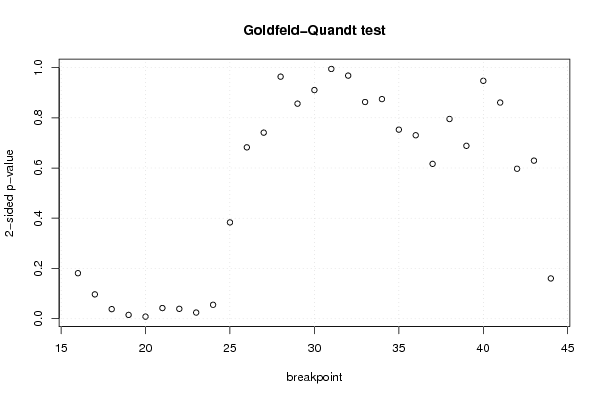
Goldfeld-Quandt test for Heteroskedasticity
p-valuesAlternative Hypothesis
breakpoint indexgreater2-sidedless
160.09062145514259920.1812429102851980.9093785448574
170.04845061931943290.09690123863886570.951549380680567
180.01906350110328570.03812700220657140.980936498896714
190.00757251682772390.01514503365544780.992427483172276
200.004101843450565140.008203686901130290.995898156549435
210.02121029505775780.04242059011551550.978789704942242
220.01965111280216430.03930222560432860.980348887197836
230.01223733024593020.02447466049186040.98776266975407
240.02769487726311280.05538975452622560.972305122736887
250.1916912932701530.3833825865403070.808308706729847
260.3411342946636630.6822685893273260.658865705336337
270.370354927433410.740709854866820.62964507256659
280.481795751576850.96359150315370.51820424842315
290.5719410103407240.8561179793185520.428058989659276
300.54488719376290.91022561247420.4551128062371
310.5028399997771180.9943200004457650.497160000222882
320.4838949450675730.9677898901351460.516105054932427
330.4313441181002590.8626882362005170.568655881899741
340.4371760359312480.8743520718624960.562823964068752
350.3763684451772270.7527368903544540.623631554822773
360.3651787177096970.7303574354193930.634821282290303
370.3082196594082140.6164393188164270.691780340591786
380.3975257207989970.7950514415979940.602474279201003
390.3441450986816080.6882901973632150.655854901318392
400.5264674169660960.9470651660678070.473532583033904
410.5697211441178840.8605577117642310.430278855882116
420.7015179955912290.5969640088175430.298482004408771
430.6853797258151470.6292405483697070.314620274184853
440.9198135421093930.1603729157812130.0801864578906065

\begin{tabular}{lllllllll}
\hline
Goldfeld-Quandt test for Heteroskedasticity \tabularnewline
p-values & Alternative Hypothesis \tabularnewline
breakpoint index & greater & 2-sided & less \tabularnewline
16 & 0.0906214551425992 & 0.181242910285198 & 0.9093785448574 \tabularnewline
17 & 0.0484506193194329 & 0.0969012386388657 & 0.951549380680567 \tabularnewline
18 & 0.0190635011032857 & 0.0381270022065714 & 0.980936498896714 \tabularnewline
19 & 0.0075725168277239 & 0.0151450336554478 & 0.992427483172276 \tabularnewline
20 & 0.00410184345056514 & 0.00820368690113029 & 0.995898156549435 \tabularnewline
21 & 0.0212102950577578 & 0.0424205901155155 & 0.978789704942242 \tabularnewline
22 & 0.0196511128021643 & 0.0393022256043286 & 0.980348887197836 \tabularnewline
23 & 0.0122373302459302 & 0.0244746604918604 & 0.98776266975407 \tabularnewline
24 & 0.0276948772631128 & 0.0553897545262256 & 0.972305122736887 \tabularnewline
25 & 0.191691293270153 & 0.383382586540307 & 0.808308706729847 \tabularnewline
26 & 0.341134294663663 & 0.682268589327326 & 0.658865705336337 \tabularnewline
27 & 0.37035492743341 & 0.74070985486682 & 0.62964507256659 \tabularnewline
28 & 0.48179575157685 & 0.9635915031537 & 0.51820424842315 \tabularnewline
29 & 0.571941010340724 & 0.856117979318552 & 0.428058989659276 \tabularnewline
30 & 0.5448871937629 & 0.9102256124742 & 0.4551128062371 \tabularnewline
31 & 0.502839999777118 & 0.994320000445765 & 0.497160000222882 \tabularnewline
32 & 0.483894945067573 & 0.967789890135146 & 0.516105054932427 \tabularnewline
33 & 0.431344118100259 & 0.862688236200517 & 0.568655881899741 \tabularnewline
34 & 0.437176035931248 & 0.874352071862496 & 0.562823964068752 \tabularnewline
35 & 0.376368445177227 & 0.752736890354454 & 0.623631554822773 \tabularnewline
36 & 0.365178717709697 & 0.730357435419393 & 0.634821282290303 \tabularnewline
37 & 0.308219659408214 & 0.616439318816427 & 0.691780340591786 \tabularnewline
38 & 0.397525720798997 & 0.795051441597994 & 0.602474279201003 \tabularnewline
39 & 0.344145098681608 & 0.688290197363215 & 0.655854901318392 \tabularnewline
40 & 0.526467416966096 & 0.947065166067807 & 0.473532583033904 \tabularnewline
41 & 0.569721144117884 & 0.860557711764231 & 0.430278855882116 \tabularnewline
42 & 0.701517995591229 & 0.596964008817543 & 0.298482004408771 \tabularnewline
43 & 0.685379725815147 & 0.629240548369707 & 0.314620274184853 \tabularnewline
44 & 0.919813542109393 & 0.160372915781213 & 0.0801864578906065 \tabularnewline
\hline
\end{tabular}
%Source: https://freestatistics.org/blog/index.php?pk=57524&T=5

[TABLE]
[ROW][C]Goldfeld-Quandt test for Heteroskedasticity[/C][/ROW]
[ROW][C]p-values[/C][C]Alternative Hypothesis[/C][/ROW]
[ROW][C]breakpoint index[/C][C]greater[/C][C]2-sided[/C][C]less[/C][/ROW]
[ROW][C]16[/C][C]0.0906214551425992[/C][C]0.181242910285198[/C][C]0.9093785448574[/C][/ROW]
[ROW][C]17[/C][C]0.0484506193194329[/C][C]0.0969012386388657[/C][C]0.951549380680567[/C][/ROW]
[ROW][C]18[/C][C]0.0190635011032857[/C][C]0.0381270022065714[/C][C]0.980936498896714[/C][/ROW]
[ROW][C]19[/C][C]0.0075725168277239[/C][C]0.0151450336554478[/C][C]0.992427483172276[/C][/ROW]
[ROW][C]20[/C][C]0.00410184345056514[/C][C]0.00820368690113029[/C][C]0.995898156549435[/C][/ROW]
[ROW][C]21[/C][C]0.0212102950577578[/C][C]0.0424205901155155[/C][C]0.978789704942242[/C][/ROW]
[ROW][C]22[/C][C]0.0196511128021643[/C][C]0.0393022256043286[/C][C]0.980348887197836[/C][/ROW]
[ROW][C]23[/C][C]0.0122373302459302[/C][C]0.0244746604918604[/C][C]0.98776266975407[/C][/ROW]
[ROW][C]24[/C][C]0.0276948772631128[/C][C]0.0553897545262256[/C][C]0.972305122736887[/C][/ROW]
[ROW][C]25[/C][C]0.191691293270153[/C][C]0.383382586540307[/C][C]0.808308706729847[/C][/ROW]
[ROW][C]26[/C][C]0.341134294663663[/C][C]0.682268589327326[/C][C]0.658865705336337[/C][/ROW]
[ROW][C]27[/C][C]0.37035492743341[/C][C]0.74070985486682[/C][C]0.62964507256659[/C][/ROW]
[ROW][C]28[/C][C]0.48179575157685[/C][C]0.9635915031537[/C][C]0.51820424842315[/C][/ROW]
[ROW][C]29[/C][C]0.571941010340724[/C][C]0.856117979318552[/C][C]0.428058989659276[/C][/ROW]
[ROW][C]30[/C][C]0.5448871937629[/C][C]0.9102256124742[/C][C]0.4551128062371[/C][/ROW]
[ROW][C]31[/C][C]0.502839999777118[/C][C]0.994320000445765[/C][C]0.497160000222882[/C][/ROW]
[ROW][C]32[/C][C]0.483894945067573[/C][C]0.967789890135146[/C][C]0.516105054932427[/C][/ROW]
[ROW][C]33[/C][C]0.431344118100259[/C][C]0.862688236200517[/C][C]0.568655881899741[/C][/ROW]
[ROW][C]34[/C][C]0.437176035931248[/C][C]0.874352071862496[/C][C]0.562823964068752[/C][/ROW]
[ROW][C]35[/C][C]0.376368445177227[/C][C]0.752736890354454[/C][C]0.623631554822773[/C][/ROW]
[ROW][C]36[/C][C]0.365178717709697[/C][C]0.730357435419393[/C][C]0.634821282290303[/C][/ROW]
[ROW][C]37[/C][C]0.308219659408214[/C][C]0.616439318816427[/C][C]0.691780340591786[/C][/ROW]
[ROW][C]38[/C][C]0.397525720798997[/C][C]0.795051441597994[/C][C]0.602474279201003[/C][/ROW]
[ROW][C]39[/C][C]0.344145098681608[/C][C]0.688290197363215[/C][C]0.655854901318392[/C][/ROW]
[ROW][C]40[/C][C]0.526467416966096[/C][C]0.947065166067807[/C][C]0.473532583033904[/C][/ROW]
[ROW][C]41[/C][C]0.569721144117884[/C][C]0.860557711764231[/C][C]0.430278855882116[/C][/ROW]
[ROW][C]42[/C][C]0.701517995591229[/C][C]0.596964008817543[/C][C]0.298482004408771[/C][/ROW]
[ROW][C]43[/C][C]0.685379725815147[/C][C]0.629240548369707[/C][C]0.314620274184853[/C][/ROW]
[ROW][C]44[/C][C]0.919813542109393[/C][C]0.160372915781213[/C][C]0.0801864578906065[/C][/ROW]
[/TABLE]
Source: https://freestatistics.org/blog/index.php?pk=57524&T=5

Globally Unique Identifier (entire table): ba.freestatistics.org/blog/index.php?pk=57524&T=5

As an alternative you can also use a QR Code:  

The GUIDs for individual cells are displayed in the table below:

Goldfeld-Quandt test for Heteroskedasticity
p-valuesAlternative Hypothesis
breakpoint indexgreater2-sidedless
160.09062145514259920.1812429102851980.9093785448574
170.04845061931943290.09690123863886570.951549380680567
180.01906350110328570.03812700220657140.980936498896714
190.00757251682772390.01514503365544780.992427483172276
200.004101843450565140.008203686901130290.995898156549435
210.02121029505775780.04242059011551550.978789704942242
220.01965111280216430.03930222560432860.980348887197836
230.01223733024593020.02447466049186040.98776266975407
240.02769487726311280.05538975452622560.972305122736887
250.1916912932701530.3833825865403070.808308706729847
260.3411342946636630.6822685893273260.658865705336337
270.370354927433410.740709854866820.62964507256659
280.481795751576850.96359150315370.51820424842315
290.5719410103407240.8561179793185520.428058989659276
300.54488719376290.91022561247420.4551128062371
310.5028399997771180.9943200004457650.497160000222882
320.4838949450675730.9677898901351460.516105054932427
330.4313441181002590.8626882362005170.568655881899741
340.4371760359312480.8743520718624960.562823964068752
350.3763684451772270.7527368903544540.623631554822773
360.3651787177096970.7303574354193930.634821282290303
370.3082196594082140.6164393188164270.691780340591786
380.3975257207989970.7950514415979940.602474279201003
390.3441450986816080.6882901973632150.655854901318392
400.5264674169660960.9470651660678070.473532583033904
410.5697211441178840.8605577117642310.430278855882116
420.7015179955912290.5969640088175430.298482004408771
430.6853797258151470.6292405483697070.314620274184853
440.9198135421093930.1603729157812130.0801864578906065


Meta Analysis of Goldfeld-Quandt test for Heteroskedasticity
Description# significant tests% significant testsOK/NOK
1% type I error level10.0344827586206897NOK
5% type I error level60.206896551724138NOK
10% type I error level80.275862068965517NOK

\begin{tabular}{lllllllll}
\hline
Meta Analysis of Goldfeld-Quandt test for Heteroskedasticity \tabularnewline
Description & # significant tests & % significant tests & OK/NOK \tabularnewline
1% type I error level & 1 & 0.0344827586206897 & NOK \tabularnewline
5% type I error level & 6 & 0.206896551724138 & NOK \tabularnewline
10% type I error level & 8 & 0.275862068965517 & NOK \tabularnewline
\hline
\end{tabular}
%Source: https://freestatistics.org/blog/index.php?pk=57524&T=6

[TABLE]
[ROW][C]Meta Analysis of Goldfeld-Quandt test for Heteroskedasticity[/C][/ROW]
[ROW][C]Description[/C][C]# significant tests[/C][C]% significant tests[/C][C]OK/NOK[/C][/ROW]
[ROW][C]1% type I error level[/C][C]1[/C][C]0.0344827586206897[/C][C]NOK[/C][/ROW]
[ROW][C]5% type I error level[/C][C]6[/C][C]0.206896551724138[/C][C]NOK[/C][/ROW]
[ROW][C]10% type I error level[/C][C]8[/C][C]0.275862068965517[/C][C]NOK[/C][/ROW]
[/TABLE]
Source: https://freestatistics.org/blog/index.php?pk=57524&T=6

Globally Unique Identifier (entire table): ba.freestatistics.org/blog/index.php?pk=57524&T=6

As an alternative you can also use a QR Code:  

The GUIDs for individual cells are displayed in the table below:

Meta Analysis of Goldfeld-Quandt test for Heteroskedasticity
Description# significant tests% significant testsOK/NOK
1% type I error level10.0344827586206897NOK
5% type I error level60.206896551724138NOK
10% type I error level80.275862068965517NOK


Parameters (Session):
par1 = 1 ; par2 = Include Monthly Dummies ; par3 = No Linear Trend ;
Parameters (R input):
par1 = 1 ; par2 = Include Monthly Dummies ; par3 = No Linear Trend ;
R code (references can be found in the software module):
library(lattice)
library(lmtest)
n25 <- 25 #minimum number of obs. for Goldfeld-Quandt test
par1 <- as.numeric(par1)
x <- t(y)
k <- length(x[1,])
n <- length(x[,1])
x1 <- cbind(x[,par1], x[,1:k!=par1])
mycolnames <- c(colnames(x)[par1], colnames(x)[1:k!=par1])
colnames(x1) <- mycolnames #colnames(x)[par1]
x <- x1
if (par3 == 'First Differences'){
x2 <- array(0, dim=c(n-1,k), dimnames=list(1:(n-1), paste('(1-B)',colnames(x),sep='')))
for (i in 1:n-1) {
for (j in 1:k) {
x2[i,j] <- x[i+1,j] - x[i,j]
}
}
x <- x2
}
if (par2 == 'Include Monthly Dummies'){
x2 <- array(0, dim=c(n,11), dimnames=list(1:n, paste('M', seq(1:11), sep ='')))
for (i in 1:11){
x2[seq(i,n,12),i] <- 1
}
x <- cbind(x, x2)
}
if (par2 == 'Include Quarterly Dummies'){
x2 <- array(0, dim=c(n,3), dimnames=list(1:n, paste('Q', seq(1:3), sep ='')))
for (i in 1:3){
x2[seq(i,n,4),i] <- 1
}
x <- cbind(x, x2)
}
k <- length(x[1,])
if (par3 == 'Linear Trend'){
x <- cbind(x, c(1:n))
colnames(x)[k+1] <- 't'
}
x
k <- length(x[1,])
df <- as.data.frame(x)
(mylm <- lm(df))
(mysum <- summary(mylm))
if (n > n25) {
kp3 <- k + 3
nmkm3 <- n - k - 3
gqarr <- array(NA, dim=c(nmkm3-kp3+1,3))
numgqtests <- 0
numsignificant1 <- 0
numsignificant5 <- 0
numsignificant10 <- 0
for (mypoint in kp3:nmkm3) {
j <- 0
numgqtests <- numgqtests + 1
for (myalt in c('greater', 'two.sided', 'less')) {
j <- j + 1
gqarr[mypoint-kp3+1,j] <- gqtest(mylm, point=mypoint, alternative=myalt)$p.value
}
if (gqarr[mypoint-kp3+1,2] < 0.01) numsignificant1 <- numsignificant1 + 1
if (gqarr[mypoint-kp3+1,2] < 0.05) numsignificant5 <- numsignificant5 + 1
if (gqarr[mypoint-kp3+1,2] < 0.10) numsignificant10 <- numsignificant10 + 1
}
gqarr
}
bitmap(file='test0.png')
plot(x[,1], type='l', main='Actuals and Interpolation', ylab='value of Actuals and Interpolation (dots)', xlab='time or index')
points(x[,1]-mysum$resid)
grid()
dev.off()
bitmap(file='test1.png')
plot(mysum$resid, type='b', pch=19, main='Residuals', ylab='value of Residuals', xlab='time or index')
grid()
dev.off()
bitmap(file='test2.png')
hist(mysum$resid, main='Residual Histogram', xlab='values of Residuals')
grid()
dev.off()
bitmap(file='test3.png')
densityplot(~mysum$resid,col='black',main='Residual Density Plot', xlab='values of Residuals')
dev.off()
bitmap(file='test4.png')
qqnorm(mysum$resid, main='Residual Normal Q-Q Plot')
qqline(mysum$resid)
grid()
dev.off()
(myerror <- as.ts(mysum$resid))
bitmap(file='test5.png')
dum <- cbind(lag(myerror,k=1),myerror)
dum
dum1 <- dum[2:length(myerror),]
dum1
z <- as.data.frame(dum1)
z
plot(z,main=paste('Residual Lag plot, lowess, and regression line'), ylab='values of Residuals', xlab='lagged values of Residuals')
lines(lowess(z))
abline(lm(z))
grid()
dev.off()
bitmap(file='test6.png')
acf(mysum$resid, lag.max=length(mysum$resid)/2, main='Residual Autocorrelation Function')
grid()
dev.off()
bitmap(file='test7.png')
pacf(mysum$resid, lag.max=length(mysum$resid)/2, main='Residual Partial Autocorrelation Function')
grid()
dev.off()
bitmap(file='test8.png')
opar <- par(mfrow = c(2,2), oma = c(0, 0, 1.1, 0))
plot(mylm, las = 1, sub='Residual Diagnostics')
par(opar)
dev.off()
if (n > n25) {
bitmap(file='test9.png')
plot(kp3:nmkm3,gqarr[,2], main='Goldfeld-Quandt test',ylab='2-sided p-value',xlab='breakpoint')
grid()
dev.off()
}
load(file='createtable')
a<-table.start()
a<-table.row.start(a)
a<-table.element(a, 'Multiple Linear Regression - Estimated Regression Equation', 1, TRUE)
a<-table.row.end(a)
myeq <- colnames(x)[1]
myeq <- paste(myeq, '[t] = ', sep='')
for (i in 1:k){
if (mysum$coefficients[i,1] > 0) myeq <- paste(myeq, '+', '')
myeq <- paste(myeq, mysum$coefficients[i,1], sep=' ')
if (rownames(mysum$coefficients)[i] != '(Intercept)') {
myeq <- paste(myeq, rownames(mysum$coefficients)[i], sep='')
if (rownames(mysum$coefficients)[i] != 't') myeq <- paste(myeq, '[t]', sep='')
}
}
myeq <- paste(myeq, ' + e[t]')
a<-table.row.start(a)
a<-table.element(a, myeq)
a<-table.row.end(a)
a<-table.end(a)
table.save(a,file='mytable1.tab')
a<-table.start()
a<-table.row.start(a)
a<-table.element(a,hyperlink('ols1.htm','Multiple Linear Regression - Ordinary Least Squares',''), 6, TRUE)
a<-table.row.end(a)
a<-table.row.start(a)
a<-table.element(a,'Variable',header=TRUE)
a<-table.element(a,'Parameter',header=TRUE)
a<-table.element(a,'S.D.',header=TRUE)
a<-table.element(a,'T-STAT
H0: parameter = 0',header=TRUE)
a<-table.element(a,'2-tail p-value',header=TRUE)
a<-table.element(a,'1-tail p-value',header=TRUE)
a<-table.row.end(a)
for (i in 1:k){
a<-table.row.start(a)
a<-table.element(a,rownames(mysum$coefficients)[i],header=TRUE)
a<-table.element(a,mysum$coefficients[i,1])
a<-table.element(a, round(mysum$coefficients[i,2],6))
a<-table.element(a, round(mysum$coefficients[i,3],4))
a<-table.element(a, round(mysum$coefficients[i,4],6))
a<-table.element(a, round(mysum$coefficients[i,4]/2,6))
a<-table.row.end(a)
}
a<-table.end(a)
table.save(a,file='mytable2.tab')
a<-table.start()
a<-table.row.start(a)
a<-table.element(a, 'Multiple Linear Regression - Regression Statistics', 2, TRUE)
a<-table.row.end(a)
a<-table.row.start(a)
a<-table.element(a, 'Multiple R',1,TRUE)
a<-table.element(a, sqrt(mysum$r.squared))
a<-table.row.end(a)
a<-table.row.start(a)
a<-table.element(a, 'R-squared',1,TRUE)
a<-table.element(a, mysum$r.squared)
a<-table.row.end(a)
a<-table.row.start(a)
a<-table.element(a, 'Adjusted R-squared',1,TRUE)
a<-table.element(a, mysum$adj.r.squared)
a<-table.row.end(a)
a<-table.row.start(a)
a<-table.element(a, 'F-TEST (value)',1,TRUE)
a<-table.element(a, mysum$fstatistic[1])
a<-table.row.end(a)
a<-table.row.start(a)
a<-table.element(a, 'F-TEST (DF numerator)',1,TRUE)
a<-table.element(a, mysum$fstatistic[2])
a<-table.row.end(a)
a<-table.row.start(a)
a<-table.element(a, 'F-TEST (DF denominator)',1,TRUE)
a<-table.element(a, mysum$fstatistic[3])
a<-table.row.end(a)
a<-table.row.start(a)
a<-table.element(a, 'p-value',1,TRUE)
a<-table.element(a, 1-pf(mysum$fstatistic[1],mysum$fstatistic[2],mysum$fstatistic[3]))
a<-table.row.end(a)
a<-table.row.start(a)
a<-table.element(a, 'Multiple Linear Regression - Residual Statistics', 2, TRUE)
a<-table.row.end(a)
a<-table.row.start(a)
a<-table.element(a, 'Residual Standard Deviation',1,TRUE)
a<-table.element(a, mysum$sigma)
a<-table.row.end(a)
a<-table.row.start(a)
a<-table.element(a, 'Sum Squared Residuals',1,TRUE)
a<-table.element(a, sum(myerror*myerror))
a<-table.row.end(a)
a<-table.end(a)
table.save(a,file='mytable3.tab')
a<-table.start()
a<-table.row.start(a)
a<-table.element(a, 'Multiple Linear Regression - Actuals, Interpolation, and Residuals', 4, TRUE)
a<-table.row.end(a)
a<-table.row.start(a)
a<-table.element(a, 'Time or Index', 1, TRUE)
a<-table.element(a, 'Actuals', 1, TRUE)
a<-table.element(a, 'Interpolation
Forecast', 1, TRUE)
a<-table.element(a, 'Residuals
Prediction Error', 1, TRUE)
a<-table.row.end(a)
for (i in 1:n) {
a<-table.row.start(a)
a<-table.element(a,i, 1, TRUE)
a<-table.element(a,x[i])
a<-table.element(a,x[i]-mysum$resid[i])
a<-table.element(a,mysum$resid[i])
a<-table.row.end(a)
}
a<-table.end(a)
table.save(a,file='mytable4.tab')
if (n > n25) {
a<-table.start()
a<-table.row.start(a)
a<-table.element(a,'Goldfeld-Quandt test for Heteroskedasticity',4,TRUE)
a<-table.row.end(a)
a<-table.row.start(a)
a<-table.element(a,'p-values',header=TRUE)
a<-table.element(a,'Alternative Hypothesis',3,header=TRUE)
a<-table.row.end(a)
a<-table.row.start(a)
a<-table.element(a,'breakpoint index',header=TRUE)
a<-table.element(a,'greater',header=TRUE)
a<-table.element(a,'2-sided',header=TRUE)
a<-table.element(a,'less',header=TRUE)
a<-table.row.end(a)
for (mypoint in kp3:nmkm3) {
a<-table.row.start(a)
a<-table.element(a,mypoint,header=TRUE)
a<-table.element(a,gqarr[mypoint-kp3+1,1])
a<-table.element(a,gqarr[mypoint-kp3+1,2])
a<-table.element(a,gqarr[mypoint-kp3+1,3])
a<-table.row.end(a)
}
a<-table.end(a)
table.save(a,file='mytable5.tab')
a<-table.start()
a<-table.row.start(a)
a<-table.element(a,'Meta Analysis of Goldfeld-Quandt test for Heteroskedasticity',4,TRUE)
a<-table.row.end(a)
a<-table.row.start(a)
a<-table.element(a,'Description',header=TRUE)
a<-table.element(a,'# significant tests',header=TRUE)
a<-table.element(a,'% significant tests',header=TRUE)
a<-table.element(a,'OK/NOK',header=TRUE)
a<-table.row.end(a)
a<-table.row.start(a)
a<-table.element(a,'1% type I error level',header=TRUE)
a<-table.element(a,numsignificant1)
a<-table.element(a,numsignificant1/numgqtests)
if (numsignificant1/numgqtests < 0.01) dum <- 'OK' else dum <- 'NOK'
a<-table.element(a,dum)
a<-table.row.end(a)
a<-table.row.start(a)
a<-table.element(a,'5% type I error level',header=TRUE)
a<-table.element(a,numsignificant5)
a<-table.element(a,numsignificant5/numgqtests)
if (numsignificant5/numgqtests < 0.05) dum <- 'OK' else dum <- 'NOK'
a<-table.element(a,dum)
a<-table.row.end(a)
a<-table.row.start(a)
a<-table.element(a,'10% type I error level',header=TRUE)
a<-table.element(a,numsignificant10)
a<-table.element(a,numsignificant10/numgqtests)
if (numsignificant10/numgqtests < 0.1) dum <- 'OK' else dum <- 'NOK'
a<-table.element(a,dum)
a<-table.row.end(a)
a<-table.end(a)
table.save(a,file='mytable6.tab')
}