Free Statistics

of Irreproducible Research!

Author's title

Author*The author of this computation has been verified*
R Software Modulerwasp_multipleregression.wasp
Title produced by softwareMultiple Regression
Date of computationWed, 18 Nov 2009 14:32:41 -0700
Cite this page as followsStatistical Computations at FreeStatistics.org, Office for Research Development and Education, URL https://freestatistics.org/blog/index.php?v=date/2009/Nov/18/t1258580070r581tvdbx7dp0to.htm/, Retrieved Mon, 29 Apr 2024 16:11:38 +0000
Statistical Computations at FreeStatistics.org, Office for Research Development and Education, URL https://freestatistics.org/blog/index.php?pk=57627, Retrieved Mon, 29 Apr 2024 16:11:38 +0000
QR Codes:

Original text written by user:
IsPrivate?No (this computation is public)
User-defined keywordsW7
Estimated Impact241
Family? (F = Feedback message, R = changed R code, M = changed R Module, P = changed Parameters, D = changed Data)
-     [Multiple Regression] [Q1 The Seatbeltlaw] [2007-11-14 19:27:43] [8cd6641b921d30ebe00b648d1481bba0]
- RMPD  [Multiple Regression] [Seatbelt] [2009-11-12 13:54:52] [b98453cac15ba1066b407e146608df68]
-   PD      [Multiple Regression] [W7] [2009-11-18 21:32:41] [950726a732ba3ca782ecb1a5307d0f6f] [Current]
-    D        [Multiple Regression] [WS 7: Multiple Re...] [2009-11-20 10:53:05] [f924a0adda9c1905a1ba8f1c751261ff]
- RMPD        [(Partial) Autocorrelation Function] [] [2009-11-27 13:34:22] [5482608004c1d7bbf873930172393a2d]
-   P           [(Partial) Autocorrelation Function] [workshop 8] [2009-11-28 12:11:27] [eaf42bcf5162b5692bb3c7f9d4636222]
-   P           [(Partial) Autocorrelation Function] [] [2009-12-02 14:48:19] [5482608004c1d7bbf873930172393a2d]
-   P           [(Partial) Autocorrelation Function] [] [2009-12-02 14:58:25] [5482608004c1d7bbf873930172393a2d]
-   P           [(Partial) Autocorrelation Function] [ws8: acf verbetering] [2009-12-04 19:00:06] [bd8e774728cf1f2f4e6868fd314defe3]
- RMP           [ARIMA Forecasting] [ARIMA Forecast] [2009-12-11 12:59:37] [5482608004c1d7bbf873930172393a2d]
Feedback Forum

Post a new message
Dataseries X:
16224.2	14931.4	17318.8	16913	17665.9	13132.1
15469.6	13333.7	16224.2	17318.8	16913	17665.9
16557.5	14711.2	15469.6	16224.2	17318.8	16913
19414.8	17197.3	16557.5	15469.6	16224.2	17318.8
17335	14985.2	19414.8	16557.5	15469.6	16224.2
16525.2	14734.4	17335	19414.8	16557.5	15469.6
18160.4	15937.8	16525.2	17335	19414.8	16557.5
15553.8	13028.1	18160.4	16525.2	17335	19414.8
15262.2	13836.8	15553.8	18160.4	16525.2	17335
18581	16677.5	15262.2	15553.8	18160.4	16525.2
17564.1	15130	18581	15262.2	15553.8	18160.4
18948.6	17504	17564.1	18581	15262.2	15553.8
17187.8	16979.9	18948.6	17564.1	18581	15262.2
17564.8	16012.5	17187.8	18948.6	17564.1	18581
17668.4	16247.7	17564.8	17187.8	18948.6	17564.1
20811.7	19268.2	17668.4	17564.8	17187.8	18948.6
17257.8	15533	20811.7	17668.4	17564.8	17187.8
18984.2	16803.3	17257.8	20811.7	17668.4	17564.8
20532.6	17396.1	18984.2	17257.8	20811.7	17668.4
17082.3	15155.4	20532.6	18984.2	17257.8	20811.7
16894.9	15692.4	17082.3	20532.6	18984.2	17257.8
20274.9	18063.7	16894.9	17082.3	20532.6	18984.2
20078.6	17568.6	20274.9	16894.9	17082.3	20532.6
19900.9	18154.3	20078.6	20274.9	16894.9	17082.3
17012.2	15467.4	19900.9	20078.6	20274.9	16894.9
19642.9	16956.1	17012.2	19900.9	20078.6	20274.9
19024	16854	19642.9	17012.2	19900.9	20078.6
21691	19396.4	19024	19642.9	17012.2	19900.9
18835.9	16457.6	21691	19024	19642.9	17012.2
19873.4	17284.5	18835.9	21691	19024	19642.9
21468.2	18395.3	19873.4	18835.9	21691	19024
19406.8	16938.7	21468.2	19873.4	18835.9	21691
18385.3	16414.3	19406.8	21468.2	19873.4	18835.9
20739.3	18173.4	18385.3	19406.8	21468.2	19873.4
22268.3	19919.7	20739.3	18385.3	19406.8	21468.2
21569	19623.8	22268.3	20739.3	18385.3	19406.8
17514.8	17228.1	21569	22268.3	20739.3	18385.3
21124.7	18730.3	17514.8	21569	22268.3	20739.3
21251	19039.1	21124.7	17514.8	21569	22268.3
21393	19413.3	21251	21124.7	17514.8	21569
22145.2	20013.6	21393	21251	21124.7	17514.8
20310.5	17917.2	22145.2	21393	21251	21124.7
23466.9	21270.3	20310.5	22145.2	21393	21251
21264.6	18766.1	23466.9	20310.5	22145.2	21393
18388.1	16790.8	21264.6	23466.9	20310.5	22145.2
22635.4	19960.6	18388.1	21264.6	23466.9	20310.5
22014.3	19586.7	22635.4	18388.1	21264.6	23466.9
18422.7	17179	22014.3	22635.4	18388.1	21264.6
16120.2	14964.9	18422.7	22014.3	22635.4	18388.1
16037.7	13918.5	16120.2	18422.7	22014.3	22635.4
16410.7	14401.3	16037.7	16120.2	18422.7	22014.3
17749.8	15994.6	16410.7	16037.7	16120.2	18422.7
16349.8	14521.1	17749.8	16410.7	16037.7	16120.2
15662.3	13746.5	16349.8	17749.8	16410.7	16037.7
17782.3	15956	15662.3	16349.8	17749.8	16410.7
16398.9	14332.2	17782.3	15662.3	16349.8	17749.8


Summary of computational transaction
Raw Inputview raw input (R code)
Raw Outputview raw output of R engine
Computing time4 seconds
R Server'Gwilym Jenkins' @ 72.249.127.135

\begin{tabular}{lllllllll}
\hline
Summary of computational transaction \tabularnewline
Raw Input & view raw input (R code)  \tabularnewline
Raw Output & view raw output of R engine  \tabularnewline
Computing time & 4 seconds \tabularnewline
R Server & 'Gwilym Jenkins' @ 72.249.127.135 \tabularnewline
\hline
\end{tabular}
%Source: https://freestatistics.org/blog/index.php?pk=57627&T=0

[TABLE]
[ROW][C]Summary of computational transaction[/C][/ROW]
[ROW][C]Raw Input[/C][C]view raw input (R code) [/C][/ROW]
[ROW][C]Raw Output[/C][C]view raw output of R engine [/C][/ROW]
[ROW][C]Computing time[/C][C]4 seconds[/C][/ROW]
[ROW][C]R Server[/C][C]'Gwilym Jenkins' @ 72.249.127.135[/C][/ROW]
[/TABLE]
Source: https://freestatistics.org/blog/index.php?pk=57627&T=0

Globally Unique Identifier (entire table): ba.freestatistics.org/blog/index.php?pk=57627&T=0

As an alternative you can also use a QR Code:  

The GUIDs for individual cells are displayed in the table below:

Summary of computational transaction
Raw Inputview raw input (R code)
Raw Outputview raw output of R engine
Computing time4 seconds
R Server'Gwilym Jenkins' @ 72.249.127.135


Multiple Linear Regression - Estimated Regression Equation
U[t] = + 245.686435485724 + 0.955192505216772I[t] + 0.0222593304802574m1[t] -0.040221227634457m2[t] + 0.146917738867787m3[t] + 0.0103105939618765m4[t] -1215.36363530938M1[t] + 92.2307226034118M2[t] -169.102266848386M3[t] + 356.20737689281M4[t] + 218.124658416461M5[t] + 385.431534181864M6[t] + 413.280276552429M7[t] + 327.775499528374M8[t] -366.035010095673M9[t] + 172.48562872356M10[t] + 503.086478783288M11[t] -6.29157578223689t + e[t]

\begin{tabular}{lllllllll}
\hline
Multiple Linear Regression - Estimated Regression Equation \tabularnewline
U[t] =  +  245.686435485724 +  0.955192505216772I[t] +  0.0222593304802574m1[t] -0.040221227634457m2[t] +  0.146917738867787m3[t] +  0.0103105939618765m4[t] -1215.36363530938M1[t] +  92.2307226034118M2[t] -169.102266848386M3[t] +  356.20737689281M4[t] +  218.124658416461M5[t] +  385.431534181864M6[t] +  413.280276552429M7[t] +  327.775499528374M8[t] -366.035010095673M9[t] +  172.48562872356M10[t] +  503.086478783288M11[t] -6.29157578223689t  + e[t] \tabularnewline
\hline
\end{tabular}
%Source: https://freestatistics.org/blog/index.php?pk=57627&T=1

[TABLE]
[ROW][C]Multiple Linear Regression - Estimated Regression Equation[/C][/ROW]
[ROW][C]U[t] =  +  245.686435485724 +  0.955192505216772I[t] +  0.0222593304802574m1[t] -0.040221227634457m2[t] +  0.146917738867787m3[t] +  0.0103105939618765m4[t] -1215.36363530938M1[t] +  92.2307226034118M2[t] -169.102266848386M3[t] +  356.20737689281M4[t] +  218.124658416461M5[t] +  385.431534181864M6[t] +  413.280276552429M7[t] +  327.775499528374M8[t] -366.035010095673M9[t] +  172.48562872356M10[t] +  503.086478783288M11[t] -6.29157578223689t  + e[t][/C][/ROW]
[/TABLE]
Source: https://freestatistics.org/blog/index.php?pk=57627&T=1

Globally Unique Identifier (entire table): ba.freestatistics.org/blog/index.php?pk=57627&T=1

As an alternative you can also use a QR Code:  

The GUIDs for individual cells are displayed in the table below:

Multiple Linear Regression - Estimated Regression Equation
U[t] = + 245.686435485724 + 0.955192505216772I[t] + 0.0222593304802574m1[t] -0.040221227634457m2[t] + 0.146917738867787m3[t] + 0.0103105939618765m4[t] -1215.36363530938M1[t] + 92.2307226034118M2[t] -169.102266848386M3[t] + 356.20737689281M4[t] + 218.124658416461M5[t] + 385.431534181864M6[t] + 413.280276552429M7[t] + 327.775499528374M8[t] -366.035010095673M9[t] + 172.48562872356M10[t] + 503.086478783288M11[t] -6.29157578223689t + e[t]


Multiple Linear Regression - Ordinary Least Squares
VariableParameterS.D.T-STATH0: parameter = 02-tail p-value1-tail p-value
(Intercept)245.686435485724658.1639830.37330.7110070.355503
I0.9551925052167720.0549817.373500
m10.02225933048025740.0579130.38440.7028530.351427
m2-0.0402212276344570.055617-0.72320.4739970.236998
m30.1469177388677870.0553632.65370.0115590.00578
m40.01031059396187650.0594720.17340.8632820.431641
M1-1215.36363530938356.369728-3.41040.0015510.000775
M292.2307226034118396.814290.23240.8174530.408726
M3-169.102266848386388.479472-0.43530.6658120.332906
M4356.20737689281329.9808141.07950.2871780.143589
M5218.124658416461290.388870.75110.4571910.228596
M6385.431534181864281.9453151.3670.1796450.089822
M7413.280276552429347.2418131.19020.2413580.120679
M8327.775499528374312.0213971.05050.3001280.150064
M9-366.035010095673327.985785-1.1160.2714260.135713
M10172.48562872356421.8217910.40890.6849040.342452
M11503.086478783288376.6612781.33560.189610.094805
t-6.291575782236894.060336-1.54950.1295460.064773

\begin{tabular}{lllllllll}
\hline
Multiple Linear Regression - Ordinary Least Squares \tabularnewline
Variable & Parameter & S.D. & T-STATH0: parameter = 0 & 2-tail p-value & 1-tail p-value \tabularnewline
(Intercept) & 245.686435485724 & 658.163983 & 0.3733 & 0.711007 & 0.355503 \tabularnewline
I & 0.955192505216772 & 0.05498 & 17.3735 & 0 & 0 \tabularnewline
m1 & 0.0222593304802574 & 0.057913 & 0.3844 & 0.702853 & 0.351427 \tabularnewline
m2 & -0.040221227634457 & 0.055617 & -0.7232 & 0.473997 & 0.236998 \tabularnewline
m3 & 0.146917738867787 & 0.055363 & 2.6537 & 0.011559 & 0.00578 \tabularnewline
m4 & 0.0103105939618765 & 0.059472 & 0.1734 & 0.863282 & 0.431641 \tabularnewline
M1 & -1215.36363530938 & 356.369728 & -3.4104 & 0.001551 & 0.000775 \tabularnewline
M2 & 92.2307226034118 & 396.81429 & 0.2324 & 0.817453 & 0.408726 \tabularnewline
M3 & -169.102266848386 & 388.479472 & -0.4353 & 0.665812 & 0.332906 \tabularnewline
M4 & 356.20737689281 & 329.980814 & 1.0795 & 0.287178 & 0.143589 \tabularnewline
M5 & 218.124658416461 & 290.38887 & 0.7511 & 0.457191 & 0.228596 \tabularnewline
M6 & 385.431534181864 & 281.945315 & 1.367 & 0.179645 & 0.089822 \tabularnewline
M7 & 413.280276552429 & 347.241813 & 1.1902 & 0.241358 & 0.120679 \tabularnewline
M8 & 327.775499528374 & 312.021397 & 1.0505 & 0.300128 & 0.150064 \tabularnewline
M9 & -366.035010095673 & 327.985785 & -1.116 & 0.271426 & 0.135713 \tabularnewline
M10 & 172.48562872356 & 421.821791 & 0.4089 & 0.684904 & 0.342452 \tabularnewline
M11 & 503.086478783288 & 376.661278 & 1.3356 & 0.18961 & 0.094805 \tabularnewline
t & -6.29157578223689 & 4.060336 & -1.5495 & 0.129546 & 0.064773 \tabularnewline
\hline
\end{tabular}
%Source: https://freestatistics.org/blog/index.php?pk=57627&T=2

[TABLE]
[ROW][C]Multiple Linear Regression - Ordinary Least Squares[/C][/ROW]
[ROW][C]Variable[/C][C]Parameter[/C][C]S.D.[/C][C]T-STATH0: parameter = 0[/C][C]2-tail p-value[/C][C]1-tail p-value[/C][/ROW]
[ROW][C](Intercept)[/C][C]245.686435485724[/C][C]658.163983[/C][C]0.3733[/C][C]0.711007[/C][C]0.355503[/C][/ROW]
[ROW][C]I[/C][C]0.955192505216772[/C][C]0.05498[/C][C]17.3735[/C][C]0[/C][C]0[/C][/ROW]
[ROW][C]m1[/C][C]0.0222593304802574[/C][C]0.057913[/C][C]0.3844[/C][C]0.702853[/C][C]0.351427[/C][/ROW]
[ROW][C]m2[/C][C]-0.040221227634457[/C][C]0.055617[/C][C]-0.7232[/C][C]0.473997[/C][C]0.236998[/C][/ROW]
[ROW][C]m3[/C][C]0.146917738867787[/C][C]0.055363[/C][C]2.6537[/C][C]0.011559[/C][C]0.00578[/C][/ROW]
[ROW][C]m4[/C][C]0.0103105939618765[/C][C]0.059472[/C][C]0.1734[/C][C]0.863282[/C][C]0.431641[/C][/ROW]
[ROW][C]M1[/C][C]-1215.36363530938[/C][C]356.369728[/C][C]-3.4104[/C][C]0.001551[/C][C]0.000775[/C][/ROW]
[ROW][C]M2[/C][C]92.2307226034118[/C][C]396.81429[/C][C]0.2324[/C][C]0.817453[/C][C]0.408726[/C][/ROW]
[ROW][C]M3[/C][C]-169.102266848386[/C][C]388.479472[/C][C]-0.4353[/C][C]0.665812[/C][C]0.332906[/C][/ROW]
[ROW][C]M4[/C][C]356.20737689281[/C][C]329.980814[/C][C]1.0795[/C][C]0.287178[/C][C]0.143589[/C][/ROW]
[ROW][C]M5[/C][C]218.124658416461[/C][C]290.38887[/C][C]0.7511[/C][C]0.457191[/C][C]0.228596[/C][/ROW]
[ROW][C]M6[/C][C]385.431534181864[/C][C]281.945315[/C][C]1.367[/C][C]0.179645[/C][C]0.089822[/C][/ROW]
[ROW][C]M7[/C][C]413.280276552429[/C][C]347.241813[/C][C]1.1902[/C][C]0.241358[/C][C]0.120679[/C][/ROW]
[ROW][C]M8[/C][C]327.775499528374[/C][C]312.021397[/C][C]1.0505[/C][C]0.300128[/C][C]0.150064[/C][/ROW]
[ROW][C]M9[/C][C]-366.035010095673[/C][C]327.985785[/C][C]-1.116[/C][C]0.271426[/C][C]0.135713[/C][/ROW]
[ROW][C]M10[/C][C]172.48562872356[/C][C]421.821791[/C][C]0.4089[/C][C]0.684904[/C][C]0.342452[/C][/ROW]
[ROW][C]M11[/C][C]503.086478783288[/C][C]376.661278[/C][C]1.3356[/C][C]0.18961[/C][C]0.094805[/C][/ROW]
[ROW][C]t[/C][C]-6.29157578223689[/C][C]4.060336[/C][C]-1.5495[/C][C]0.129546[/C][C]0.064773[/C][/ROW]
[/TABLE]
Source: https://freestatistics.org/blog/index.php?pk=57627&T=2

Globally Unique Identifier (entire table): ba.freestatistics.org/blog/index.php?pk=57627&T=2

As an alternative you can also use a QR Code:  

The GUIDs for individual cells are displayed in the table below:

Multiple Linear Regression - Ordinary Least Squares
VariableParameterS.D.T-STATH0: parameter = 02-tail p-value1-tail p-value
(Intercept)245.686435485724658.1639830.37330.7110070.355503
I0.9551925052167720.0549817.373500
m10.02225933048025740.0579130.38440.7028530.351427
m2-0.0402212276344570.055617-0.72320.4739970.236998
m30.1469177388677870.0553632.65370.0115590.00578
m40.01031059396187650.0594720.17340.8632820.431641
M1-1215.36363530938356.369728-3.41040.0015510.000775
M292.2307226034118396.814290.23240.8174530.408726
M3-169.102266848386388.479472-0.43530.6658120.332906
M4356.20737689281329.9808141.07950.2871780.143589
M5218.124658416461290.388870.75110.4571910.228596
M6385.431534181864281.9453151.3670.1796450.089822
M7413.280276552429347.2418131.19020.2413580.120679
M8327.775499528374312.0213971.05050.3001280.150064
M9-366.035010095673327.985785-1.1160.2714260.135713
M10172.48562872356421.8217910.40890.6849040.342452
M11503.086478783288376.6612781.33560.189610.094805
t-6.291575782236894.060336-1.54950.1295460.064773


Multiple Linear Regression - Regression Statistics
Multiple R0.99064315244172
R-squared0.98137385547967
Adjusted R-squared0.97304110661531
F-TEST (value)117.773122825926
F-TEST (DF numerator)17
F-TEST (DF denominator)38
p-value0
Multiple Linear Regression - Residual Statistics
Residual Standard Deviation355.133026604445
Sum Squared Residuals4792539.73023888

\begin{tabular}{lllllllll}
\hline
Multiple Linear Regression - Regression Statistics \tabularnewline
Multiple R & 0.99064315244172 \tabularnewline
R-squared & 0.98137385547967 \tabularnewline
Adjusted R-squared & 0.97304110661531 \tabularnewline
F-TEST (value) & 117.773122825926 \tabularnewline
F-TEST (DF numerator) & 17 \tabularnewline
F-TEST (DF denominator) & 38 \tabularnewline
p-value & 0 \tabularnewline
Multiple Linear Regression - Residual Statistics \tabularnewline
Residual Standard Deviation & 355.133026604445 \tabularnewline
Sum Squared Residuals & 4792539.73023888 \tabularnewline
\hline
\end{tabular}
%Source: https://freestatistics.org/blog/index.php?pk=57627&T=3

[TABLE]
[ROW][C]Multiple Linear Regression - Regression Statistics[/C][/ROW]
[ROW][C]Multiple R[/C][C]0.99064315244172[/C][/ROW]
[ROW][C]R-squared[/C][C]0.98137385547967[/C][/ROW]
[ROW][C]Adjusted R-squared[/C][C]0.97304110661531[/C][/ROW]
[ROW][C]F-TEST (value)[/C][C]117.773122825926[/C][/ROW]
[ROW][C]F-TEST (DF numerator)[/C][C]17[/C][/ROW]
[ROW][C]F-TEST (DF denominator)[/C][C]38[/C][/ROW]
[ROW][C]p-value[/C][C]0[/C][/ROW]
[ROW][C]Multiple Linear Regression - Residual Statistics[/C][/ROW]
[ROW][C]Residual Standard Deviation[/C][C]355.133026604445[/C][/ROW]
[ROW][C]Sum Squared Residuals[/C][C]4792539.73023888[/C][/ROW]
[/TABLE]
Source: https://freestatistics.org/blog/index.php?pk=57627&T=3

Globally Unique Identifier (entire table): ba.freestatistics.org/blog/index.php?pk=57627&T=3

As an alternative you can also use a QR Code:  

The GUIDs for individual cells are displayed in the table below:

Multiple Linear Regression - Regression Statistics
Multiple R0.99064315244172
R-squared0.98137385547967
Adjusted R-squared0.97304110661531
F-TEST (value)117.773122825926
F-TEST (DF numerator)17
F-TEST (DF denominator)38
p-value0
Multiple Linear Regression - Residual Statistics
Residual Standard Deviation355.133026604445
Sum Squared Residuals4792539.73023888


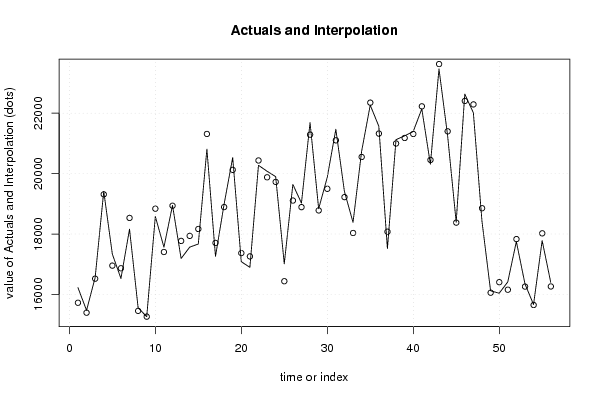
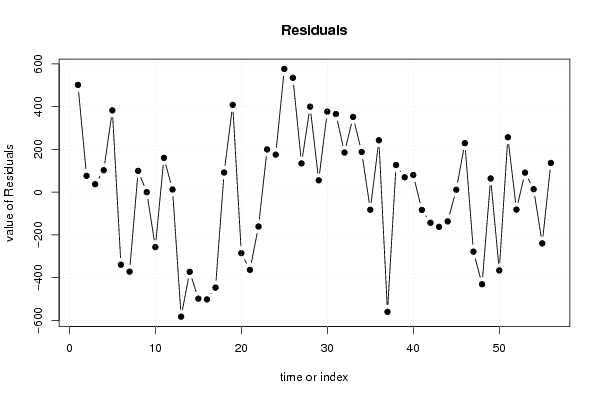
Multiple Linear Regression - Actuals, Interpolation, and Residuals
Time or IndexActualsInterpolationForecastResidualsPrediction Error
116224.215722.4697005589501.730299441139
215469.615393.106385097776.4936149023166
316557.516520.345133026737.1548669733197
419414.819312.0020342725102.797965727460
51733516952.3412087613382.658791238656
616525.216864.626593094-339.426593094002
718160.418532.2938743095-371.893874309476
815553.815454.044443243799.7555567563075
915262.215262.19765629150.00234370853682009
101858118838.0822676880-257.082267687954
1117564.117403.7380212323160.361978767734
1218948.618936.148443737912.4515562621255
1317187.817770.1798726487-582.379872648667
1417564.817937.367057049-372.567057049
1517668.418166.5398407144-498.139840714376
1620811.721313.4417972420-501.741797241979
1717257.817704.2663855185-446.466385518454
1818984.218892.235677131691.9643228683616
1920532.620124.2763959612408.323604038752
2017082.317367.4869544814-285.186954481378
2116894.917258.2392920515-363.339292051508
2220274.920435.4078821629-160.507882162867
2320078.619878.6299914645199.970008535452
2419900.919725.2839046163175.616095383740
2517012.216435.7116472807576.48835271934
2619642.919107.8661515711535.033848428855
271902418889.3298607250134.670139274971
282169121291.0096059605399.990394039488
2918835.918780.486412406555.4135875935025
3019873.419496.7244573484376.67554265163
3121468.221102.6875240813365.512475918725
3219406.819221.3609426103185.439057389692
3318385.318033.3150870397351.984912960312
3420739.320550.9990697454188.300930254611
3522268.322350.4325722104-82.1325722103985
362156921326.4360731576242.563926842426
3717514.818074.6740560229-559.874056022916
3821124.720997.6583072569127.041692743072
392125121181.441369187669.5586308124035
402139321312.665121125480.3348788746184
4122145.222228.3309071250-83.1309071249703
4220310.520453.6886167968-143.188616796834
4323466.923629.1727185054-162.272718505362
4421264.621401.412158723-136.812158722990
4518388.118376.747964617311.3520353826587
4622635.422406.1107804038229.289219596211
4722014.322292.4994150928-278.199415092787
4818422.718853.3315784883-430.631578488291
4916120.216056.164723488964.0352765111041
5016037.716403.7020990252-366.002099025243
5116410.716153.9437963463256.756203653681
5217749.817831.1814413996-81.3814413995873
5316349.816258.275086188791.5249138112657
5415662.315648.324655629213.9753443708437
5517782.318021.9694871426-239.669487142638
5616398.916262.0955009416136.804499058368

\begin{tabular}{lllllllll}
\hline
Multiple Linear Regression - Actuals, Interpolation, and Residuals \tabularnewline
Time or Index & Actuals & InterpolationForecast & ResidualsPrediction Error \tabularnewline
1 & 16224.2 & 15722.4697005589 & 501.730299441139 \tabularnewline
2 & 15469.6 & 15393.1063850977 & 76.4936149023166 \tabularnewline
3 & 16557.5 & 16520.3451330267 & 37.1548669733197 \tabularnewline
4 & 19414.8 & 19312.0020342725 & 102.797965727460 \tabularnewline
5 & 17335 & 16952.3412087613 & 382.658791238656 \tabularnewline
6 & 16525.2 & 16864.626593094 & -339.426593094002 \tabularnewline
7 & 18160.4 & 18532.2938743095 & -371.893874309476 \tabularnewline
8 & 15553.8 & 15454.0444432437 & 99.7555567563075 \tabularnewline
9 & 15262.2 & 15262.1976562915 & 0.00234370853682009 \tabularnewline
10 & 18581 & 18838.0822676880 & -257.082267687954 \tabularnewline
11 & 17564.1 & 17403.7380212323 & 160.361978767734 \tabularnewline
12 & 18948.6 & 18936.1484437379 & 12.4515562621255 \tabularnewline
13 & 17187.8 & 17770.1798726487 & -582.379872648667 \tabularnewline
14 & 17564.8 & 17937.367057049 & -372.567057049 \tabularnewline
15 & 17668.4 & 18166.5398407144 & -498.139840714376 \tabularnewline
16 & 20811.7 & 21313.4417972420 & -501.741797241979 \tabularnewline
17 & 17257.8 & 17704.2663855185 & -446.466385518454 \tabularnewline
18 & 18984.2 & 18892.2356771316 & 91.9643228683616 \tabularnewline
19 & 20532.6 & 20124.2763959612 & 408.323604038752 \tabularnewline
20 & 17082.3 & 17367.4869544814 & -285.186954481378 \tabularnewline
21 & 16894.9 & 17258.2392920515 & -363.339292051508 \tabularnewline
22 & 20274.9 & 20435.4078821629 & -160.507882162867 \tabularnewline
23 & 20078.6 & 19878.6299914645 & 199.970008535452 \tabularnewline
24 & 19900.9 & 19725.2839046163 & 175.616095383740 \tabularnewline
25 & 17012.2 & 16435.7116472807 & 576.48835271934 \tabularnewline
26 & 19642.9 & 19107.8661515711 & 535.033848428855 \tabularnewline
27 & 19024 & 18889.3298607250 & 134.670139274971 \tabularnewline
28 & 21691 & 21291.0096059605 & 399.990394039488 \tabularnewline
29 & 18835.9 & 18780.4864124065 & 55.4135875935025 \tabularnewline
30 & 19873.4 & 19496.7244573484 & 376.67554265163 \tabularnewline
31 & 21468.2 & 21102.6875240813 & 365.512475918725 \tabularnewline
32 & 19406.8 & 19221.3609426103 & 185.439057389692 \tabularnewline
33 & 18385.3 & 18033.3150870397 & 351.984912960312 \tabularnewline
34 & 20739.3 & 20550.9990697454 & 188.300930254611 \tabularnewline
35 & 22268.3 & 22350.4325722104 & -82.1325722103985 \tabularnewline
36 & 21569 & 21326.4360731576 & 242.563926842426 \tabularnewline
37 & 17514.8 & 18074.6740560229 & -559.874056022916 \tabularnewline
38 & 21124.7 & 20997.6583072569 & 127.041692743072 \tabularnewline
39 & 21251 & 21181.4413691876 & 69.5586308124035 \tabularnewline
40 & 21393 & 21312.6651211254 & 80.3348788746184 \tabularnewline
41 & 22145.2 & 22228.3309071250 & -83.1309071249703 \tabularnewline
42 & 20310.5 & 20453.6886167968 & -143.188616796834 \tabularnewline
43 & 23466.9 & 23629.1727185054 & -162.272718505362 \tabularnewline
44 & 21264.6 & 21401.412158723 & -136.812158722990 \tabularnewline
45 & 18388.1 & 18376.7479646173 & 11.3520353826587 \tabularnewline
46 & 22635.4 & 22406.1107804038 & 229.289219596211 \tabularnewline
47 & 22014.3 & 22292.4994150928 & -278.199415092787 \tabularnewline
48 & 18422.7 & 18853.3315784883 & -430.631578488291 \tabularnewline
49 & 16120.2 & 16056.1647234889 & 64.0352765111041 \tabularnewline
50 & 16037.7 & 16403.7020990252 & -366.002099025243 \tabularnewline
51 & 16410.7 & 16153.9437963463 & 256.756203653681 \tabularnewline
52 & 17749.8 & 17831.1814413996 & -81.3814413995873 \tabularnewline
53 & 16349.8 & 16258.2750861887 & 91.5249138112657 \tabularnewline
54 & 15662.3 & 15648.3246556292 & 13.9753443708437 \tabularnewline
55 & 17782.3 & 18021.9694871426 & -239.669487142638 \tabularnewline
56 & 16398.9 & 16262.0955009416 & 136.804499058368 \tabularnewline
\hline
\end{tabular}
%Source: https://freestatistics.org/blog/index.php?pk=57627&T=4

[TABLE]
[ROW][C]Multiple Linear Regression - Actuals, Interpolation, and Residuals[/C][/ROW]
[ROW][C]Time or Index[/C][C]Actuals[/C][C]InterpolationForecast[/C][C]ResidualsPrediction Error[/C][/ROW]
[ROW][C]1[/C][C]16224.2[/C][C]15722.4697005589[/C][C]501.730299441139[/C][/ROW]
[ROW][C]2[/C][C]15469.6[/C][C]15393.1063850977[/C][C]76.4936149023166[/C][/ROW]
[ROW][C]3[/C][C]16557.5[/C][C]16520.3451330267[/C][C]37.1548669733197[/C][/ROW]
[ROW][C]4[/C][C]19414.8[/C][C]19312.0020342725[/C][C]102.797965727460[/C][/ROW]
[ROW][C]5[/C][C]17335[/C][C]16952.3412087613[/C][C]382.658791238656[/C][/ROW]
[ROW][C]6[/C][C]16525.2[/C][C]16864.626593094[/C][C]-339.426593094002[/C][/ROW]
[ROW][C]7[/C][C]18160.4[/C][C]18532.2938743095[/C][C]-371.893874309476[/C][/ROW]
[ROW][C]8[/C][C]15553.8[/C][C]15454.0444432437[/C][C]99.7555567563075[/C][/ROW]
[ROW][C]9[/C][C]15262.2[/C][C]15262.1976562915[/C][C]0.00234370853682009[/C][/ROW]
[ROW][C]10[/C][C]18581[/C][C]18838.0822676880[/C][C]-257.082267687954[/C][/ROW]
[ROW][C]11[/C][C]17564.1[/C][C]17403.7380212323[/C][C]160.361978767734[/C][/ROW]
[ROW][C]12[/C][C]18948.6[/C][C]18936.1484437379[/C][C]12.4515562621255[/C][/ROW]
[ROW][C]13[/C][C]17187.8[/C][C]17770.1798726487[/C][C]-582.379872648667[/C][/ROW]
[ROW][C]14[/C][C]17564.8[/C][C]17937.367057049[/C][C]-372.567057049[/C][/ROW]
[ROW][C]15[/C][C]17668.4[/C][C]18166.5398407144[/C][C]-498.139840714376[/C][/ROW]
[ROW][C]16[/C][C]20811.7[/C][C]21313.4417972420[/C][C]-501.741797241979[/C][/ROW]
[ROW][C]17[/C][C]17257.8[/C][C]17704.2663855185[/C][C]-446.466385518454[/C][/ROW]
[ROW][C]18[/C][C]18984.2[/C][C]18892.2356771316[/C][C]91.9643228683616[/C][/ROW]
[ROW][C]19[/C][C]20532.6[/C][C]20124.2763959612[/C][C]408.323604038752[/C][/ROW]
[ROW][C]20[/C][C]17082.3[/C][C]17367.4869544814[/C][C]-285.186954481378[/C][/ROW]
[ROW][C]21[/C][C]16894.9[/C][C]17258.2392920515[/C][C]-363.339292051508[/C][/ROW]
[ROW][C]22[/C][C]20274.9[/C][C]20435.4078821629[/C][C]-160.507882162867[/C][/ROW]
[ROW][C]23[/C][C]20078.6[/C][C]19878.6299914645[/C][C]199.970008535452[/C][/ROW]
[ROW][C]24[/C][C]19900.9[/C][C]19725.2839046163[/C][C]175.616095383740[/C][/ROW]
[ROW][C]25[/C][C]17012.2[/C][C]16435.7116472807[/C][C]576.48835271934[/C][/ROW]
[ROW][C]26[/C][C]19642.9[/C][C]19107.8661515711[/C][C]535.033848428855[/C][/ROW]
[ROW][C]27[/C][C]19024[/C][C]18889.3298607250[/C][C]134.670139274971[/C][/ROW]
[ROW][C]28[/C][C]21691[/C][C]21291.0096059605[/C][C]399.990394039488[/C][/ROW]
[ROW][C]29[/C][C]18835.9[/C][C]18780.4864124065[/C][C]55.4135875935025[/C][/ROW]
[ROW][C]30[/C][C]19873.4[/C][C]19496.7244573484[/C][C]376.67554265163[/C][/ROW]
[ROW][C]31[/C][C]21468.2[/C][C]21102.6875240813[/C][C]365.512475918725[/C][/ROW]
[ROW][C]32[/C][C]19406.8[/C][C]19221.3609426103[/C][C]185.439057389692[/C][/ROW]
[ROW][C]33[/C][C]18385.3[/C][C]18033.3150870397[/C][C]351.984912960312[/C][/ROW]
[ROW][C]34[/C][C]20739.3[/C][C]20550.9990697454[/C][C]188.300930254611[/C][/ROW]
[ROW][C]35[/C][C]22268.3[/C][C]22350.4325722104[/C][C]-82.1325722103985[/C][/ROW]
[ROW][C]36[/C][C]21569[/C][C]21326.4360731576[/C][C]242.563926842426[/C][/ROW]
[ROW][C]37[/C][C]17514.8[/C][C]18074.6740560229[/C][C]-559.874056022916[/C][/ROW]
[ROW][C]38[/C][C]21124.7[/C][C]20997.6583072569[/C][C]127.041692743072[/C][/ROW]
[ROW][C]39[/C][C]21251[/C][C]21181.4413691876[/C][C]69.5586308124035[/C][/ROW]
[ROW][C]40[/C][C]21393[/C][C]21312.6651211254[/C][C]80.3348788746184[/C][/ROW]
[ROW][C]41[/C][C]22145.2[/C][C]22228.3309071250[/C][C]-83.1309071249703[/C][/ROW]
[ROW][C]42[/C][C]20310.5[/C][C]20453.6886167968[/C][C]-143.188616796834[/C][/ROW]
[ROW][C]43[/C][C]23466.9[/C][C]23629.1727185054[/C][C]-162.272718505362[/C][/ROW]
[ROW][C]44[/C][C]21264.6[/C][C]21401.412158723[/C][C]-136.812158722990[/C][/ROW]
[ROW][C]45[/C][C]18388.1[/C][C]18376.7479646173[/C][C]11.3520353826587[/C][/ROW]
[ROW][C]46[/C][C]22635.4[/C][C]22406.1107804038[/C][C]229.289219596211[/C][/ROW]
[ROW][C]47[/C][C]22014.3[/C][C]22292.4994150928[/C][C]-278.199415092787[/C][/ROW]
[ROW][C]48[/C][C]18422.7[/C][C]18853.3315784883[/C][C]-430.631578488291[/C][/ROW]
[ROW][C]49[/C][C]16120.2[/C][C]16056.1647234889[/C][C]64.0352765111041[/C][/ROW]
[ROW][C]50[/C][C]16037.7[/C][C]16403.7020990252[/C][C]-366.002099025243[/C][/ROW]
[ROW][C]51[/C][C]16410.7[/C][C]16153.9437963463[/C][C]256.756203653681[/C][/ROW]
[ROW][C]52[/C][C]17749.8[/C][C]17831.1814413996[/C][C]-81.3814413995873[/C][/ROW]
[ROW][C]53[/C][C]16349.8[/C][C]16258.2750861887[/C][C]91.5249138112657[/C][/ROW]
[ROW][C]54[/C][C]15662.3[/C][C]15648.3246556292[/C][C]13.9753443708437[/C][/ROW]
[ROW][C]55[/C][C]17782.3[/C][C]18021.9694871426[/C][C]-239.669487142638[/C][/ROW]
[ROW][C]56[/C][C]16398.9[/C][C]16262.0955009416[/C][C]136.804499058368[/C][/ROW]
[/TABLE]
Source: https://freestatistics.org/blog/index.php?pk=57627&T=4

Globally Unique Identifier (entire table): ba.freestatistics.org/blog/index.php?pk=57627&T=4

As an alternative you can also use a QR Code:  

The GUIDs for individual cells are displayed in the table below:

Multiple Linear Regression - Actuals, Interpolation, and Residuals
Time or IndexActualsInterpolationForecastResidualsPrediction Error
116224.215722.4697005589501.730299441139
215469.615393.106385097776.4936149023166
316557.516520.345133026737.1548669733197
419414.819312.0020342725102.797965727460
51733516952.3412087613382.658791238656
616525.216864.626593094-339.426593094002
718160.418532.2938743095-371.893874309476
815553.815454.044443243799.7555567563075
915262.215262.19765629150.00234370853682009
101858118838.0822676880-257.082267687954
1117564.117403.7380212323160.361978767734
1218948.618936.148443737912.4515562621255
1317187.817770.1798726487-582.379872648667
1417564.817937.367057049-372.567057049
1517668.418166.5398407144-498.139840714376
1620811.721313.4417972420-501.741797241979
1717257.817704.2663855185-446.466385518454
1818984.218892.235677131691.9643228683616
1920532.620124.2763959612408.323604038752
2017082.317367.4869544814-285.186954481378
2116894.917258.2392920515-363.339292051508
2220274.920435.4078821629-160.507882162867
2320078.619878.6299914645199.970008535452
2419900.919725.2839046163175.616095383740
2517012.216435.7116472807576.48835271934
2619642.919107.8661515711535.033848428855
271902418889.3298607250134.670139274971
282169121291.0096059605399.990394039488
2918835.918780.486412406555.4135875935025
3019873.419496.7244573484376.67554265163
3121468.221102.6875240813365.512475918725
3219406.819221.3609426103185.439057389692
3318385.318033.3150870397351.984912960312
3420739.320550.9990697454188.300930254611
3522268.322350.4325722104-82.1325722103985
362156921326.4360731576242.563926842426
3717514.818074.6740560229-559.874056022916
3821124.720997.6583072569127.041692743072
392125121181.441369187669.5586308124035
402139321312.665121125480.3348788746184
4122145.222228.3309071250-83.1309071249703
4220310.520453.6886167968-143.188616796834
4323466.923629.1727185054-162.272718505362
4421264.621401.412158723-136.812158722990
4518388.118376.747964617311.3520353826587
4622635.422406.1107804038229.289219596211
4722014.322292.4994150928-278.199415092787
4818422.718853.3315784883-430.631578488291
4916120.216056.164723488964.0352765111041
5016037.716403.7020990252-366.002099025243
5116410.716153.9437963463256.756203653681
5217749.817831.1814413996-81.3814413995873
5316349.816258.275086188791.5249138112657
5415662.315648.324655629213.9753443708437
5517782.318021.9694871426-239.669487142638
5616398.916262.0955009416136.804499058368


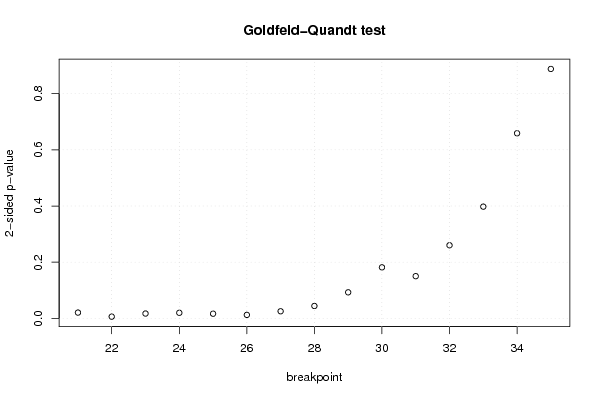
Goldfeld-Quandt test for Heteroskedasticity
p-valuesAlternative Hypothesis
breakpoint indexgreater2-sidedless
210.9897339143147840.0205321713704330.0102660856852165
220.9969584369485510.006083126102897790.00304156305144889
230.9914335909315180.0171328181369650.0085664090684825
240.9900997821775340.01980043564493210.00990021782246603
250.9917051947671180.0165896104657640.008294805232882
260.9938045160964330.01239096780713390.00619548390356695
270.987391424641410.02521715071718110.0126085753585905
280.9779464708956310.04410705820873780.0220535291043689
290.9536425190992570.0927149618014860.046357480900743
300.9091801588589790.1816396822820420.0908198411410212
310.9248827401119160.1502345197761680.0751172598880841
320.8699008040558840.2601983918882320.130099195944116
330.8011487276878350.3977025446243300.198851272312165
340.670544813347460.658910373305080.32945518665254
350.5560507772687450.887898445462510.443949222731255

\begin{tabular}{lllllllll}
\hline
Goldfeld-Quandt test for Heteroskedasticity \tabularnewline
p-values & Alternative Hypothesis \tabularnewline
breakpoint index & greater & 2-sided & less \tabularnewline
21 & 0.989733914314784 & 0.020532171370433 & 0.0102660856852165 \tabularnewline
22 & 0.996958436948551 & 0.00608312610289779 & 0.00304156305144889 \tabularnewline
23 & 0.991433590931518 & 0.017132818136965 & 0.0085664090684825 \tabularnewline
24 & 0.990099782177534 & 0.0198004356449321 & 0.00990021782246603 \tabularnewline
25 & 0.991705194767118 & 0.016589610465764 & 0.008294805232882 \tabularnewline
26 & 0.993804516096433 & 0.0123909678071339 & 0.00619548390356695 \tabularnewline
27 & 0.98739142464141 & 0.0252171507171811 & 0.0126085753585905 \tabularnewline
28 & 0.977946470895631 & 0.0441070582087378 & 0.0220535291043689 \tabularnewline
29 & 0.953642519099257 & 0.092714961801486 & 0.046357480900743 \tabularnewline
30 & 0.909180158858979 & 0.181639682282042 & 0.0908198411410212 \tabularnewline
31 & 0.924882740111916 & 0.150234519776168 & 0.0751172598880841 \tabularnewline
32 & 0.869900804055884 & 0.260198391888232 & 0.130099195944116 \tabularnewline
33 & 0.801148727687835 & 0.397702544624330 & 0.198851272312165 \tabularnewline
34 & 0.67054481334746 & 0.65891037330508 & 0.32945518665254 \tabularnewline
35 & 0.556050777268745 & 0.88789844546251 & 0.443949222731255 \tabularnewline
\hline
\end{tabular}
%Source: https://freestatistics.org/blog/index.php?pk=57627&T=5

[TABLE]
[ROW][C]Goldfeld-Quandt test for Heteroskedasticity[/C][/ROW]
[ROW][C]p-values[/C][C]Alternative Hypothesis[/C][/ROW]
[ROW][C]breakpoint index[/C][C]greater[/C][C]2-sided[/C][C]less[/C][/ROW]
[ROW][C]21[/C][C]0.989733914314784[/C][C]0.020532171370433[/C][C]0.0102660856852165[/C][/ROW]
[ROW][C]22[/C][C]0.996958436948551[/C][C]0.00608312610289779[/C][C]0.00304156305144889[/C][/ROW]
[ROW][C]23[/C][C]0.991433590931518[/C][C]0.017132818136965[/C][C]0.0085664090684825[/C][/ROW]
[ROW][C]24[/C][C]0.990099782177534[/C][C]0.0198004356449321[/C][C]0.00990021782246603[/C][/ROW]
[ROW][C]25[/C][C]0.991705194767118[/C][C]0.016589610465764[/C][C]0.008294805232882[/C][/ROW]
[ROW][C]26[/C][C]0.993804516096433[/C][C]0.0123909678071339[/C][C]0.00619548390356695[/C][/ROW]
[ROW][C]27[/C][C]0.98739142464141[/C][C]0.0252171507171811[/C][C]0.0126085753585905[/C][/ROW]
[ROW][C]28[/C][C]0.977946470895631[/C][C]0.0441070582087378[/C][C]0.0220535291043689[/C][/ROW]
[ROW][C]29[/C][C]0.953642519099257[/C][C]0.092714961801486[/C][C]0.046357480900743[/C][/ROW]
[ROW][C]30[/C][C]0.909180158858979[/C][C]0.181639682282042[/C][C]0.0908198411410212[/C][/ROW]
[ROW][C]31[/C][C]0.924882740111916[/C][C]0.150234519776168[/C][C]0.0751172598880841[/C][/ROW]
[ROW][C]32[/C][C]0.869900804055884[/C][C]0.260198391888232[/C][C]0.130099195944116[/C][/ROW]
[ROW][C]33[/C][C]0.801148727687835[/C][C]0.397702544624330[/C][C]0.198851272312165[/C][/ROW]
[ROW][C]34[/C][C]0.67054481334746[/C][C]0.65891037330508[/C][C]0.32945518665254[/C][/ROW]
[ROW][C]35[/C][C]0.556050777268745[/C][C]0.88789844546251[/C][C]0.443949222731255[/C][/ROW]
[/TABLE]
Source: https://freestatistics.org/blog/index.php?pk=57627&T=5

Globally Unique Identifier (entire table): ba.freestatistics.org/blog/index.php?pk=57627&T=5

As an alternative you can also use a QR Code:  

The GUIDs for individual cells are displayed in the table below:

Goldfeld-Quandt test for Heteroskedasticity
p-valuesAlternative Hypothesis
breakpoint indexgreater2-sidedless
210.9897339143147840.0205321713704330.0102660856852165
220.9969584369485510.006083126102897790.00304156305144889
230.9914335909315180.0171328181369650.0085664090684825
240.9900997821775340.01980043564493210.00990021782246603
250.9917051947671180.0165896104657640.008294805232882
260.9938045160964330.01239096780713390.00619548390356695
270.987391424641410.02521715071718110.0126085753585905
280.9779464708956310.04410705820873780.0220535291043689
290.9536425190992570.0927149618014860.046357480900743
300.9091801588589790.1816396822820420.0908198411410212
310.9248827401119160.1502345197761680.0751172598880841
320.8699008040558840.2601983918882320.130099195944116
330.8011487276878350.3977025446243300.198851272312165
340.670544813347460.658910373305080.32945518665254
350.5560507772687450.887898445462510.443949222731255


Meta Analysis of Goldfeld-Quandt test for Heteroskedasticity
Description# significant tests% significant testsOK/NOK
1% type I error level10.0666666666666667NOK
5% type I error level80.533333333333333NOK
10% type I error level90.6NOK

\begin{tabular}{lllllllll}
\hline
Meta Analysis of Goldfeld-Quandt test for Heteroskedasticity \tabularnewline
Description & # significant tests & % significant tests & OK/NOK \tabularnewline
1% type I error level & 1 & 0.0666666666666667 & NOK \tabularnewline
5% type I error level & 8 & 0.533333333333333 & NOK \tabularnewline
10% type I error level & 9 & 0.6 & NOK \tabularnewline
\hline
\end{tabular}
%Source: https://freestatistics.org/blog/index.php?pk=57627&T=6

[TABLE]
[ROW][C]Meta Analysis of Goldfeld-Quandt test for Heteroskedasticity[/C][/ROW]
[ROW][C]Description[/C][C]# significant tests[/C][C]% significant tests[/C][C]OK/NOK[/C][/ROW]
[ROW][C]1% type I error level[/C][C]1[/C][C]0.0666666666666667[/C][C]NOK[/C][/ROW]
[ROW][C]5% type I error level[/C][C]8[/C][C]0.533333333333333[/C][C]NOK[/C][/ROW]
[ROW][C]10% type I error level[/C][C]9[/C][C]0.6[/C][C]NOK[/C][/ROW]
[/TABLE]
Source: https://freestatistics.org/blog/index.php?pk=57627&T=6

Globally Unique Identifier (entire table): ba.freestatistics.org/blog/index.php?pk=57627&T=6

As an alternative you can also use a QR Code:  

The GUIDs for individual cells are displayed in the table below:

Meta Analysis of Goldfeld-Quandt test for Heteroskedasticity
Description# significant tests% significant testsOK/NOK
1% type I error level10.0666666666666667NOK
5% type I error level80.533333333333333NOK
10% type I error level90.6NOK


Parameters (Session):
par1 = 1 ; par2 = Include Monthly Dummies ; par3 = Linear Trend ;
Parameters (R input):
par1 = 1 ; par2 = Include Monthly Dummies ; par3 = Linear Trend ;
R code (references can be found in the software module):
library(lattice)
library(lmtest)
n25 <- 25 #minimum number of obs. for Goldfeld-Quandt test
par1 <- as.numeric(par1)
x <- t(y)
k <- length(x[1,])
n <- length(x[,1])
x1 <- cbind(x[,par1], x[,1:k!=par1])
mycolnames <- c(colnames(x)[par1], colnames(x)[1:k!=par1])
colnames(x1) <- mycolnames #colnames(x)[par1]
x <- x1
if (par3 == 'First Differences'){
x2 <- array(0, dim=c(n-1,k), dimnames=list(1:(n-1), paste('(1-B)',colnames(x),sep='')))
for (i in 1:n-1) {
for (j in 1:k) {
x2[i,j] <- x[i+1,j] - x[i,j]
}
}
x <- x2
}
if (par2 == 'Include Monthly Dummies'){
x2 <- array(0, dim=c(n,11), dimnames=list(1:n, paste('M', seq(1:11), sep ='')))
for (i in 1:11){
x2[seq(i,n,12),i] <- 1
}
x <- cbind(x, x2)
}
if (par2 == 'Include Quarterly Dummies'){
x2 <- array(0, dim=c(n,3), dimnames=list(1:n, paste('Q', seq(1:3), sep ='')))
for (i in 1:3){
x2[seq(i,n,4),i] <- 1
}
x <- cbind(x, x2)
}
k <- length(x[1,])
if (par3 == 'Linear Trend'){
x <- cbind(x, c(1:n))
colnames(x)[k+1] <- 't'
}
x
k <- length(x[1,])
df <- as.data.frame(x)
(mylm <- lm(df))
(mysum <- summary(mylm))
if (n > n25) {
kp3 <- k + 3
nmkm3 <- n - k - 3
gqarr <- array(NA, dim=c(nmkm3-kp3+1,3))
numgqtests <- 0
numsignificant1 <- 0
numsignificant5 <- 0
numsignificant10 <- 0
for (mypoint in kp3:nmkm3) {
j <- 0
numgqtests <- numgqtests + 1
for (myalt in c('greater', 'two.sided', 'less')) {
j <- j + 1
gqarr[mypoint-kp3+1,j] <- gqtest(mylm, point=mypoint, alternative=myalt)$p.value
}
if (gqarr[mypoint-kp3+1,2] < 0.01) numsignificant1 <- numsignificant1 + 1
if (gqarr[mypoint-kp3+1,2] < 0.05) numsignificant5 <- numsignificant5 + 1
if (gqarr[mypoint-kp3+1,2] < 0.10) numsignificant10 <- numsignificant10 + 1
}
gqarr
}
bitmap(file='test0.png')
plot(x[,1], type='l', main='Actuals and Interpolation', ylab='value of Actuals and Interpolation (dots)', xlab='time or index')
points(x[,1]-mysum$resid)
grid()
dev.off()
bitmap(file='test1.png')
plot(mysum$resid, type='b', pch=19, main='Residuals', ylab='value of Residuals', xlab='time or index')
grid()
dev.off()
bitmap(file='test2.png')
hist(mysum$resid, main='Residual Histogram', xlab='values of Residuals')
grid()
dev.off()
bitmap(file='test3.png')
densityplot(~mysum$resid,col='black',main='Residual Density Plot', xlab='values of Residuals')
dev.off()
bitmap(file='test4.png')
qqnorm(mysum$resid, main='Residual Normal Q-Q Plot')
qqline(mysum$resid)
grid()
dev.off()
(myerror <- as.ts(mysum$resid))
bitmap(file='test5.png')
dum <- cbind(lag(myerror,k=1),myerror)
dum
dum1 <- dum[2:length(myerror),]
dum1
z <- as.data.frame(dum1)
z
plot(z,main=paste('Residual Lag plot, lowess, and regression line'), ylab='values of Residuals', xlab='lagged values of Residuals')
lines(lowess(z))
abline(lm(z))
grid()
dev.off()
bitmap(file='test6.png')
acf(mysum$resid, lag.max=length(mysum$resid)/2, main='Residual Autocorrelation Function')
grid()
dev.off()
bitmap(file='test7.png')
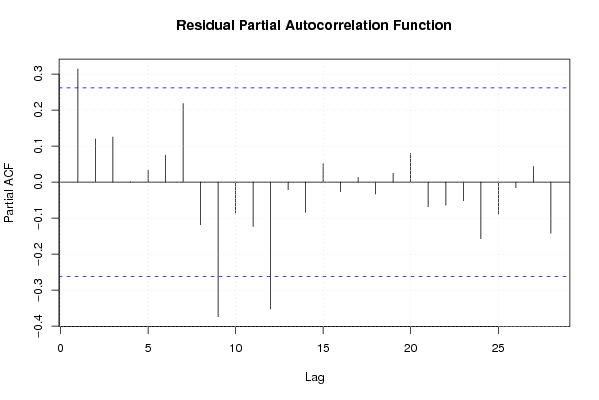
pacf(mysum$resid, lag.max=length(mysum$resid)/2, main='Residual Partial Autocorrelation Function')
grid()
dev.off()
bitmap(file='test8.png')
opar <- par(mfrow = c(2,2), oma = c(0, 0, 1.1, 0))
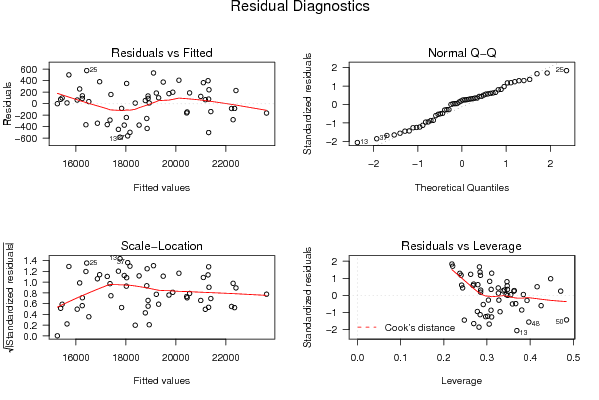
plot(mylm, las = 1, sub='Residual Diagnostics')
par(opar)
dev.off()
if (n > n25) {
bitmap(file='test9.png')
plot(kp3:nmkm3,gqarr[,2], main='Goldfeld-Quandt test',ylab='2-sided p-value',xlab='breakpoint')
grid()
dev.off()
}
load(file='createtable')
a<-table.start()
a<-table.row.start(a)
a<-table.element(a, 'Multiple Linear Regression - Estimated Regression Equation', 1, TRUE)
a<-table.row.end(a)
myeq <- colnames(x)[1]
myeq <- paste(myeq, '[t] = ', sep='')
for (i in 1:k){
if (mysum$coefficients[i,1] > 0) myeq <- paste(myeq, '+', '')
myeq <- paste(myeq, mysum$coefficients[i,1], sep=' ')
if (rownames(mysum$coefficients)[i] != '(Intercept)') {
myeq <- paste(myeq, rownames(mysum$coefficients)[i], sep='')
if (rownames(mysum$coefficients)[i] != 't') myeq <- paste(myeq, '[t]', sep='')
}
}
myeq <- paste(myeq, ' + e[t]')
a<-table.row.start(a)
a<-table.element(a, myeq)
a<-table.row.end(a)
a<-table.end(a)
table.save(a,file='mytable1.tab')
a<-table.start()
a<-table.row.start(a)
a<-table.element(a,hyperlink('ols1.htm','Multiple Linear Regression - Ordinary Least Squares',''), 6, TRUE)
a<-table.row.end(a)
a<-table.row.start(a)
a<-table.element(a,'Variable',header=TRUE)
a<-table.element(a,'Parameter',header=TRUE)
a<-table.element(a,'S.D.',header=TRUE)
a<-table.element(a,'T-STAT
H0: parameter = 0',header=TRUE)
a<-table.element(a,'2-tail p-value',header=TRUE)
a<-table.element(a,'1-tail p-value',header=TRUE)
a<-table.row.end(a)
for (i in 1:k){
a<-table.row.start(a)
a<-table.element(a,rownames(mysum$coefficients)[i],header=TRUE)
a<-table.element(a,mysum$coefficients[i,1])
a<-table.element(a, round(mysum$coefficients[i,2],6))
a<-table.element(a, round(mysum$coefficients[i,3],4))
a<-table.element(a, round(mysum$coefficients[i,4],6))
a<-table.element(a, round(mysum$coefficients[i,4]/2,6))
a<-table.row.end(a)
}
a<-table.end(a)
table.save(a,file='mytable2.tab')
a<-table.start()
a<-table.row.start(a)
a<-table.element(a, 'Multiple Linear Regression - Regression Statistics', 2, TRUE)
a<-table.row.end(a)
a<-table.row.start(a)
a<-table.element(a, 'Multiple R',1,TRUE)
a<-table.element(a, sqrt(mysum$r.squared))
a<-table.row.end(a)
a<-table.row.start(a)
a<-table.element(a, 'R-squared',1,TRUE)
a<-table.element(a, mysum$r.squared)
a<-table.row.end(a)
a<-table.row.start(a)
a<-table.element(a, 'Adjusted R-squared',1,TRUE)
a<-table.element(a, mysum$adj.r.squared)
a<-table.row.end(a)
a<-table.row.start(a)
a<-table.element(a, 'F-TEST (value)',1,TRUE)
a<-table.element(a, mysum$fstatistic[1])
a<-table.row.end(a)
a<-table.row.start(a)
a<-table.element(a, 'F-TEST (DF numerator)',1,TRUE)
a<-table.element(a, mysum$fstatistic[2])
a<-table.row.end(a)
a<-table.row.start(a)
a<-table.element(a, 'F-TEST (DF denominator)',1,TRUE)
a<-table.element(a, mysum$fstatistic[3])
a<-table.row.end(a)
a<-table.row.start(a)
a<-table.element(a, 'p-value',1,TRUE)
a<-table.element(a, 1-pf(mysum$fstatistic[1],mysum$fstatistic[2],mysum$fstatistic[3]))
a<-table.row.end(a)
a<-table.row.start(a)
a<-table.element(a, 'Multiple Linear Regression - Residual Statistics', 2, TRUE)
a<-table.row.end(a)
a<-table.row.start(a)
a<-table.element(a, 'Residual Standard Deviation',1,TRUE)
a<-table.element(a, mysum$sigma)
a<-table.row.end(a)
a<-table.row.start(a)
a<-table.element(a, 'Sum Squared Residuals',1,TRUE)
a<-table.element(a, sum(myerror*myerror))
a<-table.row.end(a)
a<-table.end(a)
table.save(a,file='mytable3.tab')
a<-table.start()
a<-table.row.start(a)
a<-table.element(a, 'Multiple Linear Regression - Actuals, Interpolation, and Residuals', 4, TRUE)
a<-table.row.end(a)
a<-table.row.start(a)
a<-table.element(a, 'Time or Index', 1, TRUE)
a<-table.element(a, 'Actuals', 1, TRUE)
a<-table.element(a, 'Interpolation
Forecast', 1, TRUE)
a<-table.element(a, 'Residuals
Prediction Error', 1, TRUE)
a<-table.row.end(a)
for (i in 1:n) {
a<-table.row.start(a)
a<-table.element(a,i, 1, TRUE)
a<-table.element(a,x[i])
a<-table.element(a,x[i]-mysum$resid[i])
a<-table.element(a,mysum$resid[i])
a<-table.row.end(a)
}
a<-table.end(a)
table.save(a,file='mytable4.tab')
if (n > n25) {
a<-table.start()
a<-table.row.start(a)
a<-table.element(a,'Goldfeld-Quandt test for Heteroskedasticity',4,TRUE)
a<-table.row.end(a)
a<-table.row.start(a)
a<-table.element(a,'p-values',header=TRUE)
a<-table.element(a,'Alternative Hypothesis',3,header=TRUE)
a<-table.row.end(a)
a<-table.row.start(a)
a<-table.element(a,'breakpoint index',header=TRUE)
a<-table.element(a,'greater',header=TRUE)
a<-table.element(a,'2-sided',header=TRUE)
a<-table.element(a,'less',header=TRUE)
a<-table.row.end(a)
for (mypoint in kp3:nmkm3) {
a<-table.row.start(a)
a<-table.element(a,mypoint,header=TRUE)
a<-table.element(a,gqarr[mypoint-kp3+1,1])
a<-table.element(a,gqarr[mypoint-kp3+1,2])
a<-table.element(a,gqarr[mypoint-kp3+1,3])
a<-table.row.end(a)
}
a<-table.end(a)
table.save(a,file='mytable5.tab')
a<-table.start()
a<-table.row.start(a)
a<-table.element(a,'Meta Analysis of Goldfeld-Quandt test for Heteroskedasticity',4,TRUE)
a<-table.row.end(a)
a<-table.row.start(a)
a<-table.element(a,'Description',header=TRUE)
a<-table.element(a,'# significant tests',header=TRUE)
a<-table.element(a,'% significant tests',header=TRUE)
a<-table.element(a,'OK/NOK',header=TRUE)
a<-table.row.end(a)
a<-table.row.start(a)
a<-table.element(a,'1% type I error level',header=TRUE)
a<-table.element(a,numsignificant1)
a<-table.element(a,numsignificant1/numgqtests)
if (numsignificant1/numgqtests < 0.01) dum <- 'OK' else dum <- 'NOK'
a<-table.element(a,dum)
a<-table.row.end(a)
a<-table.row.start(a)
a<-table.element(a,'5% type I error level',header=TRUE)
a<-table.element(a,numsignificant5)
a<-table.element(a,numsignificant5/numgqtests)
if (numsignificant5/numgqtests < 0.05) dum <- 'OK' else dum <- 'NOK'
a<-table.element(a,dum)
a<-table.row.end(a)
a<-table.row.start(a)
a<-table.element(a,'10% type I error level',header=TRUE)
a<-table.element(a,numsignificant10)
a<-table.element(a,numsignificant10/numgqtests)
if (numsignificant10/numgqtests < 0.1) dum <- 'OK' else dum <- 'NOK'
a<-table.element(a,dum)
a<-table.row.end(a)
a<-table.end(a)
table.save(a,file='mytable6.tab')
}