Free Statistics
of Irreproducible Research!
Description of Statistical Computation | |||||||||||||||||||||||||||||||||||||||||||||||||||||||||||||||||||||||||||||||
|---|---|---|---|---|---|---|---|---|---|---|---|---|---|---|---|---|---|---|---|---|---|---|---|---|---|---|---|---|---|---|---|---|---|---|---|---|---|---|---|---|---|---|---|---|---|---|---|---|---|---|---|---|---|---|---|---|---|---|---|---|---|---|---|---|---|---|---|---|---|---|---|---|---|---|---|---|---|---|---|
| Author's title | |||||||||||||||||||||||||||||||||||||||||||||||||||||||||||||||||||||||||||||||
| Author | *The author of this computation has been verified* | ||||||||||||||||||||||||||||||||||||||||||||||||||||||||||||||||||||||||||||||
| R Software Module | Ian.Hollidayrwasp_Pregnancy and cognition.wasp | ||||||||||||||||||||||||||||||||||||||||||||||||||||||||||||||||||||||||||||||
| Title produced by software | Variability | ||||||||||||||||||||||||||||||||||||||||||||||||||||||||||||||||||||||||||||||
| Date of computation | Wed, 28 Oct 2009 15:14:02 -0600 | ||||||||||||||||||||||||||||||||||||||||||||||||||||||||||||||||||||||||||||||
| Cite this page as follows | Statistical Computations at FreeStatistics.org, Office for Research Development and Education, URL https://freestatistics.org/blog/index.php?v=date/2009/Oct/28/t1256764547igtr7ht2kx9t60q.htm/, Retrieved Thu, 30 Jul 2026 23:25:39 +0000 | ||||||||||||||||||||||||||||||||||||||||||||||||||||||||||||||||||||||||||||||
| Statistical Computations at FreeStatistics.org, Office for Research Development and Education, URL https://freestatistics.org/blog/index.php?pk=51840, Retrieved Thu, 30 Jul 2026 23:25:39 +0000 | |||||||||||||||||||||||||||||||||||||||||||||||||||||||||||||||||||||||||||||||
| QR Codes: | |||||||||||||||||||||||||||||||||||||||||||||||||||||||||||||||||||||||||||||||
|
| |||||||||||||||||||||||||||||||||||||||||||||||||||||||||||||||||||||||||||||||
| Original text written by user: | |||||||||||||||||||||||||||||||||||||||||||||||||||||||||||||||||||||||||||||||
| IsPrivate? | No (this computation is public) | ||||||||||||||||||||||||||||||||||||||||||||||||||||||||||||||||||||||||||||||
| User-defined keywords | Pregnancy and Cognition dataset. Wrokshop 4 PY2224 Aston University | ||||||||||||||||||||||||||||||||||||||||||||||||||||||||||||||||||||||||||||||
| Estimated Impact | 988 | ||||||||||||||||||||||||||||||||||||||||||||||||||||||||||||||||||||||||||||||
Tree of Dependent Computations | |||||||||||||||||||||||||||||||||||||||||||||||||||||||||||||||||||||||||||||||
| Family? (F = Feedback message, R = changed R code, M = changed R Module, P = changed Parameters, D = changed Data) | |||||||||||||||||||||||||||||||||||||||||||||||||||||||||||||||||||||||||||||||
| - [Variability] [Pregnancy and Cog...] [2009-10-28 21:14:02] [a9208f4f8d3b118336aae915785f2bd9] [Current] - [Variability] [compendium 4 ] [2009-10-28 21:48:58] [f1ef06f47321aa4b8d61127511b90b62] - D [Variability] [compendium 4] [2009-10-28 21:54:04] [f1ef06f47321aa4b8d61127511b90b62] - D [Variability] [compendium 4] [2009-10-28 21:57:40] [f1ef06f47321aa4b8d61127511b90b62] - D [Variability] [wk 4 wshop memory...] [2009-10-29 00:59:50] [c519646407a489a26f129bdc22b2e203] - D [Variability] [wk 4 wshop applie...] [2009-10-29 01:07:26] [c519646407a489a26f129bdc22b2e203] - [Variability] [wk 4 wshop memo pair] [2009-10-29 01:12:03] [c519646407a489a26f129bdc22b2e203] - D [Variability] [wk 4 wshop atten ...] [2009-10-29 01:15:22] [c519646407a489a26f129bdc22b2e203] - RMPD [Kendall tau Correlation Matrix] [example] [2009-10-29 10:35:55] [b98453cac15ba1066b407e146608df68] - [Variability] [4] [2009-10-29 12:18:11] [7ee8584ae92dbbc2a823887b8397aaa8] - P [Variability] [week 4 excercise ...] [2009-10-29 12:24:04] [a2ec18f77143ca7c2255feafca790c81] - P [Variability] [week 4 excercise ...] [2009-10-29 12:28:38] [a2ec18f77143ca7c2255feafca790c81] - [Variability] [week 4 excercise ...] [2009-10-29 17:36:31] [a2ec18f77143ca7c2255feafca790c81] - D [Variability] [week 4 excercise ...] [2009-10-29 17:40:11] [a2ec18f77143ca7c2255feafca790c81] - D [Variability] [week 4 excercise ...] [2009-10-29 17:42:52] [a2ec18f77143ca7c2255feafca790c81] - P [Variability] [4] [2009-10-29 12:22:59] [7ee8584ae92dbbc2a823887b8397aaa8] - D [Variability] [meanvariables] [2009-10-29 12:26:01] [d5ced5f570beeeb823add0810690c151] - P [Variability] [compendium4] [2009-10-29 12:28:48] [98c63a60e57a9ebbf84cf062cbeaf5fe] - D [Variability] [compendium 4 ] [2009-10-29 12:29:05] [f1ef06f47321aa4b8d61127511b90b62] - [Variability] [Week 4] [2009-10-29 12:33:53] [d85e8cd4dd2ccdf2c3dfa3761837f774] - D [Variability] [compendium 4] [2009-10-29 12:35:40] [f1ef06f47321aa4b8d61127511b90b62] - D [Variability] [meanvariables2] [2009-10-29 12:35:49] [d5ced5f570beeeb823add0810690c151] - D [Variability] [meanvariables3] [2009-10-29 12:39:34] [d5ced5f570beeeb823add0810690c151] - [Variability] [comp4.shap] [2009-10-29 12:54:45] [6754037f2a7547483397efade45eb176] - P [Variability] [comp4.shap.pear] [2009-10-29 13:22:07] [6754037f2a7547483397efade45eb176] - PD [Variability] [comp4.shap atten] [2009-10-29 13:28:42] [6754037f2a7547483397efade45eb176] - [Variability] [comp4.shap3] [2009-10-29 13:33:12] [6754037f2a7547483397efade45eb176] - [Variability] [comp4_shap&spearc...] [2009-11-03 09:04:56] [6754037f2a7547483397efade45eb176] - P [Variability] [spearmancompmea] [2009-11-03 08:52:35] [6754037f2a7547483397efade45eb176] - D [Variability] [compattenmean] [2009-11-03 09:22:30] [6754037f2a7547483397efade45eb176] - D [Variability] [compappliedmean] [2009-11-03 09:25:28] [6754037f2a7547483397efade45eb176] - PD [Correlation] [q2] [2010-06-02 09:56:29] [6754037f2a7547483397efade45eb176] - RMPD [T-Tests] [q2pt2] [2010-06-02 10:09:32] [6754037f2a7547483397efade45eb176] - [Variability] [Shaprio Wilks - m...] [2009-10-29 13:19:58] [cb1b5098fbe5e6779d164349741d91ea] - P [Variability] [Compendium 4 Exer...] [2009-10-29 13:23:21] [da8ef2b5f272f3481b509cba20833cef] - D [Variability] [Shapiro Wilks - a...] [2009-10-29 13:28:18] [74be16979710d4c4e7c6647856088456] - [Variability] [MemoryCorrelation] [2009-10-29 13:29:48] [68b4a0d51ad214b1a79d67393064cb7e] - D [Variability] [Specattenmean and...] [2009-10-29 13:30:40] [f92b1014b0eca5452e0c3ed42064454c] - D [Variability] [Comappliedmean an...] [2009-10-29 13:37:44] [f92b1014b0eca5452e0c3ed42064454c] - P [Variability] [Pearson's correla...] [2009-10-31 17:06:25] [f92b1014b0eca5452e0c3ed42064454c] - D [Variability] [Commemomean and S...] [2009-10-29 13:37:44] [f92b1014b0eca5452e0c3ed42064454c] - P [Variability] [Pearson's correla...] [2009-10-31 17:03:48] [f92b1014b0eca5452e0c3ed42064454c] - D [Variability] [workshop week4] [2009-10-29 13:31:26] [256a42577f5eb7e9c8a1b74c73a90fa8] - [Variability] [] [2009-10-29 13:30:18] [e9dbed8f63950395c9f0d093d021a3af] - [Variability] [compendium 4 blog 1] [2009-10-29 13:31:35] [86674042f568b97a0cb1393bb670625c] - D [Variability] [compendium4 ex2] [2009-10-29 13:37:20] [86674042f568b97a0cb1393bb670625c] - D [Variability] [compendium 4 ex 3] [2009-10-29 13:40:18] [86674042f568b97a0cb1393bb670625c] - D [Variability] [compendium 4 blog 4] [2009-10-29 13:49:54] [86674042f568b97a0cb1393bb670625c] - D [Variability] [compendium 4] [2009-10-29 20:17:07] [86674042f568b97a0cb1393bb670625c] [Truncated] | |||||||||||||||||||||||||||||||||||||||||||||||||||||||||||||||||||||||||||||||
| Feedback Forum | |||||||||||||||||||||||||||||||||||||||||||||||||||||||||||||||||||||||||||||||
Post a new message | |||||||||||||||||||||||||||||||||||||||||||||||||||||||||||||||||||||||||||||||
Dataset | |||||||||||||||||||||||||||||||||||||||||||||||||||||||||||||||||||||||||||||||
| Dataseries X: | |||||||||||||||||||||||||||||||||||||||||||||||||||||||||||||||||||||||||||||||
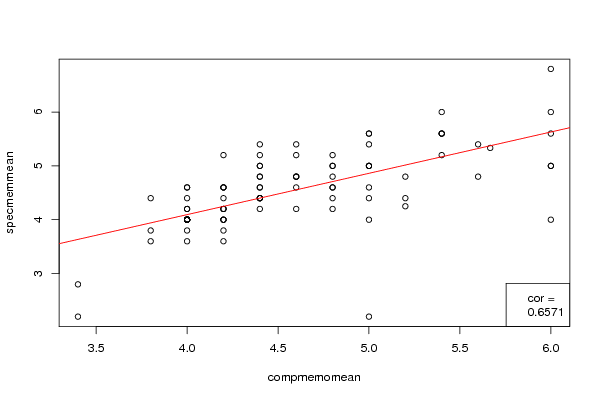
4.8 5.4 6 6 4 6 4.2 4.2 4.2 4 4.6 5.666666667 3.8 4.8 4.2 4 5.4 4.6 4 4.4 5 5.4 5.2 4.4 4 3.4 4.4 4 4.4 4.4 4 4.8 4 4 5 4 3.4 4 5.4 4.2 4 5.6 4.8 4.4 4.6 4 5.2 4.8 4.6 4 4.2 4.6 4.4 5 5 4 3.8 5.2 4.2 4.4 4.2 6 4.8 4 4.4 4 4.8 4.8 5.6 6 4 4.2 5 4.4 4.2 4.6 4.4 4 4 4 4.2 4 5 4.2 5.4 4 6 3.8 5 4.4 5 4.4 5 4.2 4.6 5 | |||||||||||||||||||||||||||||||||||||||||||||||||||||||||||||||||||||||||||||||
| Dataseries Y: | |||||||||||||||||||||||||||||||||||||||||||||||||||||||||||||||||||||||||||||||
4.6 5.6 4 5 4.4 6 4 4.4 4.6 4 4.8 5.333333333 4.4 5.2 5.2 4 5.2 4.8 4 4.4 5.6 6 4.8 4.2 4 2.8 4.8 4.2 4.8 5.2 4.6 4.4 4 3.6 4.6 4 2.2 4 5.6 3.6 4 5.4 5 4.4 4.6 3.8 4.25 4.6 5.2 4 4.2 4.2 4.6 5.6 5.4 4 3.6 4.4 4.6 4.4 4 5 4.8 4 4.6 4 5 4.2 4.8 6.8 4 4.2 5 5 4.6 4.8 5 4.2 4 4 3.8 4.6 4 4.2 5.6 4 5.6 3.8 5 5.4 5 4.4 4.4 4 5.4 2.2 | |||||||||||||||||||||||||||||||||||||||||||||||||||||||||||||||||||||||||||||||
Tables (Output of Computation) | |||||||||||||||||||||||||||||||||||||||||||||||||||||||||||||||||||||||||||||||
| |||||||||||||||||||||||||||||||||||||||||||||||||||||||||||||||||||||||||||||||
Figures (Output of Computation) | |||||||||||||||||||||||||||||||||||||||||||||||||||||||||||||||||||||||||||||||
Input Parameters & R Code | |||||||||||||||||||||||||||||||||||||||||||||||||||||||||||||||||||||||||||||||
| Parameters (Session): | |||||||||||||||||||||||||||||||||||||||||||||||||||||||||||||||||||||||||||||||
| par1 = spearman ; par2 = two.sided ; | |||||||||||||||||||||||||||||||||||||||||||||||||||||||||||||||||||||||||||||||
| Parameters (R input): | |||||||||||||||||||||||||||||||||||||||||||||||||||||||||||||||||||||||||||||||
| par1 = spearman ; par2 = two.sided ; | |||||||||||||||||||||||||||||||||||||||||||||||||||||||||||||||||||||||||||||||
| R code (references can be found in the software module): | |||||||||||||||||||||||||||||||||||||||||||||||||||||||||||||||||||||||||||||||
bitmap(file='test1.png') | |||||||||||||||||||||||||||||||||||||||||||||||||||||||||||||||||||||||||||||||