Free Statistics

of Irreproducible Research!

Author's title

Author*The author of this computation has been verified*
R Software Modulerwasp_arimabackwardselection.wasp
Title produced by softwareARIMA Backward Selection
Date of computationThu, 16 Dec 2010 12:47:35 +0000
Cite this page as followsStatistical Computations at FreeStatistics.org, Office for Research Development and Education, URL https://freestatistics.org/blog/index.php?v=date/2010/Dec/16/t1292503535e4u0k1xoq8afw3b.htm/, Retrieved Mon, 29 Apr 2024 11:45:30 +0000
Statistical Computations at FreeStatistics.org, Office for Research Development and Education, URL https://freestatistics.org/blog/index.php?pk=110881, Retrieved Mon, 29 Apr 2024 11:45:30 +0000
QR Codes:

Original text written by user:
IsPrivate?No (this computation is public)
User-defined keywords
Estimated Impact166
Family? (F = Feedback message, R = changed R code, M = changed R Module, P = changed Parameters, D = changed Data)
-     [Univariate Data Series] [data set] [2008-12-01 19:54:57] [b98453cac15ba1066b407e146608df68]
- RMP   [ARIMA Backward Selection] [] [2009-11-27 14:53:14] [b98453cac15ba1066b407e146608df68]
-   PD    [ARIMA Backward Selection] [prijsindex van de...] [2009-12-04 19:29:11] [7773f496f69461f4a67891f0ef752622]
-   P       [ARIMA Backward Selection] [review] [2009-12-10 16:30:27] [ca30429b07824e7c5d48293114d35d71]
-             [ARIMA Backward Selection] [ARIMA Appelen Jon...] [2009-12-19 09:37:49] [7773f496f69461f4a67891f0ef752622]
-    D            [ARIMA Backward Selection] [arima backward ba...] [2010-12-16 12:47:35] [2fa539864aa87c5da4977c85c6885fac] [Current]
-   PD              [ARIMA Backward Selection] [Arima backward se...] [2010-12-19 11:59:26] [ff7c1e95cf99a1dae07ec89975494dde]
Feedback Forum

Post a new message
Dataseries X:
0.81
0.81
0.81
0.79
0.78
0.78
0.77
0.78
0.77
0.78
0.79
0.79
0.79
0.79
0.79
0.8
0.8
0.8
0.8
0.81
0.8
0.82
0.85
0.85
0.86
0.85
0.83
0.81
0.82
0.82
0.78
0.78
0.73
0.68
0.65
0.62
0.6
0.6
0.59
0.6
0.6
0.6
0.59
0.58
0.56
0.55
0.54
0.55
0.55
0.54
0.54
0.54
0.53
0.53
0.53
0.53


Summary of computational transaction
Raw Inputview raw input (R code)
Raw Outputview raw output of R engine
Computing time19 seconds
R Server'RServer@AstonUniversity' @ vre.aston.ac.uk

\begin{tabular}{lllllllll}
\hline
Summary of computational transaction \tabularnewline
Raw Input & view raw input (R code)  \tabularnewline
Raw Output & view raw output of R engine  \tabularnewline
Computing time & 19 seconds \tabularnewline
R Server & 'RServer@AstonUniversity' @ vre.aston.ac.uk \tabularnewline
\hline
\end{tabular}
%Source: https://freestatistics.org/blog/index.php?pk=110881&T=0

[TABLE]
[ROW][C]Summary of computational transaction[/C][/ROW]
[ROW][C]Raw Input[/C][C]view raw input (R code) [/C][/ROW]
[ROW][C]Raw Output[/C][C]view raw output of R engine [/C][/ROW]
[ROW][C]Computing time[/C][C]19 seconds[/C][/ROW]
[ROW][C]R Server[/C][C]'RServer@AstonUniversity' @ vre.aston.ac.uk[/C][/ROW]
[/TABLE]
Source: https://freestatistics.org/blog/index.php?pk=110881&T=0

Globally Unique Identifier (entire table): ba.freestatistics.org/blog/index.php?pk=110881&T=0

As an alternative you can also use a QR Code:  

The GUIDs for individual cells are displayed in the table below:

Summary of computational transaction
Raw Inputview raw input (R code)
Raw Outputview raw output of R engine
Computing time19 seconds
R Server'RServer@AstonUniversity' @ vre.aston.ac.uk


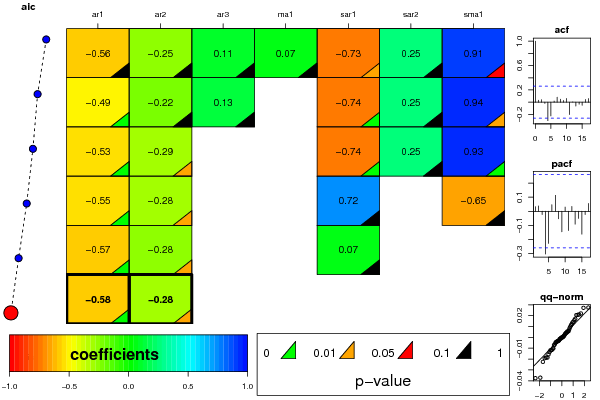
ARIMA Parameter Estimation and Backward Selection
Iterationar1ar2ar3ma1sar1sar2sma1
Estimates ( 1 )-0.5641-0.25250.11270.0739-0.72970.24550.9072
(p-val)(0.258 )(0.3874 )(0.561 )(0.8772 )(0.0209 )(0.3111 )(0.0859 )
Estimates ( 2 )-0.4913-0.21650.13140-0.73830.25230.9421
(p-val)(0.0012 )(0.1619 )(0.3387 )(NA )(0.0052 )(0.2806 )(0.042 )
Estimates ( 3 )-0.5328-0.290500-0.74350.24510.9334
(p-val)(3e-04 )(0.0327 )(NA )(NA )(0.0017 )(0.2728 )(0 )
Estimates ( 4 )-0.5522-0.2825000.72150-0.6464
(p-val)(2e-04 )(0.036 )(NA )(NA )(0.6969 )(NA )(0.7375 )
Estimates ( 5 )-0.5668-0.2799000.067800
(p-val)(1e-04 )(0.0363 )(NA )(NA )(0.6276 )(NA )(NA )
Estimates ( 6 )-0.583-0.283500000
(p-val)(0 )(0.0333 )(NA )(NA )(NA )(NA )(NA )
Estimates ( 7 )NANANANANANANA
(p-val)(NA )(NA )(NA )(NA )(NA )(NA )(NA )
Estimates ( 8 )NANANANANANANA
(p-val)(NA )(NA )(NA )(NA )(NA )(NA )(NA )
Estimates ( 9 )NANANANANANANA
(p-val)(NA )(NA )(NA )(NA )(NA )(NA )(NA )
Estimates ( 10 )NANANANANANANA
(p-val)(NA )(NA )(NA )(NA )(NA )(NA )(NA )
Estimates ( 11 )NANANANANANANA
(p-val)(NA )(NA )(NA )(NA )(NA )(NA )(NA )
Estimates ( 12 )NANANANANANANA
(p-val)(NA )(NA )(NA )(NA )(NA )(NA )(NA )
Estimates ( 13 )NANANANANANANA
(p-val)(NA )(NA )(NA )(NA )(NA )(NA )(NA )

\begin{tabular}{lllllllll}
\hline
ARIMA Parameter Estimation and Backward Selection \tabularnewline
Iteration & ar1 & ar2 & ar3 & ma1 & sar1 & sar2 & sma1 \tabularnewline
Estimates ( 1 ) & -0.5641 & -0.2525 & 0.1127 & 0.0739 & -0.7297 & 0.2455 & 0.9072 \tabularnewline
(p-val) & (0.258 ) & (0.3874 ) & (0.561 ) & (0.8772 ) & (0.0209 ) & (0.3111 ) & (0.0859 ) \tabularnewline
Estimates ( 2 ) & -0.4913 & -0.2165 & 0.1314 & 0 & -0.7383 & 0.2523 & 0.9421 \tabularnewline
(p-val) & (0.0012 ) & (0.1619 ) & (0.3387 ) & (NA ) & (0.0052 ) & (0.2806 ) & (0.042 ) \tabularnewline
Estimates ( 3 ) & -0.5328 & -0.2905 & 0 & 0 & -0.7435 & 0.2451 & 0.9334 \tabularnewline
(p-val) & (3e-04 ) & (0.0327 ) & (NA ) & (NA ) & (0.0017 ) & (0.2728 ) & (0 ) \tabularnewline
Estimates ( 4 ) & -0.5522 & -0.2825 & 0 & 0 & 0.7215 & 0 & -0.6464 \tabularnewline
(p-val) & (2e-04 ) & (0.036 ) & (NA ) & (NA ) & (0.6969 ) & (NA ) & (0.7375 ) \tabularnewline
Estimates ( 5 ) & -0.5668 & -0.2799 & 0 & 0 & 0.0678 & 0 & 0 \tabularnewline
(p-val) & (1e-04 ) & (0.0363 ) & (NA ) & (NA ) & (0.6276 ) & (NA ) & (NA ) \tabularnewline
Estimates ( 6 ) & -0.583 & -0.2835 & 0 & 0 & 0 & 0 & 0 \tabularnewline
(p-val) & (0 ) & (0.0333 ) & (NA ) & (NA ) & (NA ) & (NA ) & (NA ) \tabularnewline
Estimates ( 7 ) & NA & NA & NA & NA & NA & NA & NA \tabularnewline
(p-val) & (NA ) & (NA ) & (NA ) & (NA ) & (NA ) & (NA ) & (NA ) \tabularnewline
Estimates ( 8 ) & NA & NA & NA & NA & NA & NA & NA \tabularnewline
(p-val) & (NA ) & (NA ) & (NA ) & (NA ) & (NA ) & (NA ) & (NA ) \tabularnewline
Estimates ( 9 ) & NA & NA & NA & NA & NA & NA & NA \tabularnewline
(p-val) & (NA ) & (NA ) & (NA ) & (NA ) & (NA ) & (NA ) & (NA ) \tabularnewline
Estimates ( 10 ) & NA & NA & NA & NA & NA & NA & NA \tabularnewline
(p-val) & (NA ) & (NA ) & (NA ) & (NA ) & (NA ) & (NA ) & (NA ) \tabularnewline
Estimates ( 11 ) & NA & NA & NA & NA & NA & NA & NA \tabularnewline
(p-val) & (NA ) & (NA ) & (NA ) & (NA ) & (NA ) & (NA ) & (NA ) \tabularnewline
Estimates ( 12 ) & NA & NA & NA & NA & NA & NA & NA \tabularnewline
(p-val) & (NA ) & (NA ) & (NA ) & (NA ) & (NA ) & (NA ) & (NA ) \tabularnewline
Estimates ( 13 ) & NA & NA & NA & NA & NA & NA & NA \tabularnewline
(p-val) & (NA ) & (NA ) & (NA ) & (NA ) & (NA ) & (NA ) & (NA ) \tabularnewline
\hline
\end{tabular}
%Source: https://freestatistics.org/blog/index.php?pk=110881&T=1

[TABLE]
[ROW][C]ARIMA Parameter Estimation and Backward Selection[/C][/ROW]
[ROW][C]Iteration[/C][C]ar1[/C][C]ar2[/C][C]ar3[/C][C]ma1[/C][C]sar1[/C][C]sar2[/C][C]sma1[/C][/ROW]
[ROW][C]Estimates ( 1 )[/C][C]-0.5641[/C][C]-0.2525[/C][C]0.1127[/C][C]0.0739[/C][C]-0.7297[/C][C]0.2455[/C][C]0.9072[/C][/ROW]
[ROW][C](p-val)[/C][C](0.258 )[/C][C](0.3874 )[/C][C](0.561 )[/C][C](0.8772 )[/C][C](0.0209 )[/C][C](0.3111 )[/C][C](0.0859 )[/C][/ROW]
[ROW][C]Estimates ( 2 )[/C][C]-0.4913[/C][C]-0.2165[/C][C]0.1314[/C][C]0[/C][C]-0.7383[/C][C]0.2523[/C][C]0.9421[/C][/ROW]
[ROW][C](p-val)[/C][C](0.0012 )[/C][C](0.1619 )[/C][C](0.3387 )[/C][C](NA )[/C][C](0.0052 )[/C][C](0.2806 )[/C][C](0.042 )[/C][/ROW]
[ROW][C]Estimates ( 3 )[/C][C]-0.5328[/C][C]-0.2905[/C][C]0[/C][C]0[/C][C]-0.7435[/C][C]0.2451[/C][C]0.9334[/C][/ROW]
[ROW][C](p-val)[/C][C](3e-04 )[/C][C](0.0327 )[/C][C](NA )[/C][C](NA )[/C][C](0.0017 )[/C][C](0.2728 )[/C][C](0 )[/C][/ROW]
[ROW][C]Estimates ( 4 )[/C][C]-0.5522[/C][C]-0.2825[/C][C]0[/C][C]0[/C][C]0.7215[/C][C]0[/C][C]-0.6464[/C][/ROW]
[ROW][C](p-val)[/C][C](2e-04 )[/C][C](0.036 )[/C][C](NA )[/C][C](NA )[/C][C](0.6969 )[/C][C](NA )[/C][C](0.7375 )[/C][/ROW]
[ROW][C]Estimates ( 5 )[/C][C]-0.5668[/C][C]-0.2799[/C][C]0[/C][C]0[/C][C]0.0678[/C][C]0[/C][C]0[/C][/ROW]
[ROW][C](p-val)[/C][C](1e-04 )[/C][C](0.0363 )[/C][C](NA )[/C][C](NA )[/C][C](0.6276 )[/C][C](NA )[/C][C](NA )[/C][/ROW]
[ROW][C]Estimates ( 6 )[/C][C]-0.583[/C][C]-0.2835[/C][C]0[/C][C]0[/C][C]0[/C][C]0[/C][C]0[/C][/ROW]
[ROW][C](p-val)[/C][C](0 )[/C][C](0.0333 )[/C][C](NA )[/C][C](NA )[/C][C](NA )[/C][C](NA )[/C][C](NA )[/C][/ROW]
[ROW][C]Estimates ( 7 )[/C][C]NA[/C][C]NA[/C][C]NA[/C][C]NA[/C][C]NA[/C][C]NA[/C][C]NA[/C][/ROW]
[ROW][C](p-val)[/C][C](NA )[/C][C](NA )[/C][C](NA )[/C][C](NA )[/C][C](NA )[/C][C](NA )[/C][C](NA )[/C][/ROW]
[ROW][C]Estimates ( 8 )[/C][C]NA[/C][C]NA[/C][C]NA[/C][C]NA[/C][C]NA[/C][C]NA[/C][C]NA[/C][/ROW]
[ROW][C](p-val)[/C][C](NA )[/C][C](NA )[/C][C](NA )[/C][C](NA )[/C][C](NA )[/C][C](NA )[/C][C](NA )[/C][/ROW]
[ROW][C]Estimates ( 9 )[/C][C]NA[/C][C]NA[/C][C]NA[/C][C]NA[/C][C]NA[/C][C]NA[/C][C]NA[/C][/ROW]
[ROW][C](p-val)[/C][C](NA )[/C][C](NA )[/C][C](NA )[/C][C](NA )[/C][C](NA )[/C][C](NA )[/C][C](NA )[/C][/ROW]
[ROW][C]Estimates ( 10 )[/C][C]NA[/C][C]NA[/C][C]NA[/C][C]NA[/C][C]NA[/C][C]NA[/C][C]NA[/C][/ROW]
[ROW][C](p-val)[/C][C](NA )[/C][C](NA )[/C][C](NA )[/C][C](NA )[/C][C](NA )[/C][C](NA )[/C][C](NA )[/C][/ROW]
[ROW][C]Estimates ( 11 )[/C][C]NA[/C][C]NA[/C][C]NA[/C][C]NA[/C][C]NA[/C][C]NA[/C][C]NA[/C][/ROW]
[ROW][C](p-val)[/C][C](NA )[/C][C](NA )[/C][C](NA )[/C][C](NA )[/C][C](NA )[/C][C](NA )[/C][C](NA )[/C][/ROW]
[ROW][C]Estimates ( 12 )[/C][C]NA[/C][C]NA[/C][C]NA[/C][C]NA[/C][C]NA[/C][C]NA[/C][C]NA[/C][/ROW]
[ROW][C](p-val)[/C][C](NA )[/C][C](NA )[/C][C](NA )[/C][C](NA )[/C][C](NA )[/C][C](NA )[/C][C](NA )[/C][/ROW]
[ROW][C]Estimates ( 13 )[/C][C]NA[/C][C]NA[/C][C]NA[/C][C]NA[/C][C]NA[/C][C]NA[/C][C]NA[/C][/ROW]
[ROW][C](p-val)[/C][C](NA )[/C][C](NA )[/C][C](NA )[/C][C](NA )[/C][C](NA )[/C][C](NA )[/C][C](NA )[/C][/ROW]
[/TABLE]
Source: https://freestatistics.org/blog/index.php?pk=110881&T=1

Globally Unique Identifier (entire table): ba.freestatistics.org/blog/index.php?pk=110881&T=1

As an alternative you can also use a QR Code:  

The GUIDs for individual cells are displayed in the table below:

ARIMA Parameter Estimation and Backward Selection
Iterationar1ar2ar3ma1sar1sar2sma1
Estimates ( 1 )-0.5641-0.25250.11270.0739-0.72970.24550.9072
(p-val)(0.258 )(0.3874 )(0.561 )(0.8772 )(0.0209 )(0.3111 )(0.0859 )
Estimates ( 2 )-0.4913-0.21650.13140-0.73830.25230.9421
(p-val)(0.0012 )(0.1619 )(0.3387 )(NA )(0.0052 )(0.2806 )(0.042 )
Estimates ( 3 )-0.5328-0.290500-0.74350.24510.9334
(p-val)(3e-04 )(0.0327 )(NA )(NA )(0.0017 )(0.2728 )(0 )
Estimates ( 4 )-0.5522-0.2825000.72150-0.6464
(p-val)(2e-04 )(0.036 )(NA )(NA )(0.6969 )(NA )(0.7375 )
Estimates ( 5 )-0.5668-0.2799000.067800
(p-val)(1e-04 )(0.0363 )(NA )(NA )(0.6276 )(NA )(NA )
Estimates ( 6 )-0.583-0.283500000
(p-val)(0 )(0.0333 )(NA )(NA )(NA )(NA )(NA )
Estimates ( 7 )NANANANANANANA
(p-val)(NA )(NA )(NA )(NA )(NA )(NA )(NA )
Estimates ( 8 )NANANANANANANA
(p-val)(NA )(NA )(NA )(NA )(NA )(NA )(NA )
Estimates ( 9 )NANANANANANANA
(p-val)(NA )(NA )(NA )(NA )(NA )(NA )(NA )
Estimates ( 10 )NANANANANANANA
(p-val)(NA )(NA )(NA )(NA )(NA )(NA )(NA )
Estimates ( 11 )NANANANANANANA
(p-val)(NA )(NA )(NA )(NA )(NA )(NA )(NA )
Estimates ( 12 )NANANANANANANA
(p-val)(NA )(NA )(NA )(NA )(NA )(NA )(NA )
Estimates ( 13 )NANANANANANANA
(p-val)(NA )(NA )(NA )(NA )(NA )(NA )(NA )


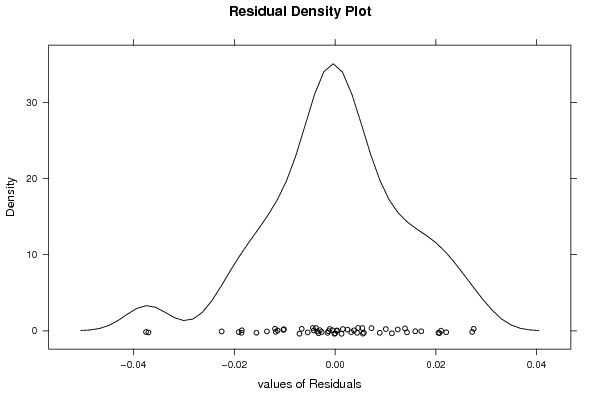
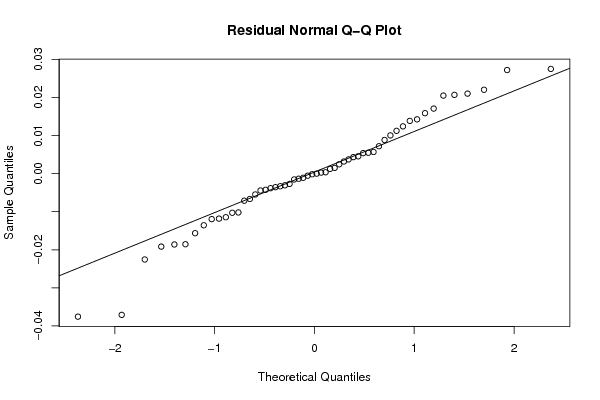
Estimated ARIMA Residuals
Value
-0.00108672604781063
-1.28031667750374e-06
-0.0191566234474287
-0.00133263834713498
0.0100461229618914
-0.00152603750457141
0.017087395018779
-0.0114439369202344
0.0142579010543717
0.00569159183834311
-0.00442865914116905
-0.0054635702877747
-0.00305170408059901
-0.000154206936352568
0.0112479505121858
-0.00424187732245634
-0.00355170253887627
-0.00269455728320819
0.00883881630072244
-0.0135553674796176
0.0204965850790475
0.021016845820606
-0.0156383587583053
-0.00382015544047848
-0.0225382708516588
-0.0185367066193744
-0.0119424994234625
0.0274951351207332
0.00719732526593228
-0.0370823443404584
0.0138531773344188
-0.0375521487181454
-0.0185988220553886
0.00455641872389951
0.0124154768774902
0.0158820347047203
0.0272081851299046
0.00539023261943085
0.0206929892390077
-0.00330708962214941
-0.000545237226946126
-0.0102721178423457
-0.0066525712061965
-0.0101872804744688
0.00549445276969034
0.00246189291935896
0.0220301910228351
0.00027801888911845
-0.0118103902691309
0.00125365829240773
0.00151821389341069
-0.0071022870247355
0.00433716637101307
0.00373661194905893
0.00318269442775488

\begin{tabular}{lllllllll}
\hline
Estimated ARIMA Residuals \tabularnewline
Value \tabularnewline
-0.00108672604781063 \tabularnewline
-1.28031667750374e-06 \tabularnewline
-0.0191566234474287 \tabularnewline
-0.00133263834713498 \tabularnewline
0.0100461229618914 \tabularnewline
-0.00152603750457141 \tabularnewline
0.017087395018779 \tabularnewline
-0.0114439369202344 \tabularnewline
0.0142579010543717 \tabularnewline
0.00569159183834311 \tabularnewline
-0.00442865914116905 \tabularnewline
-0.0054635702877747 \tabularnewline
-0.00305170408059901 \tabularnewline
-0.000154206936352568 \tabularnewline
0.0112479505121858 \tabularnewline
-0.00424187732245634 \tabularnewline
-0.00355170253887627 \tabularnewline
-0.00269455728320819 \tabularnewline
0.00883881630072244 \tabularnewline
-0.0135553674796176 \tabularnewline
0.0204965850790475 \tabularnewline
0.021016845820606 \tabularnewline
-0.0156383587583053 \tabularnewline
-0.00382015544047848 \tabularnewline
-0.0225382708516588 \tabularnewline
-0.0185367066193744 \tabularnewline
-0.0119424994234625 \tabularnewline
0.0274951351207332 \tabularnewline
0.00719732526593228 \tabularnewline
-0.0370823443404584 \tabularnewline
0.0138531773344188 \tabularnewline
-0.0375521487181454 \tabularnewline
-0.0185988220553886 \tabularnewline
0.00455641872389951 \tabularnewline
0.0124154768774902 \tabularnewline
0.0158820347047203 \tabularnewline
0.0272081851299046 \tabularnewline
0.00539023261943085 \tabularnewline
0.0206929892390077 \tabularnewline
-0.00330708962214941 \tabularnewline
-0.000545237226946126 \tabularnewline
-0.0102721178423457 \tabularnewline
-0.0066525712061965 \tabularnewline
-0.0101872804744688 \tabularnewline
0.00549445276969034 \tabularnewline
0.00246189291935896 \tabularnewline
0.0220301910228351 \tabularnewline
0.00027801888911845 \tabularnewline
-0.0118103902691309 \tabularnewline
0.00125365829240773 \tabularnewline
0.00151821389341069 \tabularnewline
-0.0071022870247355 \tabularnewline
0.00433716637101307 \tabularnewline
0.00373661194905893 \tabularnewline
0.00318269442775488 \tabularnewline
\hline
\end{tabular}
%Source: https://freestatistics.org/blog/index.php?pk=110881&T=2

[TABLE]
[ROW][C]Estimated ARIMA Residuals[/C][/ROW]
[ROW][C]Value[/C][/ROW]
[ROW][C]-0.00108672604781063[/C][/ROW]
[ROW][C]-1.28031667750374e-06[/C][/ROW]
[ROW][C]-0.0191566234474287[/C][/ROW]
[ROW][C]-0.00133263834713498[/C][/ROW]
[ROW][C]0.0100461229618914[/C][/ROW]
[ROW][C]-0.00152603750457141[/C][/ROW]
[ROW][C]0.017087395018779[/C][/ROW]
[ROW][C]-0.0114439369202344[/C][/ROW]
[ROW][C]0.0142579010543717[/C][/ROW]
[ROW][C]0.00569159183834311[/C][/ROW]
[ROW][C]-0.00442865914116905[/C][/ROW]
[ROW][C]-0.0054635702877747[/C][/ROW]
[ROW][C]-0.00305170408059901[/C][/ROW]
[ROW][C]-0.000154206936352568[/C][/ROW]
[ROW][C]0.0112479505121858[/C][/ROW]
[ROW][C]-0.00424187732245634[/C][/ROW]
[ROW][C]-0.00355170253887627[/C][/ROW]
[ROW][C]-0.00269455728320819[/C][/ROW]
[ROW][C]0.00883881630072244[/C][/ROW]
[ROW][C]-0.0135553674796176[/C][/ROW]
[ROW][C]0.0204965850790475[/C][/ROW]
[ROW][C]0.021016845820606[/C][/ROW]
[ROW][C]-0.0156383587583053[/C][/ROW]
[ROW][C]-0.00382015544047848[/C][/ROW]
[ROW][C]-0.0225382708516588[/C][/ROW]
[ROW][C]-0.0185367066193744[/C][/ROW]
[ROW][C]-0.0119424994234625[/C][/ROW]
[ROW][C]0.0274951351207332[/C][/ROW]
[ROW][C]0.00719732526593228[/C][/ROW]
[ROW][C]-0.0370823443404584[/C][/ROW]
[ROW][C]0.0138531773344188[/C][/ROW]
[ROW][C]-0.0375521487181454[/C][/ROW]
[ROW][C]-0.0185988220553886[/C][/ROW]
[ROW][C]0.00455641872389951[/C][/ROW]
[ROW][C]0.0124154768774902[/C][/ROW]
[ROW][C]0.0158820347047203[/C][/ROW]
[ROW][C]0.0272081851299046[/C][/ROW]
[ROW][C]0.00539023261943085[/C][/ROW]
[ROW][C]0.0206929892390077[/C][/ROW]
[ROW][C]-0.00330708962214941[/C][/ROW]
[ROW][C]-0.000545237226946126[/C][/ROW]
[ROW][C]-0.0102721178423457[/C][/ROW]
[ROW][C]-0.0066525712061965[/C][/ROW]
[ROW][C]-0.0101872804744688[/C][/ROW]
[ROW][C]0.00549445276969034[/C][/ROW]
[ROW][C]0.00246189291935896[/C][/ROW]
[ROW][C]0.0220301910228351[/C][/ROW]
[ROW][C]0.00027801888911845[/C][/ROW]
[ROW][C]-0.0118103902691309[/C][/ROW]
[ROW][C]0.00125365829240773[/C][/ROW]
[ROW][C]0.00151821389341069[/C][/ROW]
[ROW][C]-0.0071022870247355[/C][/ROW]
[ROW][C]0.00433716637101307[/C][/ROW]
[ROW][C]0.00373661194905893[/C][/ROW]
[ROW][C]0.00318269442775488[/C][/ROW]
[/TABLE]
Source: https://freestatistics.org/blog/index.php?pk=110881&T=2

Globally Unique Identifier (entire table): ba.freestatistics.org/blog/index.php?pk=110881&T=2

As an alternative you can also use a QR Code:  

The GUIDs for individual cells are displayed in the table below:

Estimated ARIMA Residuals
Value
-0.00108672604781063
-1.28031667750374e-06
-0.0191566234474287
-0.00133263834713498
0.0100461229618914
-0.00152603750457141
0.017087395018779
-0.0114439369202344
0.0142579010543717
0.00569159183834311
-0.00442865914116905
-0.0054635702877747
-0.00305170408059901
-0.000154206936352568
0.0112479505121858
-0.00424187732245634
-0.00355170253887627
-0.00269455728320819
0.00883881630072244
-0.0135553674796176
0.0204965850790475
0.021016845820606
-0.0156383587583053
-0.00382015544047848
-0.0225382708516588
-0.0185367066193744
-0.0119424994234625
0.0274951351207332
0.00719732526593228
-0.0370823443404584
0.0138531773344188
-0.0375521487181454
-0.0185988220553886
0.00455641872389951
0.0124154768774902
0.0158820347047203
0.0272081851299046
0.00539023261943085
0.0206929892390077
-0.00330708962214941
-0.000545237226946126
-0.0102721178423457
-0.0066525712061965
-0.0101872804744688
0.00549445276969034
0.00246189291935896
0.0220301910228351
0.00027801888911845
-0.0118103902691309
0.00125365829240773
0.00151821389341069
-0.0071022870247355
0.00433716637101307
0.00373661194905893
0.00318269442775488


Parameters (Session):
par1 = FALSE ; par2 = 1 ; par3 = 2 ; par4 = 0 ; par5 = 12 ; par6 = 3 ; par7 = 1 ; par8 = 2 ; par9 = 1 ;
Parameters (R input):
par1 = FALSE ; par2 = 1 ; par3 = 2 ; par4 = 0 ; par5 = 12 ; par6 = 3 ; par7 = 1 ; par8 = 2 ; par9 = 1 ;
R code (references can be found in the software module):
library(lattice)
if (par1 == 'TRUE') par1 <- TRUE
if (par1 == 'FALSE') par1 <- FALSE
par2 <- as.numeric(par2) #Box-Cox lambda transformation parameter
par3 <- as.numeric(par3) #degree of non-seasonal differencing
par4 <- as.numeric(par4) #degree of seasonal differencing
par5 <- as.numeric(par5) #seasonal period
par6 <- as.numeric(par6) #degree (p) of the non-seasonal AR(p) polynomial
par7 <- as.numeric(par7) #degree (q) of the non-seasonal MA(q) polynomial
par8 <- as.numeric(par8) #degree (P) of the seasonal AR(P) polynomial
par9 <- as.numeric(par9) #degree (Q) of the seasonal MA(Q) polynomial
armaGR <- function(arima.out, names, n){
try1 <- arima.out$coef
try2 <- sqrt(diag(arima.out$var.coef))
try.data.frame <- data.frame(matrix(NA,ncol=4,nrow=length(names)))
dimnames(try.data.frame) <- list(names,c('coef','std','tstat','pv'))
try.data.frame[,1] <- try1
for(i in 1:length(try2)) try.data.frame[which(rownames(try.data.frame)==names(try2)[i]),2] <- try2[i]
try.data.frame[,3] <- try.data.frame[,1] / try.data.frame[,2]
try.data.frame[,4] <- round((1-pt(abs(try.data.frame[,3]),df=n-(length(try2)+1)))*2,5)
vector <- rep(NA,length(names))
vector[is.na(try.data.frame[,4])] <- 0
maxi <- which.max(try.data.frame[,4])
continue <- max(try.data.frame[,4],na.rm=TRUE) > .05
vector[maxi] <- 0
list(summary=try.data.frame,next.vector=vector,continue=continue)
}
arimaSelect <- function(series, order=c(13,0,0), seasonal=list(order=c(2,0,0),period=12), include.mean=F){
nrc <- order[1]+order[3]+seasonal$order[1]+seasonal$order[3]
coeff <- matrix(NA, nrow=nrc*2, ncol=nrc)
pval <- matrix(NA, nrow=nrc*2, ncol=nrc)
mylist <- rep(list(NULL), nrc)
names <- NULL
if(order[1] > 0) names <- paste('ar',1:order[1],sep='')
if(order[3] > 0) names <- c( names , paste('ma',1:order[3],sep='') )
if(seasonal$order[1] > 0) names <- c(names, paste('sar',1:seasonal$order[1],sep=''))
if(seasonal$order[3] > 0) names <- c(names, paste('sma',1:seasonal$order[3],sep=''))
arima.out <- arima(series, order=order, seasonal=seasonal, include.mean=include.mean, method='ML')
mylist[[1]] <- arima.out
last.arma <- armaGR(arima.out, names, length(series))
mystop <- FALSE
i <- 1
coeff[i,] <- last.arma[[1]][,1]
pval [i,] <- last.arma[[1]][,4]
i <- 2
aic <- arima.out$aic
while(!mystop){
mylist[[i]] <- arima.out
arima.out <- arima(series, order=order, seasonal=seasonal, include.mean=include.mean, method='ML', fixed=last.arma$next.vector)
aic <- c(aic, arima.out$aic)
last.arma <- armaGR(arima.out, names, length(series))
mystop <- !last.arma$continue
coeff[i,] <- last.arma[[1]][,1]
pval [i,] <- last.arma[[1]][,4]
i <- i+1
}
list(coeff, pval, mylist, aic=aic)
}
arimaSelectplot <- function(arimaSelect.out,noms,choix){
noms <- names(arimaSelect.out[[3]][[1]]$coef)
coeff <- arimaSelect.out[[1]]
k <- min(which(is.na(coeff[,1])))-1
coeff <- coeff[1:k,]
pval <- arimaSelect.out[[2]][1:k,]
aic <- arimaSelect.out$aic[1:k]
coeff[coeff==0] <- NA
n <- ncol(coeff)
if(missing(choix)) choix <- k
layout(matrix(c(1,1,1,2,
3,3,3,2,
3,3,3,4,
5,6,7,7),nr=4),
widths=c(10,35,45,15),
heights=c(30,30,15,15))
couleurs <- rainbow(75)[1:50]#(50)
ticks <- pretty(coeff)
par(mar=c(1,1,3,1))
plot(aic,k:1-.5,type='o',pch=21,bg='blue',cex=2,axes=F,lty=2,xpd=NA)
points(aic[choix],k-choix+.5,pch=21,cex=4,bg=2,xpd=NA)
title('aic',line=2)
par(mar=c(3,0,0,0))
plot(0,axes=F,xlab='',ylab='',xlim=range(ticks),ylim=c(.1,1))
rect(xleft = min(ticks) + (0:49)/50*(max(ticks)-min(ticks)),
xright = min(ticks) + (1:50)/50*(max(ticks)-min(ticks)),
ytop = rep(1,50),
ybottom= rep(0,50),col=couleurs,border=NA)
axis(1,ticks)
rect(xleft=min(ticks),xright=max(ticks),ytop=1,ybottom=0)
text(mean(coeff,na.rm=T),.5,'coefficients',cex=2,font=2)
par(mar=c(1,1,3,1))
image(1:n,1:k,t(coeff[k:1,]),axes=F,col=couleurs,zlim=range(ticks))
for(i in 1:n) for(j in 1:k) if(!is.na(coeff[j,i])) {
if(pval[j,i]<.01) symb = 'green'
else if( (pval[j,i]<.05) & (pval[j,i]>=.01)) symb = 'orange'
else if( (pval[j,i]<.1) & (pval[j,i]>=.05)) symb = 'red'
else symb = 'black'
polygon(c(i+.5 ,i+.2 ,i+.5 ,i+.5),
c(k-j+0.5,k-j+0.5,k-j+0.8,k-j+0.5),
col=symb)
if(j==choix) {
rect(xleft=i-.5,
xright=i+.5,
ybottom=k-j+1.5,
ytop=k-j+.5,
lwd=4)
text(i,
k-j+1,
round(coeff[j,i],2),
cex=1.2,
font=2)
}
else{
rect(xleft=i-.5,xright=i+.5,ybottom=k-j+1.5,ytop=k-j+.5)
text(i,k-j+1,round(coeff[j,i],2),cex=1.2,font=1)
}
}
axis(3,1:n,noms)
par(mar=c(0.5,0,0,0.5))
plot(0,axes=F,xlab='',ylab='',type='n',xlim=c(0,8),ylim=c(-.2,.8))
cols <- c('green','orange','red','black')
niv <- c('0','0.01','0.05','0.1')
for(i in 0:3){
polygon(c(1+2*i ,1+2*i ,1+2*i-.5 ,1+2*i),
c(.4 ,.7 , .4 , .4),
col=cols[i+1])
text(2*i,0.5,niv[i+1],cex=1.5)
}
text(8,.5,1,cex=1.5)
text(4,0,'p-value',cex=2)
box()
residus <- arimaSelect.out[[3]][[choix]]$res
par(mar=c(1,2,4,1))
acf(residus,main='')
title('acf',line=.5)
par(mar=c(1,2,4,1))
pacf(residus,main='')
title('pacf',line=.5)
par(mar=c(2,2,4,1))
qqnorm(residus,main='')
title('qq-norm',line=.5)
qqline(residus)
residus
}
if (par2 == 0) x <- log(x)
if (par2 != 0) x <- x^par2
(selection <- arimaSelect(x, order=c(par6,par3,par7), seasonal=list(order=c(par8,par4,par9), period=par5)))
bitmap(file='test1.png')
resid <- arimaSelectplot(selection)
dev.off()
resid
bitmap(file='test2.png')
acf(resid,length(resid)/2, main='Residual Autocorrelation Function')
dev.off()
bitmap(file='test3.png')
pacf(resid,length(resid)/2, main='Residual Partial Autocorrelation Function')
dev.off()
bitmap(file='test4.png')
cpgram(resid, main='Residual Cumulative Periodogram')
dev.off()
bitmap(file='test5.png')
hist(resid, main='Residual Histogram', xlab='values of Residuals')
dev.off()
bitmap(file='test6.png')
densityplot(~resid,col='black',main='Residual Density Plot', xlab='values of Residuals')
dev.off()
bitmap(file='test7.png')
qqnorm(resid, main='Residual Normal Q-Q Plot')
qqline(resid)
dev.off()
ncols <- length(selection[[1]][1,])
nrows <- length(selection[[2]][,1])-1
load(file='createtable')
a<-table.start()
a<-table.row.start(a)
a<-table.element(a,'ARIMA Parameter Estimation and Backward Selection', ncols+1,TRUE)
a<-table.row.end(a)
a<-table.row.start(a)
a<-table.element(a,'Iteration', header=TRUE)
for (i in 1:ncols) {
a<-table.element(a,names(selection[[3]][[1]]$coef)[i],header=TRUE)
}
a<-table.row.end(a)
for (j in 1:nrows) {
a<-table.row.start(a)
mydum <- 'Estimates ('
mydum <- paste(mydum,j)
mydum <- paste(mydum,')')
a<-table.element(a,mydum, header=TRUE)
for (i in 1:ncols) {
a<-table.element(a,round(selection[[1]][j,i],4))
}
a<-table.row.end(a)
a<-table.row.start(a)
a<-table.element(a,'(p-val)', header=TRUE)
for (i in 1:ncols) {
mydum <- '('
mydum <- paste(mydum,round(selection[[2]][j,i],4),sep='')
mydum <- paste(mydum,')')
a<-table.element(a,mydum)
}
a<-table.row.end(a)
}
a<-table.end(a)
table.save(a,file='mytable.tab')
a<-table.start()
a<-table.row.start(a)
a<-table.element(a,'Estimated ARIMA Residuals', 1,TRUE)
a<-table.row.end(a)
a<-table.row.start(a)
a<-table.element(a,'Value', 1,TRUE)
a<-table.row.end(a)
for (i in (par4*par5+par3):length(resid)) {
a<-table.row.start(a)
a<-table.element(a,resid[i])
a<-table.row.end(a)
}
a<-table.end(a)
table.save(a,file='mytable1.tab')