Free Statistics

of Irreproducible Research!

Author's title

Author*The author of this computation has been verified*
R Software Modulerwasp_arimabackwardselection.wasp
Title produced by softwareARIMA Backward Selection
Date of computationTue, 21 Dec 2010 20:10:27 +0000
Cite this page as followsStatistical Computations at FreeStatistics.org, Office for Research Development and Education, URL https://freestatistics.org/blog/index.php?v=date/2010/Dec/21/t1292962537gv6dct3p7ht7g2a.htm/, Retrieved Thu, 09 May 2024 03:52:18 +0000
Statistical Computations at FreeStatistics.org, Office for Research Development and Education, URL https://freestatistics.org/blog/index.php?pk=113933, Retrieved Thu, 09 May 2024 03:52:18 +0000
QR Codes:

Original text written by user:
IsPrivate?No (this computation is public)
User-defined keywords
Estimated Impact120
Family? (F = Feedback message, R = changed R code, M = changed R Module, P = changed Parameters, D = changed Data)
-     [Standard Deviation-Mean Plot] [autocorrelation] [2009-12-12 14:01:45] [f84db15a18b564cd160ebc7b4eade151]
- RMP   [ARIMA Backward Selection] [Paper. ARIMA Back...] [2009-12-18 22:06:40] [d31db4f83c6a129f6d3e47077769e868]
-    D      [ARIMA Backward Selection] [ARIMA Backward Se...] [2010-12-21 20:10:27] [733bf75cb326fe693c93e834bfd34d22] [Current]
Feedback Forum

Post a new message
Dataseries X:
548604
563668
586111
604378
600991
544686
537034
551531
563250
574761
580112
575093
557560
564478
580523
596594
586570
536214
523597
536535
536322
532638
528222
516141
501866
506174
517945
533590
528379
477580
469357
490243
492622
507561
516922
514258
509846
527070
541657
564591
555362
498662
511038
525919
531673
548854
560576
557274
565742
587625
619916
625809
619567
572942
572775
574205
579799
590072
593408
597141
595404
612117
628232
628884
620735
569028
567456
573100
584428
589379
590865
595454
594167


Summary of computational transaction
Raw Inputview raw input (R code)
Raw Outputview raw output of R engine
Computing time9 seconds
R Server'RServer@AstonUniversity' @ vre.aston.ac.uk

\begin{tabular}{lllllllll}
\hline
Summary of computational transaction \tabularnewline
Raw Input & view raw input (R code)  \tabularnewline
Raw Output & view raw output of R engine  \tabularnewline
Computing time & 9 seconds \tabularnewline
R Server & 'RServer@AstonUniversity' @ vre.aston.ac.uk \tabularnewline
\hline
\end{tabular}
%Source: https://freestatistics.org/blog/index.php?pk=113933&T=0

[TABLE]
[ROW][C]Summary of computational transaction[/C][/ROW]
[ROW][C]Raw Input[/C][C]view raw input (R code) [/C][/ROW]
[ROW][C]Raw Output[/C][C]view raw output of R engine [/C][/ROW]
[ROW][C]Computing time[/C][C]9 seconds[/C][/ROW]
[ROW][C]R Server[/C][C]'RServer@AstonUniversity' @ vre.aston.ac.uk[/C][/ROW]
[/TABLE]
Source: https://freestatistics.org/blog/index.php?pk=113933&T=0

Globally Unique Identifier (entire table): ba.freestatistics.org/blog/index.php?pk=113933&T=0

As an alternative you can also use a QR Code:  

The GUIDs for individual cells are displayed in the table below:

Summary of computational transaction
Raw Inputview raw input (R code)
Raw Outputview raw output of R engine
Computing time9 seconds
R Server'RServer@AstonUniversity' @ vre.aston.ac.uk


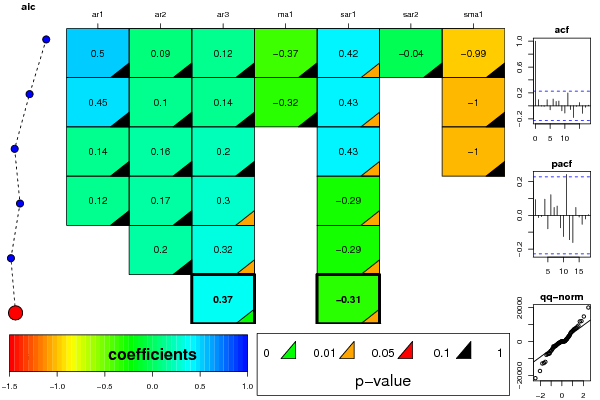
ARIMA Parameter Estimation and Backward Selection
Iterationar1ar2ar3ma1sar1sar2sma1
Estimates ( 1 )0.50460.09190.1206-0.37390.4168-0.0356-0.9932
(p-val)(0.5327 )(0.6426 )(0.6517 )(0.6452 )(0.033 )(0.8744 )(0.5518 )
Estimates ( 2 )0.45410.10060.1417-0.32370.4290-1.0022
(p-val)(0.5213 )(0.5875 )(0.5204 )(0.6511 )(0.0154 )(NA )(0.2576 )
Estimates ( 3 )0.14450.15740.202100.43380-1.0033
(p-val)(0.2551 )(0.2186 )(0.115 )(NA )(0.0138 )(NA )(0.3408 )
Estimates ( 4 )0.11810.17270.29820-0.293900
(p-val)(0.3381 )(0.1641 )(0.0194 )(NA )(0.0264 )(NA )(NA )
Estimates ( 5 )00.19590.32340-0.287500
(p-val)(NA )(0.1113 )(0.01 )(NA )(0.0314 )(NA )(NA )
Estimates ( 6 )000.37070-0.312600
(p-val)(NA )(NA )(0.0032 )(NA )(0.0185 )(NA )(NA )
Estimates ( 7 )NANANANANANANA
(p-val)(NA )(NA )(NA )(NA )(NA )(NA )(NA )
Estimates ( 8 )NANANANANANANA
(p-val)(NA )(NA )(NA )(NA )(NA )(NA )(NA )
Estimates ( 9 )NANANANANANANA
(p-val)(NA )(NA )(NA )(NA )(NA )(NA )(NA )
Estimates ( 10 )NANANANANANANA
(p-val)(NA )(NA )(NA )(NA )(NA )(NA )(NA )
Estimates ( 11 )NANANANANANANA
(p-val)(NA )(NA )(NA )(NA )(NA )(NA )(NA )
Estimates ( 12 )NANANANANANANA
(p-val)(NA )(NA )(NA )(NA )(NA )(NA )(NA )
Estimates ( 13 )NANANANANANANA
(p-val)(NA )(NA )(NA )(NA )(NA )(NA )(NA )

\begin{tabular}{lllllllll}
\hline
ARIMA Parameter Estimation and Backward Selection \tabularnewline
Iteration & ar1 & ar2 & ar3 & ma1 & sar1 & sar2 & sma1 \tabularnewline
Estimates ( 1 ) & 0.5046 & 0.0919 & 0.1206 & -0.3739 & 0.4168 & -0.0356 & -0.9932 \tabularnewline
(p-val) & (0.5327 ) & (0.6426 ) & (0.6517 ) & (0.6452 ) & (0.033 ) & (0.8744 ) & (0.5518 ) \tabularnewline
Estimates ( 2 ) & 0.4541 & 0.1006 & 0.1417 & -0.3237 & 0.429 & 0 & -1.0022 \tabularnewline
(p-val) & (0.5213 ) & (0.5875 ) & (0.5204 ) & (0.6511 ) & (0.0154 ) & (NA ) & (0.2576 ) \tabularnewline
Estimates ( 3 ) & 0.1445 & 0.1574 & 0.2021 & 0 & 0.4338 & 0 & -1.0033 \tabularnewline
(p-val) & (0.2551 ) & (0.2186 ) & (0.115 ) & (NA ) & (0.0138 ) & (NA ) & (0.3408 ) \tabularnewline
Estimates ( 4 ) & 0.1181 & 0.1727 & 0.2982 & 0 & -0.2939 & 0 & 0 \tabularnewline
(p-val) & (0.3381 ) & (0.1641 ) & (0.0194 ) & (NA ) & (0.0264 ) & (NA ) & (NA ) \tabularnewline
Estimates ( 5 ) & 0 & 0.1959 & 0.3234 & 0 & -0.2875 & 0 & 0 \tabularnewline
(p-val) & (NA ) & (0.1113 ) & (0.01 ) & (NA ) & (0.0314 ) & (NA ) & (NA ) \tabularnewline
Estimates ( 6 ) & 0 & 0 & 0.3707 & 0 & -0.3126 & 0 & 0 \tabularnewline
(p-val) & (NA ) & (NA ) & (0.0032 ) & (NA ) & (0.0185 ) & (NA ) & (NA ) \tabularnewline
Estimates ( 7 ) & NA & NA & NA & NA & NA & NA & NA \tabularnewline
(p-val) & (NA ) & (NA ) & (NA ) & (NA ) & (NA ) & (NA ) & (NA ) \tabularnewline
Estimates ( 8 ) & NA & NA & NA & NA & NA & NA & NA \tabularnewline
(p-val) & (NA ) & (NA ) & (NA ) & (NA ) & (NA ) & (NA ) & (NA ) \tabularnewline
Estimates ( 9 ) & NA & NA & NA & NA & NA & NA & NA \tabularnewline
(p-val) & (NA ) & (NA ) & (NA ) & (NA ) & (NA ) & (NA ) & (NA ) \tabularnewline
Estimates ( 10 ) & NA & NA & NA & NA & NA & NA & NA \tabularnewline
(p-val) & (NA ) & (NA ) & (NA ) & (NA ) & (NA ) & (NA ) & (NA ) \tabularnewline
Estimates ( 11 ) & NA & NA & NA & NA & NA & NA & NA \tabularnewline
(p-val) & (NA ) & (NA ) & (NA ) & (NA ) & (NA ) & (NA ) & (NA ) \tabularnewline
Estimates ( 12 ) & NA & NA & NA & NA & NA & NA & NA \tabularnewline
(p-val) & (NA ) & (NA ) & (NA ) & (NA ) & (NA ) & (NA ) & (NA ) \tabularnewline
Estimates ( 13 ) & NA & NA & NA & NA & NA & NA & NA \tabularnewline
(p-val) & (NA ) & (NA ) & (NA ) & (NA ) & (NA ) & (NA ) & (NA ) \tabularnewline
\hline
\end{tabular}
%Source: https://freestatistics.org/blog/index.php?pk=113933&T=1

[TABLE]
[ROW][C]ARIMA Parameter Estimation and Backward Selection[/C][/ROW]
[ROW][C]Iteration[/C][C]ar1[/C][C]ar2[/C][C]ar3[/C][C]ma1[/C][C]sar1[/C][C]sar2[/C][C]sma1[/C][/ROW]
[ROW][C]Estimates ( 1 )[/C][C]0.5046[/C][C]0.0919[/C][C]0.1206[/C][C]-0.3739[/C][C]0.4168[/C][C]-0.0356[/C][C]-0.9932[/C][/ROW]
[ROW][C](p-val)[/C][C](0.5327 )[/C][C](0.6426 )[/C][C](0.6517 )[/C][C](0.6452 )[/C][C](0.033 )[/C][C](0.8744 )[/C][C](0.5518 )[/C][/ROW]
[ROW][C]Estimates ( 2 )[/C][C]0.4541[/C][C]0.1006[/C][C]0.1417[/C][C]-0.3237[/C][C]0.429[/C][C]0[/C][C]-1.0022[/C][/ROW]
[ROW][C](p-val)[/C][C](0.5213 )[/C][C](0.5875 )[/C][C](0.5204 )[/C][C](0.6511 )[/C][C](0.0154 )[/C][C](NA )[/C][C](0.2576 )[/C][/ROW]
[ROW][C]Estimates ( 3 )[/C][C]0.1445[/C][C]0.1574[/C][C]0.2021[/C][C]0[/C][C]0.4338[/C][C]0[/C][C]-1.0033[/C][/ROW]
[ROW][C](p-val)[/C][C](0.2551 )[/C][C](0.2186 )[/C][C](0.115 )[/C][C](NA )[/C][C](0.0138 )[/C][C](NA )[/C][C](0.3408 )[/C][/ROW]
[ROW][C]Estimates ( 4 )[/C][C]0.1181[/C][C]0.1727[/C][C]0.2982[/C][C]0[/C][C]-0.2939[/C][C]0[/C][C]0[/C][/ROW]
[ROW][C](p-val)[/C][C](0.3381 )[/C][C](0.1641 )[/C][C](0.0194 )[/C][C](NA )[/C][C](0.0264 )[/C][C](NA )[/C][C](NA )[/C][/ROW]
[ROW][C]Estimates ( 5 )[/C][C]0[/C][C]0.1959[/C][C]0.3234[/C][C]0[/C][C]-0.2875[/C][C]0[/C][C]0[/C][/ROW]
[ROW][C](p-val)[/C][C](NA )[/C][C](0.1113 )[/C][C](0.01 )[/C][C](NA )[/C][C](0.0314 )[/C][C](NA )[/C][C](NA )[/C][/ROW]
[ROW][C]Estimates ( 6 )[/C][C]0[/C][C]0[/C][C]0.3707[/C][C]0[/C][C]-0.3126[/C][C]0[/C][C]0[/C][/ROW]
[ROW][C](p-val)[/C][C](NA )[/C][C](NA )[/C][C](0.0032 )[/C][C](NA )[/C][C](0.0185 )[/C][C](NA )[/C][C](NA )[/C][/ROW]
[ROW][C]Estimates ( 7 )[/C][C]NA[/C][C]NA[/C][C]NA[/C][C]NA[/C][C]NA[/C][C]NA[/C][C]NA[/C][/ROW]
[ROW][C](p-val)[/C][C](NA )[/C][C](NA )[/C][C](NA )[/C][C](NA )[/C][C](NA )[/C][C](NA )[/C][C](NA )[/C][/ROW]
[ROW][C]Estimates ( 8 )[/C][C]NA[/C][C]NA[/C][C]NA[/C][C]NA[/C][C]NA[/C][C]NA[/C][C]NA[/C][/ROW]
[ROW][C](p-val)[/C][C](NA )[/C][C](NA )[/C][C](NA )[/C][C](NA )[/C][C](NA )[/C][C](NA )[/C][C](NA )[/C][/ROW]
[ROW][C]Estimates ( 9 )[/C][C]NA[/C][C]NA[/C][C]NA[/C][C]NA[/C][C]NA[/C][C]NA[/C][C]NA[/C][/ROW]
[ROW][C](p-val)[/C][C](NA )[/C][C](NA )[/C][C](NA )[/C][C](NA )[/C][C](NA )[/C][C](NA )[/C][C](NA )[/C][/ROW]
[ROW][C]Estimates ( 10 )[/C][C]NA[/C][C]NA[/C][C]NA[/C][C]NA[/C][C]NA[/C][C]NA[/C][C]NA[/C][/ROW]
[ROW][C](p-val)[/C][C](NA )[/C][C](NA )[/C][C](NA )[/C][C](NA )[/C][C](NA )[/C][C](NA )[/C][C](NA )[/C][/ROW]
[ROW][C]Estimates ( 11 )[/C][C]NA[/C][C]NA[/C][C]NA[/C][C]NA[/C][C]NA[/C][C]NA[/C][C]NA[/C][/ROW]
[ROW][C](p-val)[/C][C](NA )[/C][C](NA )[/C][C](NA )[/C][C](NA )[/C][C](NA )[/C][C](NA )[/C][C](NA )[/C][/ROW]
[ROW][C]Estimates ( 12 )[/C][C]NA[/C][C]NA[/C][C]NA[/C][C]NA[/C][C]NA[/C][C]NA[/C][C]NA[/C][/ROW]
[ROW][C](p-val)[/C][C](NA )[/C][C](NA )[/C][C](NA )[/C][C](NA )[/C][C](NA )[/C][C](NA )[/C][C](NA )[/C][/ROW]
[ROW][C]Estimates ( 13 )[/C][C]NA[/C][C]NA[/C][C]NA[/C][C]NA[/C][C]NA[/C][C]NA[/C][C]NA[/C][/ROW]
[ROW][C](p-val)[/C][C](NA )[/C][C](NA )[/C][C](NA )[/C][C](NA )[/C][C](NA )[/C][C](NA )[/C][C](NA )[/C][/ROW]
[/TABLE]
Source: https://freestatistics.org/blog/index.php?pk=113933&T=1

Globally Unique Identifier (entire table): ba.freestatistics.org/blog/index.php?pk=113933&T=1

As an alternative you can also use a QR Code:  

The GUIDs for individual cells are displayed in the table below:

ARIMA Parameter Estimation and Backward Selection
Iterationar1ar2ar3ma1sar1sar2sma1
Estimates ( 1 )0.50460.09190.1206-0.37390.4168-0.0356-0.9932
(p-val)(0.5327 )(0.6426 )(0.6517 )(0.6452 )(0.033 )(0.8744 )(0.5518 )
Estimates ( 2 )0.45410.10060.1417-0.32370.4290-1.0022
(p-val)(0.5213 )(0.5875 )(0.5204 )(0.6511 )(0.0154 )(NA )(0.2576 )
Estimates ( 3 )0.14450.15740.202100.43380-1.0033
(p-val)(0.2551 )(0.2186 )(0.115 )(NA )(0.0138 )(NA )(0.3408 )
Estimates ( 4 )0.11810.17270.29820-0.293900
(p-val)(0.3381 )(0.1641 )(0.0194 )(NA )(0.0264 )(NA )(NA )
Estimates ( 5 )00.19590.32340-0.287500
(p-val)(NA )(0.1113 )(0.01 )(NA )(0.0314 )(NA )(NA )
Estimates ( 6 )000.37070-0.312600
(p-val)(NA )(NA )(0.0032 )(NA )(0.0185 )(NA )(NA )
Estimates ( 7 )NANANANANANANA
(p-val)(NA )(NA )(NA )(NA )(NA )(NA )(NA )
Estimates ( 8 )NANANANANANANA
(p-val)(NA )(NA )(NA )(NA )(NA )(NA )(NA )
Estimates ( 9 )NANANANANANANA
(p-val)(NA )(NA )(NA )(NA )(NA )(NA )(NA )
Estimates ( 10 )NANANANANANANA
(p-val)(NA )(NA )(NA )(NA )(NA )(NA )(NA )
Estimates ( 11 )NANANANANANANA
(p-val)(NA )(NA )(NA )(NA )(NA )(NA )(NA )
Estimates ( 12 )NANANANANANANA
(p-val)(NA )(NA )(NA )(NA )(NA )(NA )(NA )
Estimates ( 13 )NANANANANANANA
(p-val)(NA )(NA )(NA )(NA )(NA )(NA )(NA )


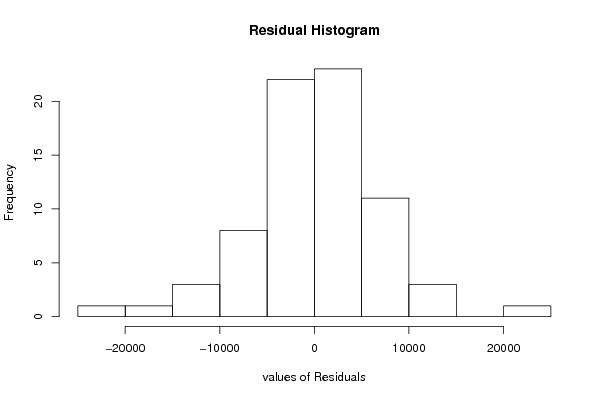
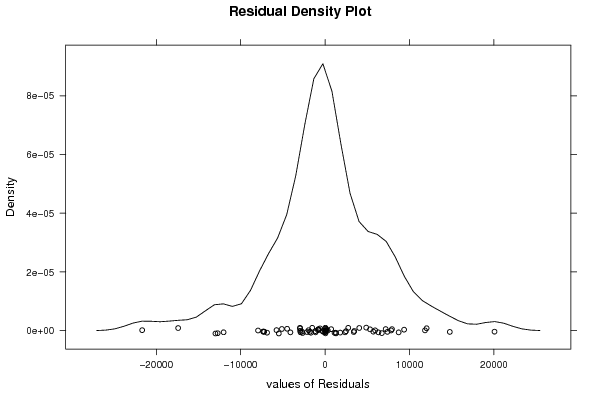
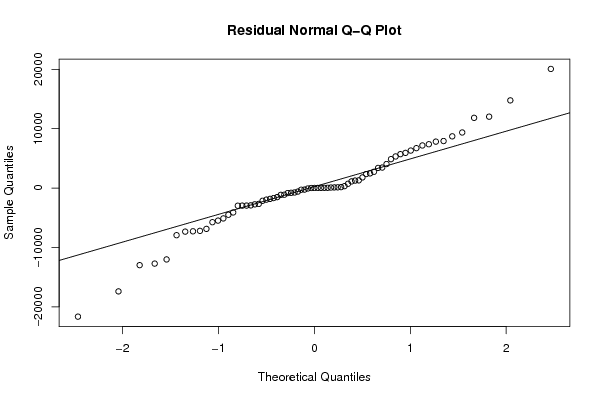
Estimated ARIMA Residuals
Value
-1959.09330295552
-7214.28779823445
-5119.50307042365
-78.5345629993848
-2746.75479138289
7918.37967098959
-2982.32215618039
-806.253413460558
-12729.5807629143
-12992.3548271423
-7346.60230105144
-1129.31825550787
9356.22215566172
-267.453767896026
-4113.61454350777
-847.541091182199
5703.83606143132
3451.18629292079
2739.39698512949
6312.20712498807
-1829.28144591238
11826.0424397939
8708.24560807523
4865.16744271095
4041.35529320192
7171.58860465162
-2917.05079598378
1291.01399011784
-6879.10522197907
-7945.62473618383
20060.9910251624
-1687.19461377546
1786.3748362764
1255.44986296713
6717.42053031163
-751.131766467414
12020.8246558673
5922.6415093453
14765.5911688596
-21667.392361058
-4502.35597308618
5320.10751721207
-2147.23152982919
-17411.1712084721
-601.817206885876
-1149.07183425764
-2958.31762942546
7816.6681898201
-2966.89398322887
-2680.73699765228
-12027.9463257772
-7287.1204085899
2362.31593687854
3385.81981670244
-1526.75233634965
1114.14207549481
7376.42317326687
-5755.63264290833
-5487.43014182463
2470.96226721362
714.007415597301

\begin{tabular}{lllllllll}
\hline
Estimated ARIMA Residuals \tabularnewline
Value \tabularnewline
-1959.09330295552 \tabularnewline
-7214.28779823445 \tabularnewline
-5119.50307042365 \tabularnewline
-78.5345629993848 \tabularnewline
-2746.75479138289 \tabularnewline
7918.37967098959 \tabularnewline
-2982.32215618039 \tabularnewline
-806.253413460558 \tabularnewline
-12729.5807629143 \tabularnewline
-12992.3548271423 \tabularnewline
-7346.60230105144 \tabularnewline
-1129.31825550787 \tabularnewline
9356.22215566172 \tabularnewline
-267.453767896026 \tabularnewline
-4113.61454350777 \tabularnewline
-847.541091182199 \tabularnewline
5703.83606143132 \tabularnewline
3451.18629292079 \tabularnewline
2739.39698512949 \tabularnewline
6312.20712498807 \tabularnewline
-1829.28144591238 \tabularnewline
11826.0424397939 \tabularnewline
8708.24560807523 \tabularnewline
4865.16744271095 \tabularnewline
4041.35529320192 \tabularnewline
7171.58860465162 \tabularnewline
-2917.05079598378 \tabularnewline
1291.01399011784 \tabularnewline
-6879.10522197907 \tabularnewline
-7945.62473618383 \tabularnewline
20060.9910251624 \tabularnewline
-1687.19461377546 \tabularnewline
1786.3748362764 \tabularnewline
1255.44986296713 \tabularnewline
6717.42053031163 \tabularnewline
-751.131766467414 \tabularnewline
12020.8246558673 \tabularnewline
5922.6415093453 \tabularnewline
14765.5911688596 \tabularnewline
-21667.392361058 \tabularnewline
-4502.35597308618 \tabularnewline
5320.10751721207 \tabularnewline
-2147.23152982919 \tabularnewline
-17411.1712084721 \tabularnewline
-601.817206885876 \tabularnewline
-1149.07183425764 \tabularnewline
-2958.31762942546 \tabularnewline
7816.6681898201 \tabularnewline
-2966.89398322887 \tabularnewline
-2680.73699765228 \tabularnewline
-12027.9463257772 \tabularnewline
-7287.1204085899 \tabularnewline
2362.31593687854 \tabularnewline
3385.81981670244 \tabularnewline
-1526.75233634965 \tabularnewline
1114.14207549481 \tabularnewline
7376.42317326687 \tabularnewline
-5755.63264290833 \tabularnewline
-5487.43014182463 \tabularnewline
2470.96226721362 \tabularnewline
714.007415597301 \tabularnewline
\hline
\end{tabular}
%Source: https://freestatistics.org/blog/index.php?pk=113933&T=2

[TABLE]
[ROW][C]Estimated ARIMA Residuals[/C][/ROW]
[ROW][C]Value[/C][/ROW]
[ROW][C]-1959.09330295552[/C][/ROW]
[ROW][C]-7214.28779823445[/C][/ROW]
[ROW][C]-5119.50307042365[/C][/ROW]
[ROW][C]-78.5345629993848[/C][/ROW]
[ROW][C]-2746.75479138289[/C][/ROW]
[ROW][C]7918.37967098959[/C][/ROW]
[ROW][C]-2982.32215618039[/C][/ROW]
[ROW][C]-806.253413460558[/C][/ROW]
[ROW][C]-12729.5807629143[/C][/ROW]
[ROW][C]-12992.3548271423[/C][/ROW]
[ROW][C]-7346.60230105144[/C][/ROW]
[ROW][C]-1129.31825550787[/C][/ROW]
[ROW][C]9356.22215566172[/C][/ROW]
[ROW][C]-267.453767896026[/C][/ROW]
[ROW][C]-4113.61454350777[/C][/ROW]
[ROW][C]-847.541091182199[/C][/ROW]
[ROW][C]5703.83606143132[/C][/ROW]
[ROW][C]3451.18629292079[/C][/ROW]
[ROW][C]2739.39698512949[/C][/ROW]
[ROW][C]6312.20712498807[/C][/ROW]
[ROW][C]-1829.28144591238[/C][/ROW]
[ROW][C]11826.0424397939[/C][/ROW]
[ROW][C]8708.24560807523[/C][/ROW]
[ROW][C]4865.16744271095[/C][/ROW]
[ROW][C]4041.35529320192[/C][/ROW]
[ROW][C]7171.58860465162[/C][/ROW]
[ROW][C]-2917.05079598378[/C][/ROW]
[ROW][C]1291.01399011784[/C][/ROW]
[ROW][C]-6879.10522197907[/C][/ROW]
[ROW][C]-7945.62473618383[/C][/ROW]
[ROW][C]20060.9910251624[/C][/ROW]
[ROW][C]-1687.19461377546[/C][/ROW]
[ROW][C]1786.3748362764[/C][/ROW]
[ROW][C]1255.44986296713[/C][/ROW]
[ROW][C]6717.42053031163[/C][/ROW]
[ROW][C]-751.131766467414[/C][/ROW]
[ROW][C]12020.8246558673[/C][/ROW]
[ROW][C]5922.6415093453[/C][/ROW]
[ROW][C]14765.5911688596[/C][/ROW]
[ROW][C]-21667.392361058[/C][/ROW]
[ROW][C]-4502.35597308618[/C][/ROW]
[ROW][C]5320.10751721207[/C][/ROW]
[ROW][C]-2147.23152982919[/C][/ROW]
[ROW][C]-17411.1712084721[/C][/ROW]
[ROW][C]-601.817206885876[/C][/ROW]
[ROW][C]-1149.07183425764[/C][/ROW]
[ROW][C]-2958.31762942546[/C][/ROW]
[ROW][C]7816.6681898201[/C][/ROW]
[ROW][C]-2966.89398322887[/C][/ROW]
[ROW][C]-2680.73699765228[/C][/ROW]
[ROW][C]-12027.9463257772[/C][/ROW]
[ROW][C]-7287.1204085899[/C][/ROW]
[ROW][C]2362.31593687854[/C][/ROW]
[ROW][C]3385.81981670244[/C][/ROW]
[ROW][C]-1526.75233634965[/C][/ROW]
[ROW][C]1114.14207549481[/C][/ROW]
[ROW][C]7376.42317326687[/C][/ROW]
[ROW][C]-5755.63264290833[/C][/ROW]
[ROW][C]-5487.43014182463[/C][/ROW]
[ROW][C]2470.96226721362[/C][/ROW]
[ROW][C]714.007415597301[/C][/ROW]
[/TABLE]
Source: https://freestatistics.org/blog/index.php?pk=113933&T=2

Globally Unique Identifier (entire table): ba.freestatistics.org/blog/index.php?pk=113933&T=2

As an alternative you can also use a QR Code:  

The GUIDs for individual cells are displayed in the table below:

Estimated ARIMA Residuals
Value
-1959.09330295552
-7214.28779823445
-5119.50307042365
-78.5345629993848
-2746.75479138289
7918.37967098959
-2982.32215618039
-806.253413460558
-12729.5807629143
-12992.3548271423
-7346.60230105144
-1129.31825550787
9356.22215566172
-267.453767896026
-4113.61454350777
-847.541091182199
5703.83606143132
3451.18629292079
2739.39698512949
6312.20712498807
-1829.28144591238
11826.0424397939
8708.24560807523
4865.16744271095
4041.35529320192
7171.58860465162
-2917.05079598378
1291.01399011784
-6879.10522197907
-7945.62473618383
20060.9910251624
-1687.19461377546
1786.3748362764
1255.44986296713
6717.42053031163
-751.131766467414
12020.8246558673
5922.6415093453
14765.5911688596
-21667.392361058
-4502.35597308618
5320.10751721207
-2147.23152982919
-17411.1712084721
-601.817206885876
-1149.07183425764
-2958.31762942546
7816.6681898201
-2966.89398322887
-2680.73699765228
-12027.9463257772
-7287.1204085899
2362.31593687854
3385.81981670244
-1526.75233634965
1114.14207549481
7376.42317326687
-5755.63264290833
-5487.43014182463
2470.96226721362
714.007415597301


Parameters (Session):
par1 = FALSE ; par2 = 1 ; par3 = 1 ; par4 = 1 ; par5 = 12 ; par6 = 3 ; par7 = 1 ; par8 = 2 ; par9 = 1 ;
Parameters (R input):
par1 = FALSE ; par2 = 1 ; par3 = 1 ; par4 = 1 ; par5 = 12 ; par6 = 3 ; par7 = 1 ; par8 = 2 ; par9 = 1 ;
R code (references can be found in the software module):
library(lattice)
if (par1 == 'TRUE') par1 <- TRUE
if (par1 == 'FALSE') par1 <- FALSE
par2 <- as.numeric(par2) #Box-Cox lambda transformation parameter
par3 <- as.numeric(par3) #degree of non-seasonal differencing
par4 <- as.numeric(par4) #degree of seasonal differencing
par5 <- as.numeric(par5) #seasonal period
par6 <- as.numeric(par6) #degree (p) of the non-seasonal AR(p) polynomial
par7 <- as.numeric(par7) #degree (q) of the non-seasonal MA(q) polynomial
par8 <- as.numeric(par8) #degree (P) of the seasonal AR(P) polynomial
par9 <- as.numeric(par9) #degree (Q) of the seasonal MA(Q) polynomial
armaGR <- function(arima.out, names, n){
try1 <- arima.out$coef
try2 <- sqrt(diag(arima.out$var.coef))
try.data.frame <- data.frame(matrix(NA,ncol=4,nrow=length(names)))
dimnames(try.data.frame) <- list(names,c('coef','std','tstat','pv'))
try.data.frame[,1] <- try1
for(i in 1:length(try2)) try.data.frame[which(rownames(try.data.frame)==names(try2)[i]),2] <- try2[i]
try.data.frame[,3] <- try.data.frame[,1] / try.data.frame[,2]
try.data.frame[,4] <- round((1-pt(abs(try.data.frame[,3]),df=n-(length(try2)+1)))*2,5)
vector <- rep(NA,length(names))
vector[is.na(try.data.frame[,4])] <- 0
maxi <- which.max(try.data.frame[,4])
continue <- max(try.data.frame[,4],na.rm=TRUE) > .05
vector[maxi] <- 0
list(summary=try.data.frame,next.vector=vector,continue=continue)
}
arimaSelect <- function(series, order=c(13,0,0), seasonal=list(order=c(2,0,0),period=12), include.mean=F){
nrc <- order[1]+order[3]+seasonal$order[1]+seasonal$order[3]
coeff <- matrix(NA, nrow=nrc*2, ncol=nrc)
pval <- matrix(NA, nrow=nrc*2, ncol=nrc)
mylist <- rep(list(NULL), nrc)
names <- NULL
if(order[1] > 0) names <- paste('ar',1:order[1],sep='')
if(order[3] > 0) names <- c( names , paste('ma',1:order[3],sep='') )
if(seasonal$order[1] > 0) names <- c(names, paste('sar',1:seasonal$order[1],sep=''))
if(seasonal$order[3] > 0) names <- c(names, paste('sma',1:seasonal$order[3],sep=''))
arima.out <- arima(series, order=order, seasonal=seasonal, include.mean=include.mean, method='ML')
mylist[[1]] <- arima.out
last.arma <- armaGR(arima.out, names, length(series))
mystop <- FALSE
i <- 1
coeff[i,] <- last.arma[[1]][,1]
pval [i,] <- last.arma[[1]][,4]
i <- 2
aic <- arima.out$aic
while(!mystop){
mylist[[i]] <- arima.out
arima.out <- arima(series, order=order, seasonal=seasonal, include.mean=include.mean, method='ML', fixed=last.arma$next.vector)
aic <- c(aic, arima.out$aic)
last.arma <- armaGR(arima.out, names, length(series))
mystop <- !last.arma$continue
coeff[i,] <- last.arma[[1]][,1]
pval [i,] <- last.arma[[1]][,4]
i <- i+1
}
list(coeff, pval, mylist, aic=aic)
}
arimaSelectplot <- function(arimaSelect.out,noms,choix){
noms <- names(arimaSelect.out[[3]][[1]]$coef)
coeff <- arimaSelect.out[[1]]
k <- min(which(is.na(coeff[,1])))-1
coeff <- coeff[1:k,]
pval <- arimaSelect.out[[2]][1:k,]
aic <- arimaSelect.out$aic[1:k]
coeff[coeff==0] <- NA
n <- ncol(coeff)
if(missing(choix)) choix <- k
layout(matrix(c(1,1,1,2,
3,3,3,2,
3,3,3,4,
5,6,7,7),nr=4),
widths=c(10,35,45,15),
heights=c(30,30,15,15))
couleurs <- rainbow(75)[1:50]#(50)
ticks <- pretty(coeff)
par(mar=c(1,1,3,1))
plot(aic,k:1-.5,type='o',pch=21,bg='blue',cex=2,axes=F,lty=2,xpd=NA)
points(aic[choix],k-choix+.5,pch=21,cex=4,bg=2,xpd=NA)
title('aic',line=2)
par(mar=c(3,0,0,0))
plot(0,axes=F,xlab='',ylab='',xlim=range(ticks),ylim=c(.1,1))
rect(xleft = min(ticks) + (0:49)/50*(max(ticks)-min(ticks)),
xright = min(ticks) + (1:50)/50*(max(ticks)-min(ticks)),
ytop = rep(1,50),
ybottom= rep(0,50),col=couleurs,border=NA)
axis(1,ticks)
rect(xleft=min(ticks),xright=max(ticks),ytop=1,ybottom=0)
text(mean(coeff,na.rm=T),.5,'coefficients',cex=2,font=2)
par(mar=c(1,1,3,1))
image(1:n,1:k,t(coeff[k:1,]),axes=F,col=couleurs,zlim=range(ticks))
for(i in 1:n) for(j in 1:k) if(!is.na(coeff[j,i])) {
if(pval[j,i]<.01) symb = 'green'
else if( (pval[j,i]<.05) & (pval[j,i]>=.01)) symb = 'orange'
else if( (pval[j,i]<.1) & (pval[j,i]>=.05)) symb = 'red'
else symb = 'black'
polygon(c(i+.5 ,i+.2 ,i+.5 ,i+.5),
c(k-j+0.5,k-j+0.5,k-j+0.8,k-j+0.5),
col=symb)
if(j==choix) {
rect(xleft=i-.5,
xright=i+.5,
ybottom=k-j+1.5,
ytop=k-j+.5,
lwd=4)
text(i,
k-j+1,
round(coeff[j,i],2),
cex=1.2,
font=2)
}
else{
rect(xleft=i-.5,xright=i+.5,ybottom=k-j+1.5,ytop=k-j+.5)
text(i,k-j+1,round(coeff[j,i],2),cex=1.2,font=1)
}
}
axis(3,1:n,noms)
par(mar=c(0.5,0,0,0.5))
plot(0,axes=F,xlab='',ylab='',type='n',xlim=c(0,8),ylim=c(-.2,.8))
cols <- c('green','orange','red','black')
niv <- c('0','0.01','0.05','0.1')
for(i in 0:3){
polygon(c(1+2*i ,1+2*i ,1+2*i-.5 ,1+2*i),
c(.4 ,.7 , .4 , .4),
col=cols[i+1])
text(2*i,0.5,niv[i+1],cex=1.5)
}
text(8,.5,1,cex=1.5)
text(4,0,'p-value',cex=2)
box()
residus <- arimaSelect.out[[3]][[choix]]$res
par(mar=c(1,2,4,1))
acf(residus,main='')
title('acf',line=.5)
par(mar=c(1,2,4,1))
pacf(residus,main='')
title('pacf',line=.5)
par(mar=c(2,2,4,1))
qqnorm(residus,main='')
title('qq-norm',line=.5)
qqline(residus)
residus
}
if (par2 == 0) x <- log(x)
if (par2 != 0) x <- x^par2
(selection <- arimaSelect(x, order=c(par6,par3,par7), seasonal=list(order=c(par8,par4,par9), period=par5)))
bitmap(file='test1.png')
resid <- arimaSelectplot(selection)
dev.off()
resid
bitmap(file='test2.png')
acf(resid,length(resid)/2, main='Residual Autocorrelation Function')
dev.off()
bitmap(file='test3.png')
pacf(resid,length(resid)/2, main='Residual Partial Autocorrelation Function')
dev.off()
bitmap(file='test4.png')
cpgram(resid, main='Residual Cumulative Periodogram')
dev.off()
bitmap(file='test5.png')
hist(resid, main='Residual Histogram', xlab='values of Residuals')
dev.off()
bitmap(file='test6.png')
densityplot(~resid,col='black',main='Residual Density Plot', xlab='values of Residuals')
dev.off()
bitmap(file='test7.png')
qqnorm(resid, main='Residual Normal Q-Q Plot')
qqline(resid)
dev.off()
ncols <- length(selection[[1]][1,])
nrows <- length(selection[[2]][,1])-1
load(file='createtable')
a<-table.start()
a<-table.row.start(a)
a<-table.element(a,'ARIMA Parameter Estimation and Backward Selection', ncols+1,TRUE)
a<-table.row.end(a)
a<-table.row.start(a)
a<-table.element(a,'Iteration', header=TRUE)
for (i in 1:ncols) {
a<-table.element(a,names(selection[[3]][[1]]$coef)[i],header=TRUE)
}
a<-table.row.end(a)
for (j in 1:nrows) {
a<-table.row.start(a)
mydum <- 'Estimates ('
mydum <- paste(mydum,j)
mydum <- paste(mydum,')')
a<-table.element(a,mydum, header=TRUE)
for (i in 1:ncols) {
a<-table.element(a,round(selection[[1]][j,i],4))
}
a<-table.row.end(a)
a<-table.row.start(a)
a<-table.element(a,'(p-val)', header=TRUE)
for (i in 1:ncols) {
mydum <- '('
mydum <- paste(mydum,round(selection[[2]][j,i],4),sep='')
mydum <- paste(mydum,')')
a<-table.element(a,mydum)
}
a<-table.row.end(a)
}
a<-table.end(a)
table.save(a,file='mytable.tab')
a<-table.start()
a<-table.row.start(a)
a<-table.element(a,'Estimated ARIMA Residuals', 1,TRUE)
a<-table.row.end(a)
a<-table.row.start(a)
a<-table.element(a,'Value', 1,TRUE)
a<-table.row.end(a)
for (i in (par4*par5+par3):length(resid)) {
a<-table.row.start(a)
a<-table.element(a,resid[i])
a<-table.row.end(a)
}
a<-table.end(a)
table.save(a,file='mytable1.tab')