Free Statistics

of Irreproducible Research!

Author's title

Author*The author of this computation has been verified*
R Software Modulerwasp_multipleregression.wasp
Title produced by softwareMultiple Regression
Date of computationMon, 27 Dec 2010 13:24:06 +0000
Cite this page as followsStatistical Computations at FreeStatistics.org, Office for Research Development and Education, URL https://freestatistics.org/blog/index.php?v=date/2010/Dec/27/t1293456147stg9r0g6muxqxk3.htm/, Retrieved Fri, 03 May 2024 07:42:07 +0000
Statistical Computations at FreeStatistics.org, Office for Research Development and Education, URL https://freestatistics.org/blog/index.php?pk=115959, Retrieved Fri, 03 May 2024 07:42:07 +0000
QR Codes:

Original text written by user:
IsPrivate?No (this computation is public)
User-defined keywords
Estimated Impact152
Family? (F = Feedback message, R = changed R code, M = changed R Module, P = changed Parameters, D = changed Data)
-     [Multiple Regression] [Q1 The Seatbeltlaw] [2007-11-14 19:27:43] [8cd6641b921d30ebe00b648d1481bba0]
- RM D  [Multiple Regression] [Seatbelt] [2009-11-12 14:06:21] [b98453cac15ba1066b407e146608df68]
- R PD    [Multiple Regression] [] [2009-11-19 08:06:13] [639dd97b6eeebe46a3c92d62cb04fb95]
-   PD      [Multiple Regression] [Multiple regressi...] [2010-12-25 20:21:24] [1ec36cc0fd92fd0f07d0b885ce2c369b]
-    D          [Multiple Regression] [] [2010-12-27 13:24:06] [d42b17bf3b3c0d56878eb3f5a4351e6d] [Current]
Feedback Forum

Post a new message
Dataseries X:
493	797
514	840
522	988
490	819
484	831
506	904
501	814
462	798
465	828
454	789
464	930
427	744
460	832
473	826
465	907
422	776
415	835
413	715
420	729
363	733
376	736
380	712
384	711
346	667
389	799
407	661
393	692
346	649
348	729
353	622
364	671
305	635
307	648
312	745
312	624
286	477
324	710
336	515
327	461
302	590
299	415
311	554
315	585
264	513
278	591
278	561
287	684
279	668
324	795
354	776
354	1 043
360	964
363	762
385	1 030
412	939
370	779
389	918
395	839
417	874
404	840


Summary of computational transaction
Raw Inputview raw input (R code)
Raw Outputview raw output of R engine
Computing time5 seconds
R Server'Sir Ronald Aylmer Fisher' @ 193.190.124.24

\begin{tabular}{lllllllll}
\hline
Summary of computational transaction \tabularnewline
Raw Input & view raw input (R code)  \tabularnewline
Raw Output & view raw output of R engine  \tabularnewline
Computing time & 5 seconds \tabularnewline
R Server & 'Sir Ronald Aylmer Fisher' @ 193.190.124.24 \tabularnewline
\hline
\end{tabular}
%Source: https://freestatistics.org/blog/index.php?pk=115959&T=0

[TABLE]
[ROW][C]Summary of computational transaction[/C][/ROW]
[ROW][C]Raw Input[/C][C]view raw input (R code) [/C][/ROW]
[ROW][C]Raw Output[/C][C]view raw output of R engine [/C][/ROW]
[ROW][C]Computing time[/C][C]5 seconds[/C][/ROW]
[ROW][C]R Server[/C][C]'Sir Ronald Aylmer Fisher' @ 193.190.124.24[/C][/ROW]
[/TABLE]
Source: https://freestatistics.org/blog/index.php?pk=115959&T=0

Globally Unique Identifier (entire table): ba.freestatistics.org/blog/index.php?pk=115959&T=0

As an alternative you can also use a QR Code:  

The GUIDs for individual cells are displayed in the table below:

Summary of computational transaction
Raw Inputview raw input (R code)
Raw Outputview raw output of R engine
Computing time5 seconds
R Server'Sir Ronald Aylmer Fisher' @ 193.190.124.24


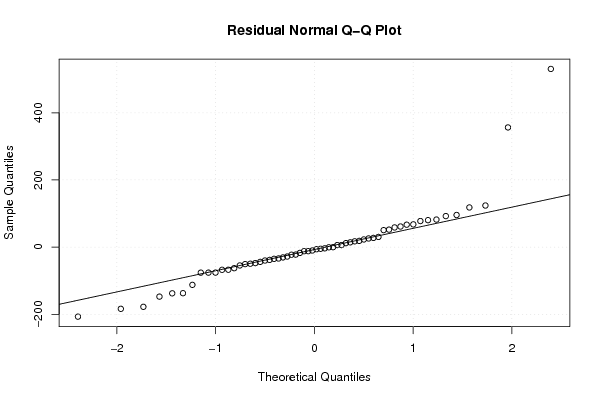
Multiple Linear Regression - Estimated Regression Equation
WLH[t] = + 177.639763836283 + 0.252711714524369Faill[t] + 21.5772015188484M1[t] + 56.2980395338837M2[t] + 80.456632646757M3[t] -18.4720070744498M4[t] + 163.989382126553M5[t] + 130.635585726218M6[t] -0.424051914170813M7[t] + 0.69803953388371M8[t] + 0.517563878459179M9[t] -3.30999115693777M10[t] -0.694158759944824M11[t] + e[t]

\begin{tabular}{lllllllll}
\hline
Multiple Linear Regression - Estimated Regression Equation \tabularnewline
WLH[t] =  +  177.639763836283 +  0.252711714524369Faill[t] +  21.5772015188484M1[t] +  56.2980395338837M2[t] +  80.456632646757M3[t] -18.4720070744498M4[t] +  163.989382126553M5[t] +  130.635585726218M6[t] -0.424051914170813M7[t] +  0.69803953388371M8[t] +  0.517563878459179M9[t] -3.30999115693777M10[t] -0.694158759944824M11[t]  + e[t] \tabularnewline
\hline
\end{tabular}
%Source: https://freestatistics.org/blog/index.php?pk=115959&T=1

[TABLE]
[ROW][C]Multiple Linear Regression - Estimated Regression Equation[/C][/ROW]
[ROW][C]WLH[t] =  +  177.639763836283 +  0.252711714524369Faill[t] +  21.5772015188484M1[t] +  56.2980395338837M2[t] +  80.456632646757M3[t] -18.4720070744498M4[t] +  163.989382126553M5[t] +  130.635585726218M6[t] -0.424051914170813M7[t] +  0.69803953388371M8[t] +  0.517563878459179M9[t] -3.30999115693777M10[t] -0.694158759944824M11[t]  + e[t][/C][/ROW]
[/TABLE]
Source: https://freestatistics.org/blog/index.php?pk=115959&T=1

Globally Unique Identifier (entire table): ba.freestatistics.org/blog/index.php?pk=115959&T=1

As an alternative you can also use a QR Code:  

The GUIDs for individual cells are displayed in the table below:

Multiple Linear Regression - Estimated Regression Equation
WLH[t] = + 177.639763836283 + 0.252711714524369Faill[t] + 21.5772015188484M1[t] + 56.2980395338837M2[t] + 80.456632646757M3[t] -18.4720070744498M4[t] + 163.989382126553M5[t] + 130.635585726218M6[t] -0.424051914170813M7[t] + 0.69803953388371M8[t] + 0.517563878459179M9[t] -3.30999115693777M10[t] -0.694158759944824M11[t] + e[t]


Multiple Linear Regression - Ordinary Least Squares
VariableParameterS.D.T-STATH0: parameter = 02-tail p-value1-tail p-value
(Intercept)177.63976383628383.009792.140.0375770.018789
Faill0.2527117145243690.0895612.82170.0069790.00349
M121.577201518848479.4543890.27160.7871440.393572
M256.298039533883779.0136890.71250.4796710.239836
M380.45663264675779.2363391.01540.3151140.157557
M4-18.472007074449879.054999-0.23370.8162640.408132
M5163.98938212655379.0760052.07380.04360.0218
M6130.63558572621879.0688051.65220.1051650.052582
M7-0.42405191417081379.672535-0.00530.9957760.497888
M80.6980395338837179.0136890.00880.9929890.496494
M90.51756387845917978.9888340.00660.99480.4974
M10-3.3099911569377779.118548-0.04180.9668070.483403
M11-0.69415875994482479.201919-0.00880.9930440.496522

\begin{tabular}{lllllllll}
\hline
Multiple Linear Regression - Ordinary Least Squares \tabularnewline
Variable & Parameter & S.D. & T-STATH0: parameter = 0 & 2-tail p-value & 1-tail p-value \tabularnewline
(Intercept) & 177.639763836283 & 83.00979 & 2.14 & 0.037577 & 0.018789 \tabularnewline
Faill & 0.252711714524369 & 0.089561 & 2.8217 & 0.006979 & 0.00349 \tabularnewline
M1 & 21.5772015188484 & 79.454389 & 0.2716 & 0.787144 & 0.393572 \tabularnewline
M2 & 56.2980395338837 & 79.013689 & 0.7125 & 0.479671 & 0.239836 \tabularnewline
M3 & 80.456632646757 & 79.236339 & 1.0154 & 0.315114 & 0.157557 \tabularnewline
M4 & -18.4720070744498 & 79.054999 & -0.2337 & 0.816264 & 0.408132 \tabularnewline
M5 & 163.989382126553 & 79.076005 & 2.0738 & 0.0436 & 0.0218 \tabularnewline
M6 & 130.635585726218 & 79.068805 & 1.6522 & 0.105165 & 0.052582 \tabularnewline
M7 & -0.424051914170813 & 79.672535 & -0.0053 & 0.995776 & 0.497888 \tabularnewline
M8 & 0.69803953388371 & 79.013689 & 0.0088 & 0.992989 & 0.496494 \tabularnewline
M9 & 0.517563878459179 & 78.988834 & 0.0066 & 0.9948 & 0.4974 \tabularnewline
M10 & -3.30999115693777 & 79.118548 & -0.0418 & 0.966807 & 0.483403 \tabularnewline
M11 & -0.694158759944824 & 79.201919 & -0.0088 & 0.993044 & 0.496522 \tabularnewline
\hline
\end{tabular}
%Source: https://freestatistics.org/blog/index.php?pk=115959&T=2

[TABLE]
[ROW][C]Multiple Linear Regression - Ordinary Least Squares[/C][/ROW]
[ROW][C]Variable[/C][C]Parameter[/C][C]S.D.[/C][C]T-STATH0: parameter = 0[/C][C]2-tail p-value[/C][C]1-tail p-value[/C][/ROW]
[ROW][C](Intercept)[/C][C]177.639763836283[/C][C]83.00979[/C][C]2.14[/C][C]0.037577[/C][C]0.018789[/C][/ROW]
[ROW][C]Faill[/C][C]0.252711714524369[/C][C]0.089561[/C][C]2.8217[/C][C]0.006979[/C][C]0.00349[/C][/ROW]
[ROW][C]M1[/C][C]21.5772015188484[/C][C]79.454389[/C][C]0.2716[/C][C]0.787144[/C][C]0.393572[/C][/ROW]
[ROW][C]M2[/C][C]56.2980395338837[/C][C]79.013689[/C][C]0.7125[/C][C]0.479671[/C][C]0.239836[/C][/ROW]
[ROW][C]M3[/C][C]80.456632646757[/C][C]79.236339[/C][C]1.0154[/C][C]0.315114[/C][C]0.157557[/C][/ROW]
[ROW][C]M4[/C][C]-18.4720070744498[/C][C]79.054999[/C][C]-0.2337[/C][C]0.816264[/C][C]0.408132[/C][/ROW]
[ROW][C]M5[/C][C]163.989382126553[/C][C]79.076005[/C][C]2.0738[/C][C]0.0436[/C][C]0.0218[/C][/ROW]
[ROW][C]M6[/C][C]130.635585726218[/C][C]79.068805[/C][C]1.6522[/C][C]0.105165[/C][C]0.052582[/C][/ROW]
[ROW][C]M7[/C][C]-0.424051914170813[/C][C]79.672535[/C][C]-0.0053[/C][C]0.995776[/C][C]0.497888[/C][/ROW]
[ROW][C]M8[/C][C]0.69803953388371[/C][C]79.013689[/C][C]0.0088[/C][C]0.992989[/C][C]0.496494[/C][/ROW]
[ROW][C]M9[/C][C]0.517563878459179[/C][C]78.988834[/C][C]0.0066[/C][C]0.9948[/C][C]0.4974[/C][/ROW]
[ROW][C]M10[/C][C]-3.30999115693777[/C][C]79.118548[/C][C]-0.0418[/C][C]0.966807[/C][C]0.483403[/C][/ROW]
[ROW][C]M11[/C][C]-0.694158759944824[/C][C]79.201919[/C][C]-0.0088[/C][C]0.993044[/C][C]0.496522[/C][/ROW]
[/TABLE]
Source: https://freestatistics.org/blog/index.php?pk=115959&T=2

Globally Unique Identifier (entire table): ba.freestatistics.org/blog/index.php?pk=115959&T=2

As an alternative you can also use a QR Code:  

The GUIDs for individual cells are displayed in the table below:

Multiple Linear Regression - Ordinary Least Squares
VariableParameterS.D.T-STATH0: parameter = 02-tail p-value1-tail p-value
(Intercept)177.63976383628383.009792.140.0375770.018789
Faill0.2527117145243690.0895612.82170.0069790.00349
M121.577201518848479.4543890.27160.7871440.393572
M256.298039533883779.0136890.71250.4796710.239836
M380.45663264675779.2363391.01540.3151140.157557
M4-18.472007074449879.054999-0.23370.8162640.408132
M5163.98938212655379.0760052.07380.04360.0218
M6130.63558572621879.0688051.65220.1051650.052582
M7-0.42405191417081379.672535-0.00530.9957760.497888
M80.6980395338837179.0136890.00880.9929890.496494
M90.51756387845917978.9888340.00660.99480.4974
M10-3.3099911569377779.118548-0.04180.9668070.483403
M11-0.69415875994482479.201919-0.00880.9930440.496522


Multiple Linear Regression - Regression Statistics
Multiple R0.535720737207058
R-squared0.286996708273673
Adjusted R-squared0.104953314641420
F-TEST (value)1.57652910411809
F-TEST (DF numerator)12
F-TEST (DF denominator)47
p-value0.131590032998452
Multiple Linear Regression - Residual Statistics
Residual Standard Deviation124.818098916034
Sum Squared Residuals732239.2173996

\begin{tabular}{lllllllll}
\hline
Multiple Linear Regression - Regression Statistics \tabularnewline
Multiple R & 0.535720737207058 \tabularnewline
R-squared & 0.286996708273673 \tabularnewline
Adjusted R-squared & 0.104953314641420 \tabularnewline
F-TEST (value) & 1.57652910411809 \tabularnewline
F-TEST (DF numerator) & 12 \tabularnewline
F-TEST (DF denominator) & 47 \tabularnewline
p-value & 0.131590032998452 \tabularnewline
Multiple Linear Regression - Residual Statistics \tabularnewline
Residual Standard Deviation & 124.818098916034 \tabularnewline
Sum Squared Residuals & 732239.2173996 \tabularnewline
\hline
\end{tabular}
%Source: https://freestatistics.org/blog/index.php?pk=115959&T=3

[TABLE]
[ROW][C]Multiple Linear Regression - Regression Statistics[/C][/ROW]
[ROW][C]Multiple R[/C][C]0.535720737207058[/C][/ROW]
[ROW][C]R-squared[/C][C]0.286996708273673[/C][/ROW]
[ROW][C]Adjusted R-squared[/C][C]0.104953314641420[/C][/ROW]
[ROW][C]F-TEST (value)[/C][C]1.57652910411809[/C][/ROW]
[ROW][C]F-TEST (DF numerator)[/C][C]12[/C][/ROW]
[ROW][C]F-TEST (DF denominator)[/C][C]47[/C][/ROW]
[ROW][C]p-value[/C][C]0.131590032998452[/C][/ROW]
[ROW][C]Multiple Linear Regression - Residual Statistics[/C][/ROW]
[ROW][C]Residual Standard Deviation[/C][C]124.818098916034[/C][/ROW]
[ROW][C]Sum Squared Residuals[/C][C]732239.2173996[/C][/ROW]
[/TABLE]
Source: https://freestatistics.org/blog/index.php?pk=115959&T=3

Globally Unique Identifier (entire table): ba.freestatistics.org/blog/index.php?pk=115959&T=3

As an alternative you can also use a QR Code:  

The GUIDs for individual cells are displayed in the table below:

Multiple Linear Regression - Regression Statistics
Multiple R0.535720737207058
R-squared0.286996708273673
Adjusted R-squared0.104953314641420
F-TEST (value)1.57652910411809
F-TEST (DF numerator)12
F-TEST (DF denominator)47
p-value0.131590032998452
Multiple Linear Regression - Residual Statistics
Residual Standard Deviation124.818098916034
Sum Squared Residuals732239.2173996


Multiple Linear Regression - Actuals, Interpolation, and Residuals
Time or IndexActualsInterpolationForecastResidualsPrediction Error
1493400.62820183105492.3717981689464
2514446.21564357063767.7843564293634
3522507.77557043311614.2244295668836
4490366.138650957291123.861349042709
5484551.632580732586-67.6325807325862
6506536.726739492531-30.7267394925310
7501382.923047544948118.076952455052
8462380.00175156061381.9982484393869
9465387.40262734092077.5973726590804
10454373.71931543907280.2806845609278
11464411.96749958400152.0325004159988
12427365.65727944241361.3427205575866
13460409.47311183940650.5268881605937
14473442.67767956729530.3223204327046
15465487.305921556643-22.3059215566425
16422355.27204723274366.7279527672565
17415552.643427590684-137.643427590684
18413488.964225447425-75.9642254474251
19420361.44255181037758.557448189623
20363363.575490116529-0.575490116529059
21376364.15314960467811.8468503953224
22380354.26051342069625.7394865793042
23384356.62363410316427.3763658968356
24346346.198477424037-0.198477424036972
25389401.133625260102-12.1336252601021
26407400.9802466707746.01975332922552
27393432.972902933903-39.9729029339031
28346323.17765948814922.8223405118514
29348525.8559858511-177.855985851100
30353465.462035996659-112.462035996659
31364346.78527236796417.2147276320364
32305338.809742093141-33.8097420931409
33307341.914518726533-34.9145187265332
34312362.6-50.6
35312334.637714939544-22.6377149395443
36286298.183251664407-12.1832516644068
37324378.642282667433-54.6422826674333
38336364.084336350217-28.0843363502166
39327374.596496878774-47.5964968787739
40302308.267668331211-6.26766833121078
41299446.504507490449-147.504507490449
42311448.277639409002-137.277639409002
43315325.052064918868-10.0520649188679
44264307.978912921168-43.9789129211678
45278327.509950998644-49.5099509986441
46278316.101044527516-38.1010445275160
47287349.800417811006-62.8004178110064
48279346.451189138561-67.4511891385614
49324400.122778402005-76.1227784020046
50354430.042093841077-76.042093841077
51354258.34910819756495.650891802436
5243250.143973990606-207.143973990606
53964433.363498335181530.636501664819
54762405.569359654383356.430640345617
551184.797063357843-183.797063357843
56412415.634103308549-3.63410330854913
57370375.019753329226-5.01975332922552
58389406.319126612716-17.3191266127159
59395388.9707335622846.02926643771635
60417398.50980233058118.4901976694186

\begin{tabular}{lllllllll}
\hline
Multiple Linear Regression - Actuals, Interpolation, and Residuals \tabularnewline
Time or Index & Actuals & InterpolationForecast & ResidualsPrediction Error \tabularnewline
1 & 493 & 400.628201831054 & 92.3717981689464 \tabularnewline
2 & 514 & 446.215643570637 & 67.7843564293634 \tabularnewline
3 & 522 & 507.775570433116 & 14.2244295668836 \tabularnewline
4 & 490 & 366.138650957291 & 123.861349042709 \tabularnewline
5 & 484 & 551.632580732586 & -67.6325807325862 \tabularnewline
6 & 506 & 536.726739492531 & -30.7267394925310 \tabularnewline
7 & 501 & 382.923047544948 & 118.076952455052 \tabularnewline
8 & 462 & 380.001751560613 & 81.9982484393869 \tabularnewline
9 & 465 & 387.402627340920 & 77.5973726590804 \tabularnewline
10 & 454 & 373.719315439072 & 80.2806845609278 \tabularnewline
11 & 464 & 411.967499584001 & 52.0325004159988 \tabularnewline
12 & 427 & 365.657279442413 & 61.3427205575866 \tabularnewline
13 & 460 & 409.473111839406 & 50.5268881605937 \tabularnewline
14 & 473 & 442.677679567295 & 30.3223204327046 \tabularnewline
15 & 465 & 487.305921556643 & -22.3059215566425 \tabularnewline
16 & 422 & 355.272047232743 & 66.7279527672565 \tabularnewline
17 & 415 & 552.643427590684 & -137.643427590684 \tabularnewline
18 & 413 & 488.964225447425 & -75.9642254474251 \tabularnewline
19 & 420 & 361.442551810377 & 58.557448189623 \tabularnewline
20 & 363 & 363.575490116529 & -0.575490116529059 \tabularnewline
21 & 376 & 364.153149604678 & 11.8468503953224 \tabularnewline
22 & 380 & 354.260513420696 & 25.7394865793042 \tabularnewline
23 & 384 & 356.623634103164 & 27.3763658968356 \tabularnewline
24 & 346 & 346.198477424037 & -0.198477424036972 \tabularnewline
25 & 389 & 401.133625260102 & -12.1336252601021 \tabularnewline
26 & 407 & 400.980246670774 & 6.01975332922552 \tabularnewline
27 & 393 & 432.972902933903 & -39.9729029339031 \tabularnewline
28 & 346 & 323.177659488149 & 22.8223405118514 \tabularnewline
29 & 348 & 525.8559858511 & -177.855985851100 \tabularnewline
30 & 353 & 465.462035996659 & -112.462035996659 \tabularnewline
31 & 364 & 346.785272367964 & 17.2147276320364 \tabularnewline
32 & 305 & 338.809742093141 & -33.8097420931409 \tabularnewline
33 & 307 & 341.914518726533 & -34.9145187265332 \tabularnewline
34 & 312 & 362.6 & -50.6 \tabularnewline
35 & 312 & 334.637714939544 & -22.6377149395443 \tabularnewline
36 & 286 & 298.183251664407 & -12.1832516644068 \tabularnewline
37 & 324 & 378.642282667433 & -54.6422826674333 \tabularnewline
38 & 336 & 364.084336350217 & -28.0843363502166 \tabularnewline
39 & 327 & 374.596496878774 & -47.5964968787739 \tabularnewline
40 & 302 & 308.267668331211 & -6.26766833121078 \tabularnewline
41 & 299 & 446.504507490449 & -147.504507490449 \tabularnewline
42 & 311 & 448.277639409002 & -137.277639409002 \tabularnewline
43 & 315 & 325.052064918868 & -10.0520649188679 \tabularnewline
44 & 264 & 307.978912921168 & -43.9789129211678 \tabularnewline
45 & 278 & 327.509950998644 & -49.5099509986441 \tabularnewline
46 & 278 & 316.101044527516 & -38.1010445275160 \tabularnewline
47 & 287 & 349.800417811006 & -62.8004178110064 \tabularnewline
48 & 279 & 346.451189138561 & -67.4511891385614 \tabularnewline
49 & 324 & 400.122778402005 & -76.1227784020046 \tabularnewline
50 & 354 & 430.042093841077 & -76.042093841077 \tabularnewline
51 & 354 & 258.349108197564 & 95.650891802436 \tabularnewline
52 & 43 & 250.143973990606 & -207.143973990606 \tabularnewline
53 & 964 & 433.363498335181 & 530.636501664819 \tabularnewline
54 & 762 & 405.569359654383 & 356.430640345617 \tabularnewline
55 & 1 & 184.797063357843 & -183.797063357843 \tabularnewline
56 & 412 & 415.634103308549 & -3.63410330854913 \tabularnewline
57 & 370 & 375.019753329226 & -5.01975332922552 \tabularnewline
58 & 389 & 406.319126612716 & -17.3191266127159 \tabularnewline
59 & 395 & 388.970733562284 & 6.02926643771635 \tabularnewline
60 & 417 & 398.509802330581 & 18.4901976694186 \tabularnewline
\hline
\end{tabular}
%Source: https://freestatistics.org/blog/index.php?pk=115959&T=4

[TABLE]
[ROW][C]Multiple Linear Regression - Actuals, Interpolation, and Residuals[/C][/ROW]
[ROW][C]Time or Index[/C][C]Actuals[/C][C]InterpolationForecast[/C][C]ResidualsPrediction Error[/C][/ROW]
[ROW][C]1[/C][C]493[/C][C]400.628201831054[/C][C]92.3717981689464[/C][/ROW]
[ROW][C]2[/C][C]514[/C][C]446.215643570637[/C][C]67.7843564293634[/C][/ROW]
[ROW][C]3[/C][C]522[/C][C]507.775570433116[/C][C]14.2244295668836[/C][/ROW]
[ROW][C]4[/C][C]490[/C][C]366.138650957291[/C][C]123.861349042709[/C][/ROW]
[ROW][C]5[/C][C]484[/C][C]551.632580732586[/C][C]-67.6325807325862[/C][/ROW]
[ROW][C]6[/C][C]506[/C][C]536.726739492531[/C][C]-30.7267394925310[/C][/ROW]
[ROW][C]7[/C][C]501[/C][C]382.923047544948[/C][C]118.076952455052[/C][/ROW]
[ROW][C]8[/C][C]462[/C][C]380.001751560613[/C][C]81.9982484393869[/C][/ROW]
[ROW][C]9[/C][C]465[/C][C]387.402627340920[/C][C]77.5973726590804[/C][/ROW]
[ROW][C]10[/C][C]454[/C][C]373.719315439072[/C][C]80.2806845609278[/C][/ROW]
[ROW][C]11[/C][C]464[/C][C]411.967499584001[/C][C]52.0325004159988[/C][/ROW]
[ROW][C]12[/C][C]427[/C][C]365.657279442413[/C][C]61.3427205575866[/C][/ROW]
[ROW][C]13[/C][C]460[/C][C]409.473111839406[/C][C]50.5268881605937[/C][/ROW]
[ROW][C]14[/C][C]473[/C][C]442.677679567295[/C][C]30.3223204327046[/C][/ROW]
[ROW][C]15[/C][C]465[/C][C]487.305921556643[/C][C]-22.3059215566425[/C][/ROW]
[ROW][C]16[/C][C]422[/C][C]355.272047232743[/C][C]66.7279527672565[/C][/ROW]
[ROW][C]17[/C][C]415[/C][C]552.643427590684[/C][C]-137.643427590684[/C][/ROW]
[ROW][C]18[/C][C]413[/C][C]488.964225447425[/C][C]-75.9642254474251[/C][/ROW]
[ROW][C]19[/C][C]420[/C][C]361.442551810377[/C][C]58.557448189623[/C][/ROW]
[ROW][C]20[/C][C]363[/C][C]363.575490116529[/C][C]-0.575490116529059[/C][/ROW]
[ROW][C]21[/C][C]376[/C][C]364.153149604678[/C][C]11.8468503953224[/C][/ROW]
[ROW][C]22[/C][C]380[/C][C]354.260513420696[/C][C]25.7394865793042[/C][/ROW]
[ROW][C]23[/C][C]384[/C][C]356.623634103164[/C][C]27.3763658968356[/C][/ROW]
[ROW][C]24[/C][C]346[/C][C]346.198477424037[/C][C]-0.198477424036972[/C][/ROW]
[ROW][C]25[/C][C]389[/C][C]401.133625260102[/C][C]-12.1336252601021[/C][/ROW]
[ROW][C]26[/C][C]407[/C][C]400.980246670774[/C][C]6.01975332922552[/C][/ROW]
[ROW][C]27[/C][C]393[/C][C]432.972902933903[/C][C]-39.9729029339031[/C][/ROW]
[ROW][C]28[/C][C]346[/C][C]323.177659488149[/C][C]22.8223405118514[/C][/ROW]
[ROW][C]29[/C][C]348[/C][C]525.8559858511[/C][C]-177.855985851100[/C][/ROW]
[ROW][C]30[/C][C]353[/C][C]465.462035996659[/C][C]-112.462035996659[/C][/ROW]
[ROW][C]31[/C][C]364[/C][C]346.785272367964[/C][C]17.2147276320364[/C][/ROW]
[ROW][C]32[/C][C]305[/C][C]338.809742093141[/C][C]-33.8097420931409[/C][/ROW]
[ROW][C]33[/C][C]307[/C][C]341.914518726533[/C][C]-34.9145187265332[/C][/ROW]
[ROW][C]34[/C][C]312[/C][C]362.6[/C][C]-50.6[/C][/ROW]
[ROW][C]35[/C][C]312[/C][C]334.637714939544[/C][C]-22.6377149395443[/C][/ROW]
[ROW][C]36[/C][C]286[/C][C]298.183251664407[/C][C]-12.1832516644068[/C][/ROW]
[ROW][C]37[/C][C]324[/C][C]378.642282667433[/C][C]-54.6422826674333[/C][/ROW]
[ROW][C]38[/C][C]336[/C][C]364.084336350217[/C][C]-28.0843363502166[/C][/ROW]
[ROW][C]39[/C][C]327[/C][C]374.596496878774[/C][C]-47.5964968787739[/C][/ROW]
[ROW][C]40[/C][C]302[/C][C]308.267668331211[/C][C]-6.26766833121078[/C][/ROW]
[ROW][C]41[/C][C]299[/C][C]446.504507490449[/C][C]-147.504507490449[/C][/ROW]
[ROW][C]42[/C][C]311[/C][C]448.277639409002[/C][C]-137.277639409002[/C][/ROW]
[ROW][C]43[/C][C]315[/C][C]325.052064918868[/C][C]-10.0520649188679[/C][/ROW]
[ROW][C]44[/C][C]264[/C][C]307.978912921168[/C][C]-43.9789129211678[/C][/ROW]
[ROW][C]45[/C][C]278[/C][C]327.509950998644[/C][C]-49.5099509986441[/C][/ROW]
[ROW][C]46[/C][C]278[/C][C]316.101044527516[/C][C]-38.1010445275160[/C][/ROW]
[ROW][C]47[/C][C]287[/C][C]349.800417811006[/C][C]-62.8004178110064[/C][/ROW]
[ROW][C]48[/C][C]279[/C][C]346.451189138561[/C][C]-67.4511891385614[/C][/ROW]
[ROW][C]49[/C][C]324[/C][C]400.122778402005[/C][C]-76.1227784020046[/C][/ROW]
[ROW][C]50[/C][C]354[/C][C]430.042093841077[/C][C]-76.042093841077[/C][/ROW]
[ROW][C]51[/C][C]354[/C][C]258.349108197564[/C][C]95.650891802436[/C][/ROW]
[ROW][C]52[/C][C]43[/C][C]250.143973990606[/C][C]-207.143973990606[/C][/ROW]
[ROW][C]53[/C][C]964[/C][C]433.363498335181[/C][C]530.636501664819[/C][/ROW]
[ROW][C]54[/C][C]762[/C][C]405.569359654383[/C][C]356.430640345617[/C][/ROW]
[ROW][C]55[/C][C]1[/C][C]184.797063357843[/C][C]-183.797063357843[/C][/ROW]
[ROW][C]56[/C][C]412[/C][C]415.634103308549[/C][C]-3.63410330854913[/C][/ROW]
[ROW][C]57[/C][C]370[/C][C]375.019753329226[/C][C]-5.01975332922552[/C][/ROW]
[ROW][C]58[/C][C]389[/C][C]406.319126612716[/C][C]-17.3191266127159[/C][/ROW]
[ROW][C]59[/C][C]395[/C][C]388.970733562284[/C][C]6.02926643771635[/C][/ROW]
[ROW][C]60[/C][C]417[/C][C]398.509802330581[/C][C]18.4901976694186[/C][/ROW]
[/TABLE]
Source: https://freestatistics.org/blog/index.php?pk=115959&T=4

Globally Unique Identifier (entire table): ba.freestatistics.org/blog/index.php?pk=115959&T=4

As an alternative you can also use a QR Code:  

The GUIDs for individual cells are displayed in the table below:

Multiple Linear Regression - Actuals, Interpolation, and Residuals
Time or IndexActualsInterpolationForecastResidualsPrediction Error
1493400.62820183105492.3717981689464
2514446.21564357063767.7843564293634
3522507.77557043311614.2244295668836
4490366.138650957291123.861349042709
5484551.632580732586-67.6325807325862
6506536.726739492531-30.7267394925310
7501382.923047544948118.076952455052
8462380.00175156061381.9982484393869
9465387.40262734092077.5973726590804
10454373.71931543907280.2806845609278
11464411.96749958400152.0325004159988
12427365.65727944241361.3427205575866
13460409.47311183940650.5268881605937
14473442.67767956729530.3223204327046
15465487.305921556643-22.3059215566425
16422355.27204723274366.7279527672565
17415552.643427590684-137.643427590684
18413488.964225447425-75.9642254474251
19420361.44255181037758.557448189623
20363363.575490116529-0.575490116529059
21376364.15314960467811.8468503953224
22380354.26051342069625.7394865793042
23384356.62363410316427.3763658968356
24346346.198477424037-0.198477424036972
25389401.133625260102-12.1336252601021
26407400.9802466707746.01975332922552
27393432.972902933903-39.9729029339031
28346323.17765948814922.8223405118514
29348525.8559858511-177.855985851100
30353465.462035996659-112.462035996659
31364346.78527236796417.2147276320364
32305338.809742093141-33.8097420931409
33307341.914518726533-34.9145187265332
34312362.6-50.6
35312334.637714939544-22.6377149395443
36286298.183251664407-12.1832516644068
37324378.642282667433-54.6422826674333
38336364.084336350217-28.0843363502166
39327374.596496878774-47.5964968787739
40302308.267668331211-6.26766833121078
41299446.504507490449-147.504507490449
42311448.277639409002-137.277639409002
43315325.052064918868-10.0520649188679
44264307.978912921168-43.9789129211678
45278327.509950998644-49.5099509986441
46278316.101044527516-38.1010445275160
47287349.800417811006-62.8004178110064
48279346.451189138561-67.4511891385614
49324400.122778402005-76.1227784020046
50354430.042093841077-76.042093841077
51354258.34910819756495.650891802436
5243250.143973990606-207.143973990606
53964433.363498335181530.636501664819
54762405.569359654383356.430640345617
551184.797063357843-183.797063357843
56412415.634103308549-3.63410330854913
57370375.019753329226-5.01975332922552
58389406.319126612716-17.3191266127159
59395388.9707335622846.02926643771635
60417398.50980233058118.4901976694186


Goldfeld-Quandt test for Heteroskedasticity
p-valuesAlternative Hypothesis
breakpoint indexgreater2-sidedless
160.01458573478847050.0291714695769410.98541426521153
170.00947373771006770.01894747542013540.990526262289932
180.002260547063660420.004521094127320830.99773945293634
190.0006412733043519760.001282546608703950.999358726695648
200.0002857484274741140.0005714968549482270.999714251572526
216.96047594695208e-050.0001392095189390420.99993039524053
221.51522081508307e-053.03044163016613e-050.99998484779185
237.19967661207058e-061.43993532241412e-050.999992800323388
241.87406247093655e-063.7481249418731e-060.99999812593753
252.1449814858749e-064.2899629717498e-060.999997855018514
264.78931829958751e-079.57863659917502e-070.99999952106817
271.44928984513214e-072.89857969026428e-070.999999855071016
284.28399559659662e-088.56799119319323e-080.999999957160044
294.84938719848462e-089.69877439696924e-080.999999951506128
301.74861735399429e-083.49723470798859e-080.999999982513826
316.11674134169305e-091.22334826833861e-080.999999993883259
321.51965910164231e-093.03931820328461e-090.99999999848034
333.77264437075154e-107.54528874150309e-100.999999999622736
341.06961362236647e-092.13922724473293e-090.999999998930386
352.00247362071609e-104.00494724143217e-100.999999999799753
364.76259364228288e-119.52518728456576e-110.999999999952374
372.45928571174157e-114.91857142348315e-110.999999999975407
384.89152739269325e-129.7830547853865e-120.999999999995108
397.62263144215197e-121.52452628843039e-110.999999999992377
402.60108710755317e-125.20217421510635e-120.999999999997399
419.62712989424022e-081.92542597884804e-070.999999903728701
420.5650318065395990.8699363869208020.434968193460401
430.6685220201862560.6629559596274890.331477979813744
440.5557998166657790.8884003666684430.444200183334221

\begin{tabular}{lllllllll}
\hline
Goldfeld-Quandt test for Heteroskedasticity \tabularnewline
p-values & Alternative Hypothesis \tabularnewline
breakpoint index & greater & 2-sided & less \tabularnewline
16 & 0.0145857347884705 & 0.029171469576941 & 0.98541426521153 \tabularnewline
17 & 0.0094737377100677 & 0.0189474754201354 & 0.990526262289932 \tabularnewline
18 & 0.00226054706366042 & 0.00452109412732083 & 0.99773945293634 \tabularnewline
19 & 0.000641273304351976 & 0.00128254660870395 & 0.999358726695648 \tabularnewline
20 & 0.000285748427474114 & 0.000571496854948227 & 0.999714251572526 \tabularnewline
21 & 6.96047594695208e-05 & 0.000139209518939042 & 0.99993039524053 \tabularnewline
22 & 1.51522081508307e-05 & 3.03044163016613e-05 & 0.99998484779185 \tabularnewline
23 & 7.19967661207058e-06 & 1.43993532241412e-05 & 0.999992800323388 \tabularnewline
24 & 1.87406247093655e-06 & 3.7481249418731e-06 & 0.99999812593753 \tabularnewline
25 & 2.1449814858749e-06 & 4.2899629717498e-06 & 0.999997855018514 \tabularnewline
26 & 4.78931829958751e-07 & 9.57863659917502e-07 & 0.99999952106817 \tabularnewline
27 & 1.44928984513214e-07 & 2.89857969026428e-07 & 0.999999855071016 \tabularnewline
28 & 4.28399559659662e-08 & 8.56799119319323e-08 & 0.999999957160044 \tabularnewline
29 & 4.84938719848462e-08 & 9.69877439696924e-08 & 0.999999951506128 \tabularnewline
30 & 1.74861735399429e-08 & 3.49723470798859e-08 & 0.999999982513826 \tabularnewline
31 & 6.11674134169305e-09 & 1.22334826833861e-08 & 0.999999993883259 \tabularnewline
32 & 1.51965910164231e-09 & 3.03931820328461e-09 & 0.99999999848034 \tabularnewline
33 & 3.77264437075154e-10 & 7.54528874150309e-10 & 0.999999999622736 \tabularnewline
34 & 1.06961362236647e-09 & 2.13922724473293e-09 & 0.999999998930386 \tabularnewline
35 & 2.00247362071609e-10 & 4.00494724143217e-10 & 0.999999999799753 \tabularnewline
36 & 4.76259364228288e-11 & 9.52518728456576e-11 & 0.999999999952374 \tabularnewline
37 & 2.45928571174157e-11 & 4.91857142348315e-11 & 0.999999999975407 \tabularnewline
38 & 4.89152739269325e-12 & 9.7830547853865e-12 & 0.999999999995108 \tabularnewline
39 & 7.62263144215197e-12 & 1.52452628843039e-11 & 0.999999999992377 \tabularnewline
40 & 2.60108710755317e-12 & 5.20217421510635e-12 & 0.999999999997399 \tabularnewline
41 & 9.62712989424022e-08 & 1.92542597884804e-07 & 0.999999903728701 \tabularnewline
42 & 0.565031806539599 & 0.869936386920802 & 0.434968193460401 \tabularnewline
43 & 0.668522020186256 & 0.662955959627489 & 0.331477979813744 \tabularnewline
44 & 0.555799816665779 & 0.888400366668443 & 0.444200183334221 \tabularnewline
\hline
\end{tabular}
%Source: https://freestatistics.org/blog/index.php?pk=115959&T=5

[TABLE]
[ROW][C]Goldfeld-Quandt test for Heteroskedasticity[/C][/ROW]
[ROW][C]p-values[/C][C]Alternative Hypothesis[/C][/ROW]
[ROW][C]breakpoint index[/C][C]greater[/C][C]2-sided[/C][C]less[/C][/ROW]
[ROW][C]16[/C][C]0.0145857347884705[/C][C]0.029171469576941[/C][C]0.98541426521153[/C][/ROW]
[ROW][C]17[/C][C]0.0094737377100677[/C][C]0.0189474754201354[/C][C]0.990526262289932[/C][/ROW]
[ROW][C]18[/C][C]0.00226054706366042[/C][C]0.00452109412732083[/C][C]0.99773945293634[/C][/ROW]
[ROW][C]19[/C][C]0.000641273304351976[/C][C]0.00128254660870395[/C][C]0.999358726695648[/C][/ROW]
[ROW][C]20[/C][C]0.000285748427474114[/C][C]0.000571496854948227[/C][C]0.999714251572526[/C][/ROW]
[ROW][C]21[/C][C]6.96047594695208e-05[/C][C]0.000139209518939042[/C][C]0.99993039524053[/C][/ROW]
[ROW][C]22[/C][C]1.51522081508307e-05[/C][C]3.03044163016613e-05[/C][C]0.99998484779185[/C][/ROW]
[ROW][C]23[/C][C]7.19967661207058e-06[/C][C]1.43993532241412e-05[/C][C]0.999992800323388[/C][/ROW]
[ROW][C]24[/C][C]1.87406247093655e-06[/C][C]3.7481249418731e-06[/C][C]0.99999812593753[/C][/ROW]
[ROW][C]25[/C][C]2.1449814858749e-06[/C][C]4.2899629717498e-06[/C][C]0.999997855018514[/C][/ROW]
[ROW][C]26[/C][C]4.78931829958751e-07[/C][C]9.57863659917502e-07[/C][C]0.99999952106817[/C][/ROW]
[ROW][C]27[/C][C]1.44928984513214e-07[/C][C]2.89857969026428e-07[/C][C]0.999999855071016[/C][/ROW]
[ROW][C]28[/C][C]4.28399559659662e-08[/C][C]8.56799119319323e-08[/C][C]0.999999957160044[/C][/ROW]
[ROW][C]29[/C][C]4.84938719848462e-08[/C][C]9.69877439696924e-08[/C][C]0.999999951506128[/C][/ROW]
[ROW][C]30[/C][C]1.74861735399429e-08[/C][C]3.49723470798859e-08[/C][C]0.999999982513826[/C][/ROW]
[ROW][C]31[/C][C]6.11674134169305e-09[/C][C]1.22334826833861e-08[/C][C]0.999999993883259[/C][/ROW]
[ROW][C]32[/C][C]1.51965910164231e-09[/C][C]3.03931820328461e-09[/C][C]0.99999999848034[/C][/ROW]
[ROW][C]33[/C][C]3.77264437075154e-10[/C][C]7.54528874150309e-10[/C][C]0.999999999622736[/C][/ROW]
[ROW][C]34[/C][C]1.06961362236647e-09[/C][C]2.13922724473293e-09[/C][C]0.999999998930386[/C][/ROW]
[ROW][C]35[/C][C]2.00247362071609e-10[/C][C]4.00494724143217e-10[/C][C]0.999999999799753[/C][/ROW]
[ROW][C]36[/C][C]4.76259364228288e-11[/C][C]9.52518728456576e-11[/C][C]0.999999999952374[/C][/ROW]
[ROW][C]37[/C][C]2.45928571174157e-11[/C][C]4.91857142348315e-11[/C][C]0.999999999975407[/C][/ROW]
[ROW][C]38[/C][C]4.89152739269325e-12[/C][C]9.7830547853865e-12[/C][C]0.999999999995108[/C][/ROW]
[ROW][C]39[/C][C]7.62263144215197e-12[/C][C]1.52452628843039e-11[/C][C]0.999999999992377[/C][/ROW]
[ROW][C]40[/C][C]2.60108710755317e-12[/C][C]5.20217421510635e-12[/C][C]0.999999999997399[/C][/ROW]
[ROW][C]41[/C][C]9.62712989424022e-08[/C][C]1.92542597884804e-07[/C][C]0.999999903728701[/C][/ROW]
[ROW][C]42[/C][C]0.565031806539599[/C][C]0.869936386920802[/C][C]0.434968193460401[/C][/ROW]
[ROW][C]43[/C][C]0.668522020186256[/C][C]0.662955959627489[/C][C]0.331477979813744[/C][/ROW]
[ROW][C]44[/C][C]0.555799816665779[/C][C]0.888400366668443[/C][C]0.444200183334221[/C][/ROW]
[/TABLE]
Source: https://freestatistics.org/blog/index.php?pk=115959&T=5

Globally Unique Identifier (entire table): ba.freestatistics.org/blog/index.php?pk=115959&T=5

As an alternative you can also use a QR Code:  

The GUIDs for individual cells are displayed in the table below:

Goldfeld-Quandt test for Heteroskedasticity
p-valuesAlternative Hypothesis
breakpoint indexgreater2-sidedless
160.01458573478847050.0291714695769410.98541426521153
170.00947373771006770.01894747542013540.990526262289932
180.002260547063660420.004521094127320830.99773945293634
190.0006412733043519760.001282546608703950.999358726695648
200.0002857484274741140.0005714968549482270.999714251572526
216.96047594695208e-050.0001392095189390420.99993039524053
221.51522081508307e-053.03044163016613e-050.99998484779185
237.19967661207058e-061.43993532241412e-050.999992800323388
241.87406247093655e-063.7481249418731e-060.99999812593753
252.1449814858749e-064.2899629717498e-060.999997855018514
264.78931829958751e-079.57863659917502e-070.99999952106817
271.44928984513214e-072.89857969026428e-070.999999855071016
284.28399559659662e-088.56799119319323e-080.999999957160044
294.84938719848462e-089.69877439696924e-080.999999951506128
301.74861735399429e-083.49723470798859e-080.999999982513826
316.11674134169305e-091.22334826833861e-080.999999993883259
321.51965910164231e-093.03931820328461e-090.99999999848034
333.77264437075154e-107.54528874150309e-100.999999999622736
341.06961362236647e-092.13922724473293e-090.999999998930386
352.00247362071609e-104.00494724143217e-100.999999999799753
364.76259364228288e-119.52518728456576e-110.999999999952374
372.45928571174157e-114.91857142348315e-110.999999999975407
384.89152739269325e-129.7830547853865e-120.999999999995108
397.62263144215197e-121.52452628843039e-110.999999999992377
402.60108710755317e-125.20217421510635e-120.999999999997399
419.62712989424022e-081.92542597884804e-070.999999903728701
420.5650318065395990.8699363869208020.434968193460401
430.6685220201862560.6629559596274890.331477979813744
440.5557998166657790.8884003666684430.444200183334221


Meta Analysis of Goldfeld-Quandt test for Heteroskedasticity
Description# significant tests% significant testsOK/NOK
1% type I error level240.827586206896552NOK
5% type I error level260.896551724137931NOK
10% type I error level260.896551724137931NOK

\begin{tabular}{lllllllll}
\hline
Meta Analysis of Goldfeld-Quandt test for Heteroskedasticity \tabularnewline
Description & # significant tests & % significant tests & OK/NOK \tabularnewline
1% type I error level & 24 & 0.827586206896552 & NOK \tabularnewline
5% type I error level & 26 & 0.896551724137931 & NOK \tabularnewline
10% type I error level & 26 & 0.896551724137931 & NOK \tabularnewline
\hline
\end{tabular}
%Source: https://freestatistics.org/blog/index.php?pk=115959&T=6

[TABLE]
[ROW][C]Meta Analysis of Goldfeld-Quandt test for Heteroskedasticity[/C][/ROW]
[ROW][C]Description[/C][C]# significant tests[/C][C]% significant tests[/C][C]OK/NOK[/C][/ROW]
[ROW][C]1% type I error level[/C][C]24[/C][C]0.827586206896552[/C][C]NOK[/C][/ROW]
[ROW][C]5% type I error level[/C][C]26[/C][C]0.896551724137931[/C][C]NOK[/C][/ROW]
[ROW][C]10% type I error level[/C][C]26[/C][C]0.896551724137931[/C][C]NOK[/C][/ROW]
[/TABLE]
Source: https://freestatistics.org/blog/index.php?pk=115959&T=6

Globally Unique Identifier (entire table): ba.freestatistics.org/blog/index.php?pk=115959&T=6

As an alternative you can also use a QR Code:  

The GUIDs for individual cells are displayed in the table below:

Meta Analysis of Goldfeld-Quandt test for Heteroskedasticity
Description# significant tests% significant testsOK/NOK
1% type I error level240.827586206896552NOK
5% type I error level260.896551724137931NOK
10% type I error level260.896551724137931NOK


Parameters (Session):
par1 = 1 ; par2 = Include Monthly Dummies ; par3 = No Linear Trend ;
Parameters (R input):
par1 = 1 ; par2 = Include Monthly Dummies ; par3 = No Linear Trend ;
R code (references can be found in the software module):
library(lattice)
library(lmtest)
n25 <- 25 #minimum number of obs. for Goldfeld-Quandt test
par1 <- as.numeric(par1)
x <- t(y)
k <- length(x[1,])
n <- length(x[,1])
x1 <- cbind(x[,par1], x[,1:k!=par1])
mycolnames <- c(colnames(x)[par1], colnames(x)[1:k!=par1])
colnames(x1) <- mycolnames #colnames(x)[par1]
x <- x1
if (par3 == 'First Differences'){
x2 <- array(0, dim=c(n-1,k), dimnames=list(1:(n-1), paste('(1-B)',colnames(x),sep='')))
for (i in 1:n-1) {
for (j in 1:k) {
x2[i,j] <- x[i+1,j] - x[i,j]
}
}
x <- x2
}
if (par2 == 'Include Monthly Dummies'){
x2 <- array(0, dim=c(n,11), dimnames=list(1:n, paste('M', seq(1:11), sep ='')))
for (i in 1:11){
x2[seq(i,n,12),i] <- 1
}
x <- cbind(x, x2)
}
if (par2 == 'Include Quarterly Dummies'){
x2 <- array(0, dim=c(n,3), dimnames=list(1:n, paste('Q', seq(1:3), sep ='')))
for (i in 1:3){
x2[seq(i,n,4),i] <- 1
}
x <- cbind(x, x2)
}
k <- length(x[1,])
if (par3 == 'Linear Trend'){
x <- cbind(x, c(1:n))
colnames(x)[k+1] <- 't'
}
x
k <- length(x[1,])
df <- as.data.frame(x)
(mylm <- lm(df))
(mysum <- summary(mylm))
if (n > n25) {
kp3 <- k + 3
nmkm3 <- n - k - 3
gqarr <- array(NA, dim=c(nmkm3-kp3+1,3))
numgqtests <- 0
numsignificant1 <- 0
numsignificant5 <- 0
numsignificant10 <- 0
for (mypoint in kp3:nmkm3) {
j <- 0
numgqtests <- numgqtests + 1
for (myalt in c('greater', 'two.sided', 'less')) {
j <- j + 1
gqarr[mypoint-kp3+1,j] <- gqtest(mylm, point=mypoint, alternative=myalt)$p.value
}
if (gqarr[mypoint-kp3+1,2] < 0.01) numsignificant1 <- numsignificant1 + 1
if (gqarr[mypoint-kp3+1,2] < 0.05) numsignificant5 <- numsignificant5 + 1
if (gqarr[mypoint-kp3+1,2] < 0.10) numsignificant10 <- numsignificant10 + 1
}
gqarr
}
bitmap(file='test0.png')
plot(x[,1], type='l', main='Actuals and Interpolation', ylab='value of Actuals and Interpolation (dots)', xlab='time or index')
points(x[,1]-mysum$resid)
grid()
dev.off()
bitmap(file='test1.png')
plot(mysum$resid, type='b', pch=19, main='Residuals', ylab='value of Residuals', xlab='time or index')
grid()
dev.off()
bitmap(file='test2.png')
hist(mysum$resid, main='Residual Histogram', xlab='values of Residuals')
grid()
dev.off()
bitmap(file='test3.png')
densityplot(~mysum$resid,col='black',main='Residual Density Plot', xlab='values of Residuals')
dev.off()
bitmap(file='test4.png')
qqnorm(mysum$resid, main='Residual Normal Q-Q Plot')
qqline(mysum$resid)
grid()
dev.off()
(myerror <- as.ts(mysum$resid))
bitmap(file='test5.png')
dum <- cbind(lag(myerror,k=1),myerror)
dum
dum1 <- dum[2:length(myerror),]
dum1
z <- as.data.frame(dum1)
z
plot(z,main=paste('Residual Lag plot, lowess, and regression line'), ylab='values of Residuals', xlab='lagged values of Residuals')
lines(lowess(z))
abline(lm(z))
grid()
dev.off()
bitmap(file='test6.png')
acf(mysum$resid, lag.max=length(mysum$resid)/2, main='Residual Autocorrelation Function')
grid()
dev.off()
bitmap(file='test7.png')
pacf(mysum$resid, lag.max=length(mysum$resid)/2, main='Residual Partial Autocorrelation Function')
grid()
dev.off()
bitmap(file='test8.png')
opar <- par(mfrow = c(2,2), oma = c(0, 0, 1.1, 0))
plot(mylm, las = 1, sub='Residual Diagnostics')
par(opar)
dev.off()
if (n > n25) {
bitmap(file='test9.png')
plot(kp3:nmkm3,gqarr[,2], main='Goldfeld-Quandt test',ylab='2-sided p-value',xlab='breakpoint')
grid()
dev.off()
}
load(file='createtable')
a<-table.start()
a<-table.row.start(a)
a<-table.element(a, 'Multiple Linear Regression - Estimated Regression Equation', 1, TRUE)
a<-table.row.end(a)
myeq <- colnames(x)[1]
myeq <- paste(myeq, '[t] = ', sep='')
for (i in 1:k){
if (mysum$coefficients[i,1] > 0) myeq <- paste(myeq, '+', '')
myeq <- paste(myeq, mysum$coefficients[i,1], sep=' ')
if (rownames(mysum$coefficients)[i] != '(Intercept)') {
myeq <- paste(myeq, rownames(mysum$coefficients)[i], sep='')
if (rownames(mysum$coefficients)[i] != 't') myeq <- paste(myeq, '[t]', sep='')
}
}
myeq <- paste(myeq, ' + e[t]')
a<-table.row.start(a)
a<-table.element(a, myeq)
a<-table.row.end(a)
a<-table.end(a)
table.save(a,file='mytable1.tab')
a<-table.start()
a<-table.row.start(a)
a<-table.element(a,hyperlink('ols1.htm','Multiple Linear Regression - Ordinary Least Squares',''), 6, TRUE)
a<-table.row.end(a)
a<-table.row.start(a)
a<-table.element(a,'Variable',header=TRUE)
a<-table.element(a,'Parameter',header=TRUE)
a<-table.element(a,'S.D.',header=TRUE)
a<-table.element(a,'T-STAT
H0: parameter = 0',header=TRUE)
a<-table.element(a,'2-tail p-value',header=TRUE)
a<-table.element(a,'1-tail p-value',header=TRUE)
a<-table.row.end(a)
for (i in 1:k){
a<-table.row.start(a)
a<-table.element(a,rownames(mysum$coefficients)[i],header=TRUE)
a<-table.element(a,mysum$coefficients[i,1])
a<-table.element(a, round(mysum$coefficients[i,2],6))
a<-table.element(a, round(mysum$coefficients[i,3],4))
a<-table.element(a, round(mysum$coefficients[i,4],6))
a<-table.element(a, round(mysum$coefficients[i,4]/2,6))
a<-table.row.end(a)
}
a<-table.end(a)
table.save(a,file='mytable2.tab')
a<-table.start()
a<-table.row.start(a)
a<-table.element(a, 'Multiple Linear Regression - Regression Statistics', 2, TRUE)
a<-table.row.end(a)
a<-table.row.start(a)
a<-table.element(a, 'Multiple R',1,TRUE)
a<-table.element(a, sqrt(mysum$r.squared))
a<-table.row.end(a)
a<-table.row.start(a)
a<-table.element(a, 'R-squared',1,TRUE)
a<-table.element(a, mysum$r.squared)
a<-table.row.end(a)
a<-table.row.start(a)
a<-table.element(a, 'Adjusted R-squared',1,TRUE)
a<-table.element(a, mysum$adj.r.squared)
a<-table.row.end(a)
a<-table.row.start(a)
a<-table.element(a, 'F-TEST (value)',1,TRUE)
a<-table.element(a, mysum$fstatistic[1])
a<-table.row.end(a)
a<-table.row.start(a)
a<-table.element(a, 'F-TEST (DF numerator)',1,TRUE)
a<-table.element(a, mysum$fstatistic[2])
a<-table.row.end(a)
a<-table.row.start(a)
a<-table.element(a, 'F-TEST (DF denominator)',1,TRUE)
a<-table.element(a, mysum$fstatistic[3])
a<-table.row.end(a)
a<-table.row.start(a)
a<-table.element(a, 'p-value',1,TRUE)
a<-table.element(a, 1-pf(mysum$fstatistic[1],mysum$fstatistic[2],mysum$fstatistic[3]))
a<-table.row.end(a)
a<-table.row.start(a)
a<-table.element(a, 'Multiple Linear Regression - Residual Statistics', 2, TRUE)
a<-table.row.end(a)
a<-table.row.start(a)
a<-table.element(a, 'Residual Standard Deviation',1,TRUE)
a<-table.element(a, mysum$sigma)
a<-table.row.end(a)
a<-table.row.start(a)
a<-table.element(a, 'Sum Squared Residuals',1,TRUE)
a<-table.element(a, sum(myerror*myerror))
a<-table.row.end(a)
a<-table.end(a)
table.save(a,file='mytable3.tab')
a<-table.start()
a<-table.row.start(a)
a<-table.element(a, 'Multiple Linear Regression - Actuals, Interpolation, and Residuals', 4, TRUE)
a<-table.row.end(a)
a<-table.row.start(a)
a<-table.element(a, 'Time or Index', 1, TRUE)
a<-table.element(a, 'Actuals', 1, TRUE)
a<-table.element(a, 'Interpolation
Forecast', 1, TRUE)
a<-table.element(a, 'Residuals
Prediction Error', 1, TRUE)
a<-table.row.end(a)
for (i in 1:n) {
a<-table.row.start(a)
a<-table.element(a,i, 1, TRUE)
a<-table.element(a,x[i])
a<-table.element(a,x[i]-mysum$resid[i])
a<-table.element(a,mysum$resid[i])
a<-table.row.end(a)
}
a<-table.end(a)
table.save(a,file='mytable4.tab')
if (n > n25) {
a<-table.start()
a<-table.row.start(a)
a<-table.element(a,'Goldfeld-Quandt test for Heteroskedasticity',4,TRUE)
a<-table.row.end(a)
a<-table.row.start(a)
a<-table.element(a,'p-values',header=TRUE)
a<-table.element(a,'Alternative Hypothesis',3,header=TRUE)
a<-table.row.end(a)
a<-table.row.start(a)
a<-table.element(a,'breakpoint index',header=TRUE)
a<-table.element(a,'greater',header=TRUE)
a<-table.element(a,'2-sided',header=TRUE)
a<-table.element(a,'less',header=TRUE)
a<-table.row.end(a)
for (mypoint in kp3:nmkm3) {
a<-table.row.start(a)
a<-table.element(a,mypoint,header=TRUE)
a<-table.element(a,gqarr[mypoint-kp3+1,1])
a<-table.element(a,gqarr[mypoint-kp3+1,2])
a<-table.element(a,gqarr[mypoint-kp3+1,3])
a<-table.row.end(a)
}
a<-table.end(a)
table.save(a,file='mytable5.tab')
a<-table.start()
a<-table.row.start(a)
a<-table.element(a,'Meta Analysis of Goldfeld-Quandt test for Heteroskedasticity',4,TRUE)
a<-table.row.end(a)
a<-table.row.start(a)
a<-table.element(a,'Description',header=TRUE)
a<-table.element(a,'# significant tests',header=TRUE)
a<-table.element(a,'% significant tests',header=TRUE)
a<-table.element(a,'OK/NOK',header=TRUE)
a<-table.row.end(a)
a<-table.row.start(a)
a<-table.element(a,'1% type I error level',header=TRUE)
a<-table.element(a,numsignificant1)
a<-table.element(a,numsignificant1/numgqtests)
if (numsignificant1/numgqtests < 0.01) dum <- 'OK' else dum <- 'NOK'
a<-table.element(a,dum)
a<-table.row.end(a)
a<-table.row.start(a)
a<-table.element(a,'5% type I error level',header=TRUE)
a<-table.element(a,numsignificant5)
a<-table.element(a,numsignificant5/numgqtests)
if (numsignificant5/numgqtests < 0.05) dum <- 'OK' else dum <- 'NOK'
a<-table.element(a,dum)
a<-table.row.end(a)
a<-table.row.start(a)
a<-table.element(a,'10% type I error level',header=TRUE)
a<-table.element(a,numsignificant10)
a<-table.element(a,numsignificant10/numgqtests)
if (numsignificant10/numgqtests < 0.1) dum <- 'OK' else dum <- 'NOK'
a<-table.element(a,dum)
a<-table.row.end(a)
a<-table.end(a)
table.save(a,file='mytable6.tab')
}