Free Statistics

of Irreproducible Research!

Author's title

Author*The author of this computation has been verified*
R Software Modulerwasp_multipleregression.wasp
Title produced by softwareMultiple Regression
Date of computationMon, 27 Dec 2010 13:33:24 +0000
Cite this page as followsStatistical Computations at FreeStatistics.org, Office for Research Development and Education, URL https://freestatistics.org/blog/index.php?v=date/2010/Dec/27/t1293456692ryg92vm22m8gq73.htm/, Retrieved Sun, 05 May 2024 13:08:09 +0000
Statistical Computations at FreeStatistics.org, Office for Research Development and Education, URL https://freestatistics.org/blog/index.php?pk=115970, Retrieved Sun, 05 May 2024 13:08:09 +0000
QR Codes:

Original text written by user:
IsPrivate?No (this computation is public)
User-defined keywords
Estimated Impact109
Family? (F = Feedback message, R = changed R code, M = changed R Module, P = changed Parameters, D = changed Data)
-     [Multiple Regression] [Q1 The Seatbeltlaw] [2007-11-14 19:27:43] [8cd6641b921d30ebe00b648d1481bba0]
- RM D  [Multiple Regression] [Seatbelt] [2009-11-12 14:06:21] [b98453cac15ba1066b407e146608df68]
- R  D    [Multiple Regression] [Regressiemodel - ...] [2009-11-19 17:13:05] [54d83950395cfb8ca1091bdb7440f70a]
-    D        [Multiple Regression] [] [2010-12-27 13:33:24] [d42b17bf3b3c0d56878eb3f5a4351e6d] [Current]
Feedback Forum

Post a new message
Dataseries X:
493	797
514	840
522	988
490	819
484	831
506	904
501	814
462	798
465	828
454	789
464	930
427	744
460	832
473	826
465	907
422	776
415	835
413	715
420	729
363	733
376	736
380	712
384	711
346	667
389	799
407	661
393	692
346	649
348	729
353	622
364	671
305	635
307	648
312	745
312	624
286	477
324	710
336	515
327	461
302	590
299	415
311	554
315	585
264	513
278	591
278	561
287	684
279	668
324	795
354	776
354	1 043
360	964
363	762
385	1 030
412	939
370	779
389	918
395	839
417	874
404	840


Summary of computational transaction
Raw Inputview raw input (R code)
Raw Outputview raw output of R engine
Computing time7 seconds
R Server'George Udny Yule' @ 72.249.76.132

\begin{tabular}{lllllllll}
\hline
Summary of computational transaction \tabularnewline
Raw Input & view raw input (R code)  \tabularnewline
Raw Output & view raw output of R engine  \tabularnewline
Computing time & 7 seconds \tabularnewline
R Server & 'George Udny Yule' @ 72.249.76.132 \tabularnewline
\hline
\end{tabular}
%Source: https://freestatistics.org/blog/index.php?pk=115970&T=0

[TABLE]
[ROW][C]Summary of computational transaction[/C][/ROW]
[ROW][C]Raw Input[/C][C]view raw input (R code) [/C][/ROW]
[ROW][C]Raw Output[/C][C]view raw output of R engine [/C][/ROW]
[ROW][C]Computing time[/C][C]7 seconds[/C][/ROW]
[ROW][C]R Server[/C][C]'George Udny Yule' @ 72.249.76.132[/C][/ROW]
[/TABLE]
Source: https://freestatistics.org/blog/index.php?pk=115970&T=0

Globally Unique Identifier (entire table): ba.freestatistics.org/blog/index.php?pk=115970&T=0

As an alternative you can also use a QR Code:  

The GUIDs for individual cells are displayed in the table below:

Summary of computational transaction
Raw Inputview raw input (R code)
Raw Outputview raw output of R engine
Computing time7 seconds
R Server'George Udny Yule' @ 72.249.76.132


Multiple Linear Regression - Estimated Regression Equation
WLH[t] = + 262.466316248146 + 0.191310161094259Faill[t] + 14.7054212842817M1[t] + 46.744213843187M2[t] + 65.1015625856806M3[t] -30.860179676086M4[t] + 152.529575410477M5[t] + 120.447993594912M6[t] -13.7357806863045M7[t] -1.7382716970117M8[t] -1.17458612716618M9[t] -2.05980432449510M10[t] + 2.51594005568410M11[t] -1.18625240996687t + e[t]

\begin{tabular}{lllllllll}
\hline
Multiple Linear Regression - Estimated Regression Equation \tabularnewline
WLH[t] =  +  262.466316248146 +  0.191310161094259Faill[t] +  14.7054212842817M1[t] +  46.744213843187M2[t] +  65.1015625856806M3[t] -30.860179676086M4[t] +  152.529575410477M5[t] +  120.447993594912M6[t] -13.7357806863045M7[t] -1.7382716970117M8[t] -1.17458612716618M9[t] -2.05980432449510M10[t] +  2.51594005568410M11[t] -1.18625240996687t  + e[t] \tabularnewline
\hline
\end{tabular}
%Source: https://freestatistics.org/blog/index.php?pk=115970&T=1

[TABLE]
[ROW][C]Multiple Linear Regression - Estimated Regression Equation[/C][/ROW]
[ROW][C]WLH[t] =  +  262.466316248146 +  0.191310161094259Faill[t] +  14.7054212842817M1[t] +  46.744213843187M2[t] +  65.1015625856806M3[t] -30.860179676086M4[t] +  152.529575410477M5[t] +  120.447993594912M6[t] -13.7357806863045M7[t] -1.7382716970117M8[t] -1.17458612716618M9[t] -2.05980432449510M10[t] +  2.51594005568410M11[t] -1.18625240996687t  + e[t][/C][/ROW]
[/TABLE]
Source: https://freestatistics.org/blog/index.php?pk=115970&T=1

Globally Unique Identifier (entire table): ba.freestatistics.org/blog/index.php?pk=115970&T=1

As an alternative you can also use a QR Code:  

The GUIDs for individual cells are displayed in the table below:

Multiple Linear Regression - Estimated Regression Equation
WLH[t] = + 262.466316248146 + 0.191310161094259Faill[t] + 14.7054212842817M1[t] + 46.744213843187M2[t] + 65.1015625856806M3[t] -30.860179676086M4[t] + 152.529575410477M5[t] + 120.447993594912M6[t] -13.7357806863045M7[t] -1.7382716970117M8[t] -1.17458612716618M9[t] -2.05980432449510M10[t] + 2.51594005568410M11[t] -1.18625240996687t + e[t]


Multiple Linear Regression - Ordinary Least Squares
VariableParameterS.D.T-STATH0: parameter = 02-tail p-value1-tail p-value
(Intercept)262.466316248146116.0209042.26220.0284510.014226
Faill0.1913101610942590.1070281.78750.0804490.040224
M114.705421284281779.647670.18460.854330.427165
M246.74421384318779.4629560.58830.5592410.27962
M365.101562585680680.5092780.80860.4228950.211448
M4-30.86017967608679.861019-0.38640.7009650.350482
M5152.52957541047779.7548751.91250.0620530.031027
M6120.44799359491279.5896021.51340.1370280.068514
M7-13.735780686304580.605994-0.17040.8654380.432719
M8-1.738271697011778.970099-0.0220.9825340.491267
M9-1.1745861271661878.927473-0.01490.9881910.494095
M10-2.0598043244951079.049506-0.02610.9793240.489662
M112.5159400556841079.1833080.03180.974790.487395
t-1.186252409966871.134708-1.04540.3012890.150645

\begin{tabular}{lllllllll}
\hline
Multiple Linear Regression - Ordinary Least Squares \tabularnewline
Variable & Parameter & S.D. & T-STATH0: parameter = 0 & 2-tail p-value & 1-tail p-value \tabularnewline
(Intercept) & 262.466316248146 & 116.020904 & 2.2622 & 0.028451 & 0.014226 \tabularnewline
Faill & 0.191310161094259 & 0.107028 & 1.7875 & 0.080449 & 0.040224 \tabularnewline
M1 & 14.7054212842817 & 79.64767 & 0.1846 & 0.85433 & 0.427165 \tabularnewline
M2 & 46.744213843187 & 79.462956 & 0.5883 & 0.559241 & 0.27962 \tabularnewline
M3 & 65.1015625856806 & 80.509278 & 0.8086 & 0.422895 & 0.211448 \tabularnewline
M4 & -30.860179676086 & 79.861019 & -0.3864 & 0.700965 & 0.350482 \tabularnewline
M5 & 152.529575410477 & 79.754875 & 1.9125 & 0.062053 & 0.031027 \tabularnewline
M6 & 120.447993594912 & 79.589602 & 1.5134 & 0.137028 & 0.068514 \tabularnewline
M7 & -13.7357806863045 & 80.605994 & -0.1704 & 0.865438 & 0.432719 \tabularnewline
M8 & -1.7382716970117 & 78.970099 & -0.022 & 0.982534 & 0.491267 \tabularnewline
M9 & -1.17458612716618 & 78.927473 & -0.0149 & 0.988191 & 0.494095 \tabularnewline
M10 & -2.05980432449510 & 79.049506 & -0.0261 & 0.979324 & 0.489662 \tabularnewline
M11 & 2.51594005568410 & 79.183308 & 0.0318 & 0.97479 & 0.487395 \tabularnewline
t & -1.18625240996687 & 1.134708 & -1.0454 & 0.301289 & 0.150645 \tabularnewline
\hline
\end{tabular}
%Source: https://freestatistics.org/blog/index.php?pk=115970&T=2

[TABLE]
[ROW][C]Multiple Linear Regression - Ordinary Least Squares[/C][/ROW]
[ROW][C]Variable[/C][C]Parameter[/C][C]S.D.[/C][C]T-STATH0: parameter = 0[/C][C]2-tail p-value[/C][C]1-tail p-value[/C][/ROW]
[ROW][C](Intercept)[/C][C]262.466316248146[/C][C]116.020904[/C][C]2.2622[/C][C]0.028451[/C][C]0.014226[/C][/ROW]
[ROW][C]Faill[/C][C]0.191310161094259[/C][C]0.107028[/C][C]1.7875[/C][C]0.080449[/C][C]0.040224[/C][/ROW]
[ROW][C]M1[/C][C]14.7054212842817[/C][C]79.64767[/C][C]0.1846[/C][C]0.85433[/C][C]0.427165[/C][/ROW]
[ROW][C]M2[/C][C]46.744213843187[/C][C]79.462956[/C][C]0.5883[/C][C]0.559241[/C][C]0.27962[/C][/ROW]
[ROW][C]M3[/C][C]65.1015625856806[/C][C]80.509278[/C][C]0.8086[/C][C]0.422895[/C][C]0.211448[/C][/ROW]
[ROW][C]M4[/C][C]-30.860179676086[/C][C]79.861019[/C][C]-0.3864[/C][C]0.700965[/C][C]0.350482[/C][/ROW]
[ROW][C]M5[/C][C]152.529575410477[/C][C]79.754875[/C][C]1.9125[/C][C]0.062053[/C][C]0.031027[/C][/ROW]
[ROW][C]M6[/C][C]120.447993594912[/C][C]79.589602[/C][C]1.5134[/C][C]0.137028[/C][C]0.068514[/C][/ROW]
[ROW][C]M7[/C][C]-13.7357806863045[/C][C]80.605994[/C][C]-0.1704[/C][C]0.865438[/C][C]0.432719[/C][/ROW]
[ROW][C]M8[/C][C]-1.7382716970117[/C][C]78.970099[/C][C]-0.022[/C][C]0.982534[/C][C]0.491267[/C][/ROW]
[ROW][C]M9[/C][C]-1.17458612716618[/C][C]78.927473[/C][C]-0.0149[/C][C]0.988191[/C][C]0.494095[/C][/ROW]
[ROW][C]M10[/C][C]-2.05980432449510[/C][C]79.049506[/C][C]-0.0261[/C][C]0.979324[/C][C]0.489662[/C][/ROW]
[ROW][C]M11[/C][C]2.51594005568410[/C][C]79.183308[/C][C]0.0318[/C][C]0.97479[/C][C]0.487395[/C][/ROW]
[ROW][C]t[/C][C]-1.18625240996687[/C][C]1.134708[/C][C]-1.0454[/C][C]0.301289[/C][C]0.150645[/C][/ROW]
[/TABLE]
Source: https://freestatistics.org/blog/index.php?pk=115970&T=2

Globally Unique Identifier (entire table): ba.freestatistics.org/blog/index.php?pk=115970&T=2

As an alternative you can also use a QR Code:  

The GUIDs for individual cells are displayed in the table below:

Multiple Linear Regression - Ordinary Least Squares
VariableParameterS.D.T-STATH0: parameter = 02-tail p-value1-tail p-value
(Intercept)262.466316248146116.0209042.26220.0284510.014226
Faill0.1913101610942590.1070281.78750.0804490.040224
M114.705421284281779.647670.18460.854330.427165
M246.74421384318779.4629560.58830.5592410.27962
M365.101562585680680.5092780.80860.4228950.211448
M4-30.86017967608679.861019-0.38640.7009650.350482
M5152.52957541047779.7548751.91250.0620530.031027
M6120.44799359491279.5896021.51340.1370280.068514
M7-13.735780686304580.605994-0.17040.8654380.432719
M8-1.738271697011778.970099-0.0220.9825340.491267
M9-1.1745861271661878.927473-0.01490.9881910.494095
M10-2.0598043244951079.049506-0.02610.9793240.489662
M112.5159400556841079.1833080.03180.974790.487395
t-1.186252409966871.134708-1.04540.3012890.150645


Multiple Linear Regression - Regression Statistics
Multiple R0.550948091396239
R-squared0.303543799413159
Adjusted R-squared0.106719220986443
F-TEST (value)1.54220474820515
F-TEST (DF numerator)13
F-TEST (DF denominator)46
p-value0.138692520770443
Multiple Linear Regression - Residual Statistics
Residual Standard Deviation124.694906515412
Sum Squared Residuals715245.70670082

\begin{tabular}{lllllllll}
\hline
Multiple Linear Regression - Regression Statistics \tabularnewline
Multiple R & 0.550948091396239 \tabularnewline
R-squared & 0.303543799413159 \tabularnewline
Adjusted R-squared & 0.106719220986443 \tabularnewline
F-TEST (value) & 1.54220474820515 \tabularnewline
F-TEST (DF numerator) & 13 \tabularnewline
F-TEST (DF denominator) & 46 \tabularnewline
p-value & 0.138692520770443 \tabularnewline
Multiple Linear Regression - Residual Statistics \tabularnewline
Residual Standard Deviation & 124.694906515412 \tabularnewline
Sum Squared Residuals & 715245.70670082 \tabularnewline
\hline
\end{tabular}
%Source: https://freestatistics.org/blog/index.php?pk=115970&T=3

[TABLE]
[ROW][C]Multiple Linear Regression - Regression Statistics[/C][/ROW]
[ROW][C]Multiple R[/C][C]0.550948091396239[/C][/ROW]
[ROW][C]R-squared[/C][C]0.303543799413159[/C][/ROW]
[ROW][C]Adjusted R-squared[/C][C]0.106719220986443[/C][/ROW]
[ROW][C]F-TEST (value)[/C][C]1.54220474820515[/C][/ROW]
[ROW][C]F-TEST (DF numerator)[/C][C]13[/C][/ROW]
[ROW][C]F-TEST (DF denominator)[/C][C]46[/C][/ROW]
[ROW][C]p-value[/C][C]0.138692520770443[/C][/ROW]
[ROW][C]Multiple Linear Regression - Residual Statistics[/C][/ROW]
[ROW][C]Residual Standard Deviation[/C][C]124.694906515412[/C][/ROW]
[ROW][C]Sum Squared Residuals[/C][C]715245.70670082[/C][/ROW]
[/TABLE]
Source: https://freestatistics.org/blog/index.php?pk=115970&T=3

Globally Unique Identifier (entire table): ba.freestatistics.org/blog/index.php?pk=115970&T=3

As an alternative you can also use a QR Code:  

The GUIDs for individual cells are displayed in the table below:

Multiple Linear Regression - Regression Statistics
Multiple R0.550948091396239
R-squared0.303543799413159
Adjusted R-squared0.106719220986443
F-TEST (value)1.54220474820515
F-TEST (DF numerator)13
F-TEST (DF denominator)46
p-value0.138692520770443
Multiple Linear Regression - Residual Statistics
Residual Standard Deviation124.694906515412
Sum Squared Residuals715245.70670082


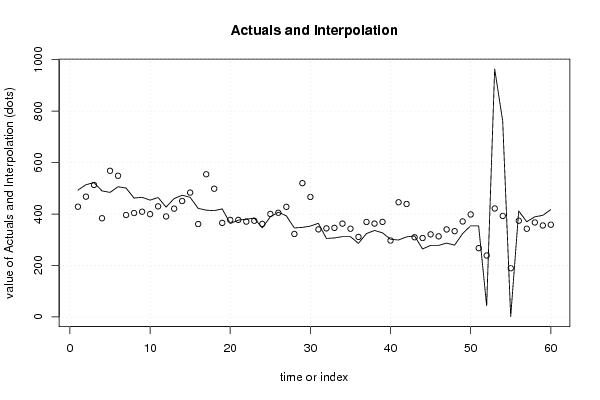
Multiple Linear Regression - Actuals, Interpolation, and Residuals
Time or IndexActualsInterpolationForecastResidualsPrediction Error
1493428.45968351458664.5403164854142
2514467.53856059057746.4614394094232
3522513.0235607650548.97643923494628
4490383.544148868390106.455851131610
5484568.043373478117-84.0433734781174
6506548.741181012466-42.7411810124664
7501396.1532398228104.8467601772
8462403.90353382461858.0964661753822
9465409.02027181732455.9797281826757
10454399.48770492735254.5122950726477
11464429.85192961185534.1480703881448
12427390.56604718267236.433952817328
13460420.92051023328239.0794897667183
14473450.62518941565522.3748105843454
15465483.292408796816-18.2924087968163
16422361.08278302173560.9172169782652
17415554.573585202892-139.573585202892
18413498.348531646049-85.3485316460489
19420365.65684721018654.3431527898145
20363377.233344433889-14.2333444338885
21376377.18470807705-1.18470807704993
22380370.5217936034929.47820639650807
23384373.7199754126110.2800245873900
24346361.600135858812-15.6001358588116
25389400.372245997569-11.3722459975687
26407404.8239839154992.17601608450066
27393427.925695241948-34.9256952419481
28346322.55136364316123.4486363568386
29348520.059679207298-172.059679207298
30353466.32165774468-113.321657744680
31364340.32582894711623.6741710528840
32305344.249919727049-39.2499197270487
33307346.114384981153-39.1143849811527
34312362.6-50.6
35312342.840962477807-30.840962477807
36286311.0161763313-25.0161763312999
37324369.110612740577-45.1106127405771
38336362.657671476135-26.657671476135
39327369.498019109572-42.4980191095718
40302297.0290352189984.97096478100234
41299445.753259704098-146.753259704098
42311439.077537870668-128.077537870668
43315309.6381261734075.36187382659272
44264306.675051153947-42.6750511539466
45278320.974676879177-42.9746768791774
46278313.163901439054-35.1639014390538
47287340.08454322386-53.0845432238601
48279333.321388180701-54.3213881807009
49324371.136947513987-47.1369475139867
50354398.354594602134-44.3545946021342
51354267.2603160866186.7396839133899
5243238.792669247716-195.792669247716
53964421.570102407594542.429897592406
54762392.511091726136369.488908273864
551189.225957846491-188.225957846491
56412373.93815086049838.0618491395015
57370342.70595824529627.2940417547043
58389367.22660003010221.7733999698981
59395355.50258927386839.4974107261322
60417358.49625244651658.5037475534841

\begin{tabular}{lllllllll}
\hline
Multiple Linear Regression - Actuals, Interpolation, and Residuals \tabularnewline
Time or Index & Actuals & InterpolationForecast & ResidualsPrediction Error \tabularnewline
1 & 493 & 428.459683514586 & 64.5403164854142 \tabularnewline
2 & 514 & 467.538560590577 & 46.4614394094232 \tabularnewline
3 & 522 & 513.023560765054 & 8.97643923494628 \tabularnewline
4 & 490 & 383.544148868390 & 106.455851131610 \tabularnewline
5 & 484 & 568.043373478117 & -84.0433734781174 \tabularnewline
6 & 506 & 548.741181012466 & -42.7411810124664 \tabularnewline
7 & 501 & 396.1532398228 & 104.8467601772 \tabularnewline
8 & 462 & 403.903533824618 & 58.0964661753822 \tabularnewline
9 & 465 & 409.020271817324 & 55.9797281826757 \tabularnewline
10 & 454 & 399.487704927352 & 54.5122950726477 \tabularnewline
11 & 464 & 429.851929611855 & 34.1480703881448 \tabularnewline
12 & 427 & 390.566047182672 & 36.433952817328 \tabularnewline
13 & 460 & 420.920510233282 & 39.0794897667183 \tabularnewline
14 & 473 & 450.625189415655 & 22.3748105843454 \tabularnewline
15 & 465 & 483.292408796816 & -18.2924087968163 \tabularnewline
16 & 422 & 361.082783021735 & 60.9172169782652 \tabularnewline
17 & 415 & 554.573585202892 & -139.573585202892 \tabularnewline
18 & 413 & 498.348531646049 & -85.3485316460489 \tabularnewline
19 & 420 & 365.656847210186 & 54.3431527898145 \tabularnewline
20 & 363 & 377.233344433889 & -14.2333444338885 \tabularnewline
21 & 376 & 377.18470807705 & -1.18470807704993 \tabularnewline
22 & 380 & 370.521793603492 & 9.47820639650807 \tabularnewline
23 & 384 & 373.71997541261 & 10.2800245873900 \tabularnewline
24 & 346 & 361.600135858812 & -15.6001358588116 \tabularnewline
25 & 389 & 400.372245997569 & -11.3722459975687 \tabularnewline
26 & 407 & 404.823983915499 & 2.17601608450066 \tabularnewline
27 & 393 & 427.925695241948 & -34.9256952419481 \tabularnewline
28 & 346 & 322.551363643161 & 23.4486363568386 \tabularnewline
29 & 348 & 520.059679207298 & -172.059679207298 \tabularnewline
30 & 353 & 466.32165774468 & -113.321657744680 \tabularnewline
31 & 364 & 340.325828947116 & 23.6741710528840 \tabularnewline
32 & 305 & 344.249919727049 & -39.2499197270487 \tabularnewline
33 & 307 & 346.114384981153 & -39.1143849811527 \tabularnewline
34 & 312 & 362.6 & -50.6 \tabularnewline
35 & 312 & 342.840962477807 & -30.840962477807 \tabularnewline
36 & 286 & 311.0161763313 & -25.0161763312999 \tabularnewline
37 & 324 & 369.110612740577 & -45.1106127405771 \tabularnewline
38 & 336 & 362.657671476135 & -26.657671476135 \tabularnewline
39 & 327 & 369.498019109572 & -42.4980191095718 \tabularnewline
40 & 302 & 297.029035218998 & 4.97096478100234 \tabularnewline
41 & 299 & 445.753259704098 & -146.753259704098 \tabularnewline
42 & 311 & 439.077537870668 & -128.077537870668 \tabularnewline
43 & 315 & 309.638126173407 & 5.36187382659272 \tabularnewline
44 & 264 & 306.675051153947 & -42.6750511539466 \tabularnewline
45 & 278 & 320.974676879177 & -42.9746768791774 \tabularnewline
46 & 278 & 313.163901439054 & -35.1639014390538 \tabularnewline
47 & 287 & 340.08454322386 & -53.0845432238601 \tabularnewline
48 & 279 & 333.321388180701 & -54.3213881807009 \tabularnewline
49 & 324 & 371.136947513987 & -47.1369475139867 \tabularnewline
50 & 354 & 398.354594602134 & -44.3545946021342 \tabularnewline
51 & 354 & 267.26031608661 & 86.7396839133899 \tabularnewline
52 & 43 & 238.792669247716 & -195.792669247716 \tabularnewline
53 & 964 & 421.570102407594 & 542.429897592406 \tabularnewline
54 & 762 & 392.511091726136 & 369.488908273864 \tabularnewline
55 & 1 & 189.225957846491 & -188.225957846491 \tabularnewline
56 & 412 & 373.938150860498 & 38.0618491395015 \tabularnewline
57 & 370 & 342.705958245296 & 27.2940417547043 \tabularnewline
58 & 389 & 367.226600030102 & 21.7733999698981 \tabularnewline
59 & 395 & 355.502589273868 & 39.4974107261322 \tabularnewline
60 & 417 & 358.496252446516 & 58.5037475534841 \tabularnewline
\hline
\end{tabular}
%Source: https://freestatistics.org/blog/index.php?pk=115970&T=4

[TABLE]
[ROW][C]Multiple Linear Regression - Actuals, Interpolation, and Residuals[/C][/ROW]
[ROW][C]Time or Index[/C][C]Actuals[/C][C]InterpolationForecast[/C][C]ResidualsPrediction Error[/C][/ROW]
[ROW][C]1[/C][C]493[/C][C]428.459683514586[/C][C]64.5403164854142[/C][/ROW]
[ROW][C]2[/C][C]514[/C][C]467.538560590577[/C][C]46.4614394094232[/C][/ROW]
[ROW][C]3[/C][C]522[/C][C]513.023560765054[/C][C]8.97643923494628[/C][/ROW]
[ROW][C]4[/C][C]490[/C][C]383.544148868390[/C][C]106.455851131610[/C][/ROW]
[ROW][C]5[/C][C]484[/C][C]568.043373478117[/C][C]-84.0433734781174[/C][/ROW]
[ROW][C]6[/C][C]506[/C][C]548.741181012466[/C][C]-42.7411810124664[/C][/ROW]
[ROW][C]7[/C][C]501[/C][C]396.1532398228[/C][C]104.8467601772[/C][/ROW]
[ROW][C]8[/C][C]462[/C][C]403.903533824618[/C][C]58.0964661753822[/C][/ROW]
[ROW][C]9[/C][C]465[/C][C]409.020271817324[/C][C]55.9797281826757[/C][/ROW]
[ROW][C]10[/C][C]454[/C][C]399.487704927352[/C][C]54.5122950726477[/C][/ROW]
[ROW][C]11[/C][C]464[/C][C]429.851929611855[/C][C]34.1480703881448[/C][/ROW]
[ROW][C]12[/C][C]427[/C][C]390.566047182672[/C][C]36.433952817328[/C][/ROW]
[ROW][C]13[/C][C]460[/C][C]420.920510233282[/C][C]39.0794897667183[/C][/ROW]
[ROW][C]14[/C][C]473[/C][C]450.625189415655[/C][C]22.3748105843454[/C][/ROW]
[ROW][C]15[/C][C]465[/C][C]483.292408796816[/C][C]-18.2924087968163[/C][/ROW]
[ROW][C]16[/C][C]422[/C][C]361.082783021735[/C][C]60.9172169782652[/C][/ROW]
[ROW][C]17[/C][C]415[/C][C]554.573585202892[/C][C]-139.573585202892[/C][/ROW]
[ROW][C]18[/C][C]413[/C][C]498.348531646049[/C][C]-85.3485316460489[/C][/ROW]
[ROW][C]19[/C][C]420[/C][C]365.656847210186[/C][C]54.3431527898145[/C][/ROW]
[ROW][C]20[/C][C]363[/C][C]377.233344433889[/C][C]-14.2333444338885[/C][/ROW]
[ROW][C]21[/C][C]376[/C][C]377.18470807705[/C][C]-1.18470807704993[/C][/ROW]
[ROW][C]22[/C][C]380[/C][C]370.521793603492[/C][C]9.47820639650807[/C][/ROW]
[ROW][C]23[/C][C]384[/C][C]373.71997541261[/C][C]10.2800245873900[/C][/ROW]
[ROW][C]24[/C][C]346[/C][C]361.600135858812[/C][C]-15.6001358588116[/C][/ROW]
[ROW][C]25[/C][C]389[/C][C]400.372245997569[/C][C]-11.3722459975687[/C][/ROW]
[ROW][C]26[/C][C]407[/C][C]404.823983915499[/C][C]2.17601608450066[/C][/ROW]
[ROW][C]27[/C][C]393[/C][C]427.925695241948[/C][C]-34.9256952419481[/C][/ROW]
[ROW][C]28[/C][C]346[/C][C]322.551363643161[/C][C]23.4486363568386[/C][/ROW]
[ROW][C]29[/C][C]348[/C][C]520.059679207298[/C][C]-172.059679207298[/C][/ROW]
[ROW][C]30[/C][C]353[/C][C]466.32165774468[/C][C]-113.321657744680[/C][/ROW]
[ROW][C]31[/C][C]364[/C][C]340.325828947116[/C][C]23.6741710528840[/C][/ROW]
[ROW][C]32[/C][C]305[/C][C]344.249919727049[/C][C]-39.2499197270487[/C][/ROW]
[ROW][C]33[/C][C]307[/C][C]346.114384981153[/C][C]-39.1143849811527[/C][/ROW]
[ROW][C]34[/C][C]312[/C][C]362.6[/C][C]-50.6[/C][/ROW]
[ROW][C]35[/C][C]312[/C][C]342.840962477807[/C][C]-30.840962477807[/C][/ROW]
[ROW][C]36[/C][C]286[/C][C]311.0161763313[/C][C]-25.0161763312999[/C][/ROW]
[ROW][C]37[/C][C]324[/C][C]369.110612740577[/C][C]-45.1106127405771[/C][/ROW]
[ROW][C]38[/C][C]336[/C][C]362.657671476135[/C][C]-26.657671476135[/C][/ROW]
[ROW][C]39[/C][C]327[/C][C]369.498019109572[/C][C]-42.4980191095718[/C][/ROW]
[ROW][C]40[/C][C]302[/C][C]297.029035218998[/C][C]4.97096478100234[/C][/ROW]
[ROW][C]41[/C][C]299[/C][C]445.753259704098[/C][C]-146.753259704098[/C][/ROW]
[ROW][C]42[/C][C]311[/C][C]439.077537870668[/C][C]-128.077537870668[/C][/ROW]
[ROW][C]43[/C][C]315[/C][C]309.638126173407[/C][C]5.36187382659272[/C][/ROW]
[ROW][C]44[/C][C]264[/C][C]306.675051153947[/C][C]-42.6750511539466[/C][/ROW]
[ROW][C]45[/C][C]278[/C][C]320.974676879177[/C][C]-42.9746768791774[/C][/ROW]
[ROW][C]46[/C][C]278[/C][C]313.163901439054[/C][C]-35.1639014390538[/C][/ROW]
[ROW][C]47[/C][C]287[/C][C]340.08454322386[/C][C]-53.0845432238601[/C][/ROW]
[ROW][C]48[/C][C]279[/C][C]333.321388180701[/C][C]-54.3213881807009[/C][/ROW]
[ROW][C]49[/C][C]324[/C][C]371.136947513987[/C][C]-47.1369475139867[/C][/ROW]
[ROW][C]50[/C][C]354[/C][C]398.354594602134[/C][C]-44.3545946021342[/C][/ROW]
[ROW][C]51[/C][C]354[/C][C]267.26031608661[/C][C]86.7396839133899[/C][/ROW]
[ROW][C]52[/C][C]43[/C][C]238.792669247716[/C][C]-195.792669247716[/C][/ROW]
[ROW][C]53[/C][C]964[/C][C]421.570102407594[/C][C]542.429897592406[/C][/ROW]
[ROW][C]54[/C][C]762[/C][C]392.511091726136[/C][C]369.488908273864[/C][/ROW]
[ROW][C]55[/C][C]1[/C][C]189.225957846491[/C][C]-188.225957846491[/C][/ROW]
[ROW][C]56[/C][C]412[/C][C]373.938150860498[/C][C]38.0618491395015[/C][/ROW]
[ROW][C]57[/C][C]370[/C][C]342.705958245296[/C][C]27.2940417547043[/C][/ROW]
[ROW][C]58[/C][C]389[/C][C]367.226600030102[/C][C]21.7733999698981[/C][/ROW]
[ROW][C]59[/C][C]395[/C][C]355.502589273868[/C][C]39.4974107261322[/C][/ROW]
[ROW][C]60[/C][C]417[/C][C]358.496252446516[/C][C]58.5037475534841[/C][/ROW]
[/TABLE]
Source: https://freestatistics.org/blog/index.php?pk=115970&T=4

Globally Unique Identifier (entire table): ba.freestatistics.org/blog/index.php?pk=115970&T=4

As an alternative you can also use a QR Code:  

The GUIDs for individual cells are displayed in the table below:

Multiple Linear Regression - Actuals, Interpolation, and Residuals
Time or IndexActualsInterpolationForecastResidualsPrediction Error
1493428.45968351458664.5403164854142
2514467.53856059057746.4614394094232
3522513.0235607650548.97643923494628
4490383.544148868390106.455851131610
5484568.043373478117-84.0433734781174
6506548.741181012466-42.7411810124664
7501396.1532398228104.8467601772
8462403.90353382461858.0964661753822
9465409.02027181732455.9797281826757
10454399.48770492735254.5122950726477
11464429.85192961185534.1480703881448
12427390.56604718267236.433952817328
13460420.92051023328239.0794897667183
14473450.62518941565522.3748105843454
15465483.292408796816-18.2924087968163
16422361.08278302173560.9172169782652
17415554.573585202892-139.573585202892
18413498.348531646049-85.3485316460489
19420365.65684721018654.3431527898145
20363377.233344433889-14.2333444338885
21376377.18470807705-1.18470807704993
22380370.5217936034929.47820639650807
23384373.7199754126110.2800245873900
24346361.600135858812-15.6001358588116
25389400.372245997569-11.3722459975687
26407404.8239839154992.17601608450066
27393427.925695241948-34.9256952419481
28346322.55136364316123.4486363568386
29348520.059679207298-172.059679207298
30353466.32165774468-113.321657744680
31364340.32582894711623.6741710528840
32305344.249919727049-39.2499197270487
33307346.114384981153-39.1143849811527
34312362.6-50.6
35312342.840962477807-30.840962477807
36286311.0161763313-25.0161763312999
37324369.110612740577-45.1106127405771
38336362.657671476135-26.657671476135
39327369.498019109572-42.4980191095718
40302297.0290352189984.97096478100234
41299445.753259704098-146.753259704098
42311439.077537870668-128.077537870668
43315309.6381261734075.36187382659272
44264306.675051153947-42.6750511539466
45278320.974676879177-42.9746768791774
46278313.163901439054-35.1639014390538
47287340.08454322386-53.0845432238601
48279333.321388180701-54.3213881807009
49324371.136947513987-47.1369475139867
50354398.354594602134-44.3545946021342
51354267.2603160866186.7396839133899
5243238.792669247716-195.792669247716
53964421.570102407594542.429897592406
54762392.511091726136369.488908273864
551189.225957846491-188.225957846491
56412373.93815086049838.0618491395015
57370342.70595824529627.2940417547043
58389367.22660003010221.7733999698981
59395355.50258927386839.4974107261322
60417358.49625244651658.5037475534841


Goldfeld-Quandt test for Heteroskedasticity
p-valuesAlternative Hypothesis
breakpoint indexgreater2-sidedless
170.0007740111699011890.001548022339802380.999225988830099
185.37504827591877e-050.0001075009655183750.99994624951724
194.99015348053716e-069.98030696107432e-060.99999500984652
202.34595013465747e-064.69190026931495e-060.999997654049865
212.29570716833964e-074.59141433667927e-070.999999770429283
221.74996333750944e-083.49992667501888e-080.999999982500367
233.39744512648134e-096.79489025296268e-090.999999996602555
242.93231058954377e-105.86462117908755e-100.999999999706769
252.19052700414342e-114.38105400828683e-110.999999999978095
261.09096837585834e-112.18193675171668e-110.99999999998909
271.55287224724834e-123.10574449449669e-120.999999999998447
281.88282540625561e-133.76565081251123e-130.999999999999812
293.0823787396115e-146.164757479223e-140.99999999999997
303.05367865397579e-156.10735730795158e-150.999999999999997
313.13767720464087e-166.27535440928173e-161
322.25990900112583e-174.51981800225166e-171
331.99934898712973e-183.99869797425947e-181
342.12096106913126e-194.24192213826252e-191
351.43687957342699e-202.87375914685398e-201
361.59393378646127e-213.18786757292254e-211
371.25564754472000e-222.51129508943999e-221
381.96969601882128e-233.93939203764256e-231
392.09573700830015e-244.1914740166003e-241
402.26530245821877e-244.53060491643755e-241
413.01694487465744e-206.03388974931488e-201
423.77574034486959e-057.55148068973918e-050.999962242596551
430.1626774309312720.3253548618625440.837322569068728

\begin{tabular}{lllllllll}
\hline
Goldfeld-Quandt test for Heteroskedasticity \tabularnewline
p-values & Alternative Hypothesis \tabularnewline
breakpoint index & greater & 2-sided & less \tabularnewline
17 & 0.000774011169901189 & 0.00154802233980238 & 0.999225988830099 \tabularnewline
18 & 5.37504827591877e-05 & 0.000107500965518375 & 0.99994624951724 \tabularnewline
19 & 4.99015348053716e-06 & 9.98030696107432e-06 & 0.99999500984652 \tabularnewline
20 & 2.34595013465747e-06 & 4.69190026931495e-06 & 0.999997654049865 \tabularnewline
21 & 2.29570716833964e-07 & 4.59141433667927e-07 & 0.999999770429283 \tabularnewline
22 & 1.74996333750944e-08 & 3.49992667501888e-08 & 0.999999982500367 \tabularnewline
23 & 3.39744512648134e-09 & 6.79489025296268e-09 & 0.999999996602555 \tabularnewline
24 & 2.93231058954377e-10 & 5.86462117908755e-10 & 0.999999999706769 \tabularnewline
25 & 2.19052700414342e-11 & 4.38105400828683e-11 & 0.999999999978095 \tabularnewline
26 & 1.09096837585834e-11 & 2.18193675171668e-11 & 0.99999999998909 \tabularnewline
27 & 1.55287224724834e-12 & 3.10574449449669e-12 & 0.999999999998447 \tabularnewline
28 & 1.88282540625561e-13 & 3.76565081251123e-13 & 0.999999999999812 \tabularnewline
29 & 3.0823787396115e-14 & 6.164757479223e-14 & 0.99999999999997 \tabularnewline
30 & 3.05367865397579e-15 & 6.10735730795158e-15 & 0.999999999999997 \tabularnewline
31 & 3.13767720464087e-16 & 6.27535440928173e-16 & 1 \tabularnewline
32 & 2.25990900112583e-17 & 4.51981800225166e-17 & 1 \tabularnewline
33 & 1.99934898712973e-18 & 3.99869797425947e-18 & 1 \tabularnewline
34 & 2.12096106913126e-19 & 4.24192213826252e-19 & 1 \tabularnewline
35 & 1.43687957342699e-20 & 2.87375914685398e-20 & 1 \tabularnewline
36 & 1.59393378646127e-21 & 3.18786757292254e-21 & 1 \tabularnewline
37 & 1.25564754472000e-22 & 2.51129508943999e-22 & 1 \tabularnewline
38 & 1.96969601882128e-23 & 3.93939203764256e-23 & 1 \tabularnewline
39 & 2.09573700830015e-24 & 4.1914740166003e-24 & 1 \tabularnewline
40 & 2.26530245821877e-24 & 4.53060491643755e-24 & 1 \tabularnewline
41 & 3.01694487465744e-20 & 6.03388974931488e-20 & 1 \tabularnewline
42 & 3.77574034486959e-05 & 7.55148068973918e-05 & 0.999962242596551 \tabularnewline
43 & 0.162677430931272 & 0.325354861862544 & 0.837322569068728 \tabularnewline
\hline
\end{tabular}
%Source: https://freestatistics.org/blog/index.php?pk=115970&T=5

[TABLE]
[ROW][C]Goldfeld-Quandt test for Heteroskedasticity[/C][/ROW]
[ROW][C]p-values[/C][C]Alternative Hypothesis[/C][/ROW]
[ROW][C]breakpoint index[/C][C]greater[/C][C]2-sided[/C][C]less[/C][/ROW]
[ROW][C]17[/C][C]0.000774011169901189[/C][C]0.00154802233980238[/C][C]0.999225988830099[/C][/ROW]
[ROW][C]18[/C][C]5.37504827591877e-05[/C][C]0.000107500965518375[/C][C]0.99994624951724[/C][/ROW]
[ROW][C]19[/C][C]4.99015348053716e-06[/C][C]9.98030696107432e-06[/C][C]0.99999500984652[/C][/ROW]
[ROW][C]20[/C][C]2.34595013465747e-06[/C][C]4.69190026931495e-06[/C][C]0.999997654049865[/C][/ROW]
[ROW][C]21[/C][C]2.29570716833964e-07[/C][C]4.59141433667927e-07[/C][C]0.999999770429283[/C][/ROW]
[ROW][C]22[/C][C]1.74996333750944e-08[/C][C]3.49992667501888e-08[/C][C]0.999999982500367[/C][/ROW]
[ROW][C]23[/C][C]3.39744512648134e-09[/C][C]6.79489025296268e-09[/C][C]0.999999996602555[/C][/ROW]
[ROW][C]24[/C][C]2.93231058954377e-10[/C][C]5.86462117908755e-10[/C][C]0.999999999706769[/C][/ROW]
[ROW][C]25[/C][C]2.19052700414342e-11[/C][C]4.38105400828683e-11[/C][C]0.999999999978095[/C][/ROW]
[ROW][C]26[/C][C]1.09096837585834e-11[/C][C]2.18193675171668e-11[/C][C]0.99999999998909[/C][/ROW]
[ROW][C]27[/C][C]1.55287224724834e-12[/C][C]3.10574449449669e-12[/C][C]0.999999999998447[/C][/ROW]
[ROW][C]28[/C][C]1.88282540625561e-13[/C][C]3.76565081251123e-13[/C][C]0.999999999999812[/C][/ROW]
[ROW][C]29[/C][C]3.0823787396115e-14[/C][C]6.164757479223e-14[/C][C]0.99999999999997[/C][/ROW]
[ROW][C]30[/C][C]3.05367865397579e-15[/C][C]6.10735730795158e-15[/C][C]0.999999999999997[/C][/ROW]
[ROW][C]31[/C][C]3.13767720464087e-16[/C][C]6.27535440928173e-16[/C][C]1[/C][/ROW]
[ROW][C]32[/C][C]2.25990900112583e-17[/C][C]4.51981800225166e-17[/C][C]1[/C][/ROW]
[ROW][C]33[/C][C]1.99934898712973e-18[/C][C]3.99869797425947e-18[/C][C]1[/C][/ROW]
[ROW][C]34[/C][C]2.12096106913126e-19[/C][C]4.24192213826252e-19[/C][C]1[/C][/ROW]
[ROW][C]35[/C][C]1.43687957342699e-20[/C][C]2.87375914685398e-20[/C][C]1[/C][/ROW]
[ROW][C]36[/C][C]1.59393378646127e-21[/C][C]3.18786757292254e-21[/C][C]1[/C][/ROW]
[ROW][C]37[/C][C]1.25564754472000e-22[/C][C]2.51129508943999e-22[/C][C]1[/C][/ROW]
[ROW][C]38[/C][C]1.96969601882128e-23[/C][C]3.93939203764256e-23[/C][C]1[/C][/ROW]
[ROW][C]39[/C][C]2.09573700830015e-24[/C][C]4.1914740166003e-24[/C][C]1[/C][/ROW]
[ROW][C]40[/C][C]2.26530245821877e-24[/C][C]4.53060491643755e-24[/C][C]1[/C][/ROW]
[ROW][C]41[/C][C]3.01694487465744e-20[/C][C]6.03388974931488e-20[/C][C]1[/C][/ROW]
[ROW][C]42[/C][C]3.77574034486959e-05[/C][C]7.55148068973918e-05[/C][C]0.999962242596551[/C][/ROW]
[ROW][C]43[/C][C]0.162677430931272[/C][C]0.325354861862544[/C][C]0.837322569068728[/C][/ROW]
[/TABLE]
Source: https://freestatistics.org/blog/index.php?pk=115970&T=5

Globally Unique Identifier (entire table): ba.freestatistics.org/blog/index.php?pk=115970&T=5

As an alternative you can also use a QR Code:  

The GUIDs for individual cells are displayed in the table below:

Goldfeld-Quandt test for Heteroskedasticity
p-valuesAlternative Hypothesis
breakpoint indexgreater2-sidedless
170.0007740111699011890.001548022339802380.999225988830099
185.37504827591877e-050.0001075009655183750.99994624951724
194.99015348053716e-069.98030696107432e-060.99999500984652
202.34595013465747e-064.69190026931495e-060.999997654049865
212.29570716833964e-074.59141433667927e-070.999999770429283
221.74996333750944e-083.49992667501888e-080.999999982500367
233.39744512648134e-096.79489025296268e-090.999999996602555
242.93231058954377e-105.86462117908755e-100.999999999706769
252.19052700414342e-114.38105400828683e-110.999999999978095
261.09096837585834e-112.18193675171668e-110.99999999998909
271.55287224724834e-123.10574449449669e-120.999999999998447
281.88282540625561e-133.76565081251123e-130.999999999999812
293.0823787396115e-146.164757479223e-140.99999999999997
303.05367865397579e-156.10735730795158e-150.999999999999997
313.13767720464087e-166.27535440928173e-161
322.25990900112583e-174.51981800225166e-171
331.99934898712973e-183.99869797425947e-181
342.12096106913126e-194.24192213826252e-191
351.43687957342699e-202.87375914685398e-201
361.59393378646127e-213.18786757292254e-211
371.25564754472000e-222.51129508943999e-221
381.96969601882128e-233.93939203764256e-231
392.09573700830015e-244.1914740166003e-241
402.26530245821877e-244.53060491643755e-241
413.01694487465744e-206.03388974931488e-201
423.77574034486959e-057.55148068973918e-050.999962242596551
430.1626774309312720.3253548618625440.837322569068728


Meta Analysis of Goldfeld-Quandt test for Heteroskedasticity
Description# significant tests% significant testsOK/NOK
1% type I error level260.962962962962963NOK
5% type I error level260.962962962962963NOK
10% type I error level260.962962962962963NOK

\begin{tabular}{lllllllll}
\hline
Meta Analysis of Goldfeld-Quandt test for Heteroskedasticity \tabularnewline
Description & # significant tests & % significant tests & OK/NOK \tabularnewline
1% type I error level & 26 & 0.962962962962963 & NOK \tabularnewline
5% type I error level & 26 & 0.962962962962963 & NOK \tabularnewline
10% type I error level & 26 & 0.962962962962963 & NOK \tabularnewline
\hline
\end{tabular}
%Source: https://freestatistics.org/blog/index.php?pk=115970&T=6

[TABLE]
[ROW][C]Meta Analysis of Goldfeld-Quandt test for Heteroskedasticity[/C][/ROW]
[ROW][C]Description[/C][C]# significant tests[/C][C]% significant tests[/C][C]OK/NOK[/C][/ROW]
[ROW][C]1% type I error level[/C][C]26[/C][C]0.962962962962963[/C][C]NOK[/C][/ROW]
[ROW][C]5% type I error level[/C][C]26[/C][C]0.962962962962963[/C][C]NOK[/C][/ROW]
[ROW][C]10% type I error level[/C][C]26[/C][C]0.962962962962963[/C][C]NOK[/C][/ROW]
[/TABLE]
Source: https://freestatistics.org/blog/index.php?pk=115970&T=6

Globally Unique Identifier (entire table): ba.freestatistics.org/blog/index.php?pk=115970&T=6

As an alternative you can also use a QR Code:  

The GUIDs for individual cells are displayed in the table below:

Meta Analysis of Goldfeld-Quandt test for Heteroskedasticity
Description# significant tests% significant testsOK/NOK
1% type I error level260.962962962962963NOK
5% type I error level260.962962962962963NOK
10% type I error level260.962962962962963NOK


Parameters (Session):
par1 = 1 ; par2 = Include Monthly Dummies ; par3 = Linear Trend ;
Parameters (R input):
par1 = 1 ; par2 = Include Monthly Dummies ; par3 = Linear Trend ;
R code (references can be found in the software module):
library(lattice)
library(lmtest)
n25 <- 25 #minimum number of obs. for Goldfeld-Quandt test
par1 <- as.numeric(par1)
x <- t(y)
k <- length(x[1,])
n <- length(x[,1])
x1 <- cbind(x[,par1], x[,1:k!=par1])
mycolnames <- c(colnames(x)[par1], colnames(x)[1:k!=par1])
colnames(x1) <- mycolnames #colnames(x)[par1]
x <- x1
if (par3 == 'First Differences'){
x2 <- array(0, dim=c(n-1,k), dimnames=list(1:(n-1), paste('(1-B)',colnames(x),sep='')))
for (i in 1:n-1) {
for (j in 1:k) {
x2[i,j] <- x[i+1,j] - x[i,j]
}
}
x <- x2
}
if (par2 == 'Include Monthly Dummies'){
x2 <- array(0, dim=c(n,11), dimnames=list(1:n, paste('M', seq(1:11), sep ='')))
for (i in 1:11){
x2[seq(i,n,12),i] <- 1
}
x <- cbind(x, x2)
}
if (par2 == 'Include Quarterly Dummies'){
x2 <- array(0, dim=c(n,3), dimnames=list(1:n, paste('Q', seq(1:3), sep ='')))
for (i in 1:3){
x2[seq(i,n,4),i] <- 1
}
x <- cbind(x, x2)
}
k <- length(x[1,])
if (par3 == 'Linear Trend'){
x <- cbind(x, c(1:n))
colnames(x)[k+1] <- 't'
}
x
k <- length(x[1,])
df <- as.data.frame(x)
(mylm <- lm(df))
(mysum <- summary(mylm))
if (n > n25) {
kp3 <- k + 3
nmkm3 <- n - k - 3
gqarr <- array(NA, dim=c(nmkm3-kp3+1,3))
numgqtests <- 0
numsignificant1 <- 0
numsignificant5 <- 0
numsignificant10 <- 0
for (mypoint in kp3:nmkm3) {
j <- 0
numgqtests <- numgqtests + 1
for (myalt in c('greater', 'two.sided', 'less')) {
j <- j + 1
gqarr[mypoint-kp3+1,j] <- gqtest(mylm, point=mypoint, alternative=myalt)$p.value
}
if (gqarr[mypoint-kp3+1,2] < 0.01) numsignificant1 <- numsignificant1 + 1
if (gqarr[mypoint-kp3+1,2] < 0.05) numsignificant5 <- numsignificant5 + 1
if (gqarr[mypoint-kp3+1,2] < 0.10) numsignificant10 <- numsignificant10 + 1
}
gqarr
}
bitmap(file='test0.png')
plot(x[,1], type='l', main='Actuals and Interpolation', ylab='value of Actuals and Interpolation (dots)', xlab='time or index')
points(x[,1]-mysum$resid)
grid()
dev.off()
bitmap(file='test1.png')
plot(mysum$resid, type='b', pch=19, main='Residuals', ylab='value of Residuals', xlab='time or index')
grid()
dev.off()
bitmap(file='test2.png')
hist(mysum$resid, main='Residual Histogram', xlab='values of Residuals')
grid()
dev.off()
bitmap(file='test3.png')
densityplot(~mysum$resid,col='black',main='Residual Density Plot', xlab='values of Residuals')
dev.off()
bitmap(file='test4.png')
qqnorm(mysum$resid, main='Residual Normal Q-Q Plot')
qqline(mysum$resid)
grid()
dev.off()
(myerror <- as.ts(mysum$resid))
bitmap(file='test5.png')
dum <- cbind(lag(myerror,k=1),myerror)
dum
dum1 <- dum[2:length(myerror),]
dum1
z <- as.data.frame(dum1)
z
plot(z,main=paste('Residual Lag plot, lowess, and regression line'), ylab='values of Residuals', xlab='lagged values of Residuals')
lines(lowess(z))
abline(lm(z))
grid()
dev.off()
bitmap(file='test6.png')
acf(mysum$resid, lag.max=length(mysum$resid)/2, main='Residual Autocorrelation Function')
grid()
dev.off()
bitmap(file='test7.png')
pacf(mysum$resid, lag.max=length(mysum$resid)/2, main='Residual Partial Autocorrelation Function')
grid()
dev.off()
bitmap(file='test8.png')
opar <- par(mfrow = c(2,2), oma = c(0, 0, 1.1, 0))
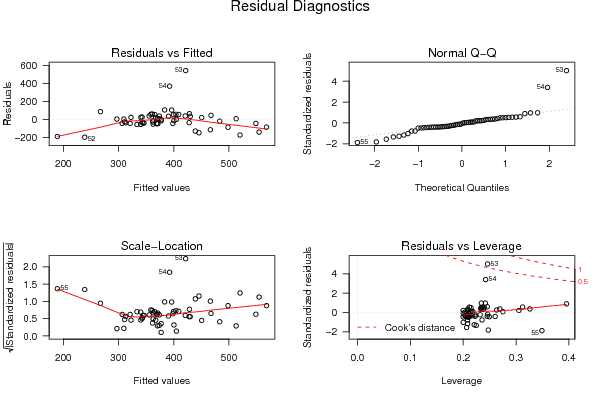
plot(mylm, las = 1, sub='Residual Diagnostics')
par(opar)
dev.off()
if (n > n25) {
bitmap(file='test9.png')
plot(kp3:nmkm3,gqarr[,2], main='Goldfeld-Quandt test',ylab='2-sided p-value',xlab='breakpoint')
grid()
dev.off()
}
load(file='createtable')
a<-table.start()
a<-table.row.start(a)
a<-table.element(a, 'Multiple Linear Regression - Estimated Regression Equation', 1, TRUE)
a<-table.row.end(a)
myeq <- colnames(x)[1]
myeq <- paste(myeq, '[t] = ', sep='')
for (i in 1:k){
if (mysum$coefficients[i,1] > 0) myeq <- paste(myeq, '+', '')
myeq <- paste(myeq, mysum$coefficients[i,1], sep=' ')
if (rownames(mysum$coefficients)[i] != '(Intercept)') {
myeq <- paste(myeq, rownames(mysum$coefficients)[i], sep='')
if (rownames(mysum$coefficients)[i] != 't') myeq <- paste(myeq, '[t]', sep='')
}
}
myeq <- paste(myeq, ' + e[t]')
a<-table.row.start(a)
a<-table.element(a, myeq)
a<-table.row.end(a)
a<-table.end(a)
table.save(a,file='mytable1.tab')
a<-table.start()
a<-table.row.start(a)
a<-table.element(a,hyperlink('ols1.htm','Multiple Linear Regression - Ordinary Least Squares',''), 6, TRUE)
a<-table.row.end(a)
a<-table.row.start(a)
a<-table.element(a,'Variable',header=TRUE)
a<-table.element(a,'Parameter',header=TRUE)
a<-table.element(a,'S.D.',header=TRUE)
a<-table.element(a,'T-STAT
H0: parameter = 0',header=TRUE)
a<-table.element(a,'2-tail p-value',header=TRUE)
a<-table.element(a,'1-tail p-value',header=TRUE)
a<-table.row.end(a)
for (i in 1:k){
a<-table.row.start(a)
a<-table.element(a,rownames(mysum$coefficients)[i],header=TRUE)
a<-table.element(a,mysum$coefficients[i,1])
a<-table.element(a, round(mysum$coefficients[i,2],6))
a<-table.element(a, round(mysum$coefficients[i,3],4))
a<-table.element(a, round(mysum$coefficients[i,4],6))
a<-table.element(a, round(mysum$coefficients[i,4]/2,6))
a<-table.row.end(a)
}
a<-table.end(a)
table.save(a,file='mytable2.tab')
a<-table.start()
a<-table.row.start(a)
a<-table.element(a, 'Multiple Linear Regression - Regression Statistics', 2, TRUE)
a<-table.row.end(a)
a<-table.row.start(a)
a<-table.element(a, 'Multiple R',1,TRUE)
a<-table.element(a, sqrt(mysum$r.squared))
a<-table.row.end(a)
a<-table.row.start(a)
a<-table.element(a, 'R-squared',1,TRUE)
a<-table.element(a, mysum$r.squared)
a<-table.row.end(a)
a<-table.row.start(a)
a<-table.element(a, 'Adjusted R-squared',1,TRUE)
a<-table.element(a, mysum$adj.r.squared)
a<-table.row.end(a)
a<-table.row.start(a)
a<-table.element(a, 'F-TEST (value)',1,TRUE)
a<-table.element(a, mysum$fstatistic[1])
a<-table.row.end(a)
a<-table.row.start(a)
a<-table.element(a, 'F-TEST (DF numerator)',1,TRUE)
a<-table.element(a, mysum$fstatistic[2])
a<-table.row.end(a)
a<-table.row.start(a)
a<-table.element(a, 'F-TEST (DF denominator)',1,TRUE)
a<-table.element(a, mysum$fstatistic[3])
a<-table.row.end(a)
a<-table.row.start(a)
a<-table.element(a, 'p-value',1,TRUE)
a<-table.element(a, 1-pf(mysum$fstatistic[1],mysum$fstatistic[2],mysum$fstatistic[3]))
a<-table.row.end(a)
a<-table.row.start(a)
a<-table.element(a, 'Multiple Linear Regression - Residual Statistics', 2, TRUE)
a<-table.row.end(a)
a<-table.row.start(a)
a<-table.element(a, 'Residual Standard Deviation',1,TRUE)
a<-table.element(a, mysum$sigma)
a<-table.row.end(a)
a<-table.row.start(a)
a<-table.element(a, 'Sum Squared Residuals',1,TRUE)
a<-table.element(a, sum(myerror*myerror))
a<-table.row.end(a)
a<-table.end(a)
table.save(a,file='mytable3.tab')
a<-table.start()
a<-table.row.start(a)
a<-table.element(a, 'Multiple Linear Regression - Actuals, Interpolation, and Residuals', 4, TRUE)
a<-table.row.end(a)
a<-table.row.start(a)
a<-table.element(a, 'Time or Index', 1, TRUE)
a<-table.element(a, 'Actuals', 1, TRUE)
a<-table.element(a, 'Interpolation
Forecast', 1, TRUE)
a<-table.element(a, 'Residuals
Prediction Error', 1, TRUE)
a<-table.row.end(a)
for (i in 1:n) {
a<-table.row.start(a)
a<-table.element(a,i, 1, TRUE)
a<-table.element(a,x[i])
a<-table.element(a,x[i]-mysum$resid[i])
a<-table.element(a,mysum$resid[i])
a<-table.row.end(a)
}
a<-table.end(a)
table.save(a,file='mytable4.tab')
if (n > n25) {
a<-table.start()
a<-table.row.start(a)
a<-table.element(a,'Goldfeld-Quandt test for Heteroskedasticity',4,TRUE)
a<-table.row.end(a)
a<-table.row.start(a)
a<-table.element(a,'p-values',header=TRUE)
a<-table.element(a,'Alternative Hypothesis',3,header=TRUE)
a<-table.row.end(a)
a<-table.row.start(a)
a<-table.element(a,'breakpoint index',header=TRUE)
a<-table.element(a,'greater',header=TRUE)
a<-table.element(a,'2-sided',header=TRUE)
a<-table.element(a,'less',header=TRUE)
a<-table.row.end(a)
for (mypoint in kp3:nmkm3) {
a<-table.row.start(a)
a<-table.element(a,mypoint,header=TRUE)
a<-table.element(a,gqarr[mypoint-kp3+1,1])
a<-table.element(a,gqarr[mypoint-kp3+1,2])
a<-table.element(a,gqarr[mypoint-kp3+1,3])
a<-table.row.end(a)
}
a<-table.end(a)
table.save(a,file='mytable5.tab')
a<-table.start()
a<-table.row.start(a)
a<-table.element(a,'Meta Analysis of Goldfeld-Quandt test for Heteroskedasticity',4,TRUE)
a<-table.row.end(a)
a<-table.row.start(a)
a<-table.element(a,'Description',header=TRUE)
a<-table.element(a,'# significant tests',header=TRUE)
a<-table.element(a,'% significant tests',header=TRUE)
a<-table.element(a,'OK/NOK',header=TRUE)
a<-table.row.end(a)
a<-table.row.start(a)
a<-table.element(a,'1% type I error level',header=TRUE)
a<-table.element(a,numsignificant1)
a<-table.element(a,numsignificant1/numgqtests)
if (numsignificant1/numgqtests < 0.01) dum <- 'OK' else dum <- 'NOK'
a<-table.element(a,dum)
a<-table.row.end(a)
a<-table.row.start(a)
a<-table.element(a,'5% type I error level',header=TRUE)
a<-table.element(a,numsignificant5)
a<-table.element(a,numsignificant5/numgqtests)
if (numsignificant5/numgqtests < 0.05) dum <- 'OK' else dum <- 'NOK'
a<-table.element(a,dum)
a<-table.row.end(a)
a<-table.row.start(a)
a<-table.element(a,'10% type I error level',header=TRUE)
a<-table.element(a,numsignificant10)
a<-table.element(a,numsignificant10/numgqtests)
if (numsignificant10/numgqtests < 0.1) dum <- 'OK' else dum <- 'NOK'
a<-table.element(a,dum)
a<-table.row.end(a)
a<-table.end(a)
table.save(a,file='mytable6.tab')
}